. 2025 Feb;21(2):394-406.
doi: 10.1080/15548627.2024.2403152. Epub 2024 Sep 19.

Divergent effects of acute and chronic PPT1 inhibition in melanoma

Affiliations

Divergent effects of acute and chronic PPT1 inhibition in melanoma

Mary Ann S Crissey et al. Autophagy. 2025 Feb.

Abstract

Macroautophagy/autophagy-lysosome function promotes growth and survival of cancer cells, making them attractive targets for cancer therapy. One intriguing lysosomal target is PPT1 (palmitoyl-protein thioesterase 1). PPT1 inhibitors derived from chloroquine block autophagy, have significant antitumor activity in preclinical models and are being developed for clinical trials. However, the role of PPT1 in tumorigenesis remains poorly understood. Here we report that in melanoma cells, acute siRNA or pharmacological PPT1 inhibition led to increased ferroptosis sensitivity and significant loss of viability, whereas chronic PPT1 knockout using CRISPR-Cas9 produced blunted ferroptosis that led to sustained viability and growth. Each mode of PPT1 inhibition produced lysosome-autophagy inhibition but distinct proteomic changes, demonstrating the complexity of cellular adaptation mechanisms. To determine whether total genetic loss of Ppt1 would affect tumorigenesis in vivo, we developed a Ppt1 conditional knockout mouse model. We then crossed it into the BrafCA, PtenloxP, Tyr:CreERT2 melanoma mouse model to investigate the impact of Ppt1 loss on tumorigenesis. Loss of Ppt1 had no impact on melanoma histology, time to tumor initiation, or survival of tumor-bearing mice. These results suggest that chemical PPT1 inhibitors produce different adaptations than genetic PPT1 inhibition, and additional studies are warranted to fully understand the mechanism of chloroquine derivatives that target PPT1 in cancer.Abbreviations: 4-HT: 4-hydroxytamoxifen; BRAF: B-Raf proto-oncogene, serine/threonine kinase; cKO: conditional knockout; CRISPR-Cas9: clustered regularly interspaced short palindromic repeats-CRISPR-associated protein 9; DC661: A specific PPT1 inhibitor; DMSO: dimethyl sulfoxide; Dox; doxycycline hyclate; Easi-CRISPR: efficient additions with ssDNA inserts-CRISPR; GNS561/ezurpimtrostat: A PPT1 inhibitor; Hug: human guide; iCas: inducible CRISPR-Cas9; KO: knockout; LC-MS/MS: Liquid chromatography-tandem mass spectrometry; LDLR: low density lipoprotein receptor; NFE2L2/NRF2: NFE2 like bZIP transcription factor 2; NT: non-target; PTEN: phosphatase and tensin homolog; PPT1: palmitoyl-protein thioesterase 1; RSL3: RAS-selective lethal small molecule 3; SCRIB/SCRB1: scribble planar cell polarity protein; Tyr:CreERT2: tyrosinase-driven Cre recombinase fused with the tamoxifen-inducible mutant ligand binding domain of the human estrogen receptor; UGCG: UDP-glucose ceramide glucosyltransferase; WT: wild-type.

Keywords: Autophagy; ferroptosis; lysosome; mouse model; palmitoyl protein thioesterase 1.


Conflict of interest statement

RKA is an inventor on patents related to dimeric chloroquines. The patents are licensed to Pinpoint Therapeutics, and RKA is a scientific founder. RKA is a consultant for Deciphera, Tasca Therapeutics, and gets research funding from Novartis, Bristol-Myers Squibb, Deciphera, Springworks, Merck. The other authors declare no conflicts of interest.

Figures
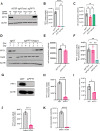
Figure 1.
Figure 1.
Cytotoxicity observed by acute but not chronic PPT1 inhibition. (A) Immunoblot demonstrating PPT1 knockout in A375P sgPPT1 Hug1 and Hug3 clones compared to A375P sgNT cells. sg: small guide RNA; Hug: human guide; NT: non-target. (B) Van Diggelen PPT1 biochemical assay in the indicated cells. n = 3, repeated twice. ****P ≤ 0.0001; one way ANOVA test. (C) Cell growth at 4 days after plating the indicated cell lines at 1X10⁵. n = 3, repeated 3 times, ns: nonsignificant, one way ANOVA. (D) Immunoblot demonstrating PPT1 knockdown in A375P cells after doxycycline (Dox) induction of Cas9 expression. Cells with (+) or without (-) Dox treatment were collected on the indicated days after the start of treatment. (E) A375P iCas9 cell growth at 6 days after Dox treatment. (F) A375P iCas9 Van Diggelen PPT1 biochemical assay at 6 days after Dox treatment. (G) Immunoblot of A375P sgNT cells transfected with siNT or siPPT1 for 48 h. (H) Van Diggelen PPT1 biochemical assay in indicated cells 48 h after siRNA transfection. n = 3. (I) Cell growth 48 h after siRNA transfection, n = 3. (J) Van Diggelen PPT1 biochemical assay in A375P cells treated with 3 µm DC661 for 24 h, n = 3. (K) Cell number after treatment with 3 µm DC661 for 24 h. All cell growth assays and enzyme assays were performed in triplicate. *P ≤ 0.05; ****P ≤ 0.0001; one way ANOVA was used when more than 2 groups were compared (B, C, and F), two-tailed unpaired t test was used when 2 groups were compared (E, H-K).
Figure 2.
Figure 2.
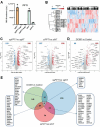
Proteomic changes during acute versus chronic PPT1 inhibition. (A) MS abundance of PPT1 protein in A375P cells in which PPT1 is depleted by either CRISPR-Cas9, or siRNA. NT: non-target, sg: small guide RNA. (B) Unsupervised hierarchical cluster comparing proteomes of constitutive Cas9 (sg) and acute siRNA (si) PPT1 inhibition (C) Volcano plots of sgPPT1 vs. sgNT and siPPT1 vs. siNT, (D) Volcano plot of DC661 vs. control (DMSO), reanalyzed from reference 12. Red = q-value ≤0.05 and ≥ 1.5 fold increase; Blue = q-value ≤0.05 and ≥ 1.5 fold decrease. (E) Venn diagram demonstrating overlapping proteins that are significantly increased with sgPPT1 vs. sgNT, siPPT1 vs. siNT, and DC661 vs. control (DMSO).
Figure 3.
Figure 3.
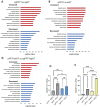
Pathway alterations in acute and chronic PPT1 inhibition. (A) Top enriched canonical pathways identified by DAVID pathway analysis when comparing significantly increasedor decreased proteins in sgPPT1 vs. sgNT. (B) Top enriched pathways identified when comparing significantly increased or decreased proteins in siPPT1 vs. siNT. (C) Top enriched pathways identified when comparing normalized siPPT1 vs. sgPPT1. Enriched pathways with Fisher’s exact test p-value ≤0.01 were considered significant. (D) Bodipy-C11 analysis indicated blunted ferroptosis induction in A375P sgNT and sgPPT1 after treatment with 0.5 μM RSL3. One way ANOVA was used to compare the groups. *P ≤ 0.05; ***P ≤ 0.001 (E) Bodipy-C11 analysis after 0.5 μM RSL3 treatment indicated enhanced ferroptosis induction in siPPT1 treated A375P compared to cells that received siNT. One way ANOVA was used to compare the groups. ***P ≤ 0.0001; ****P ≤ 0.0001. RFU: relative fluorescence units.
Figure 4.
Figure 4.
A Ppt1 conditional knockout mouse. (A and B)Schema for generating a Ppt1 conditional knockout allele using 2 CRISPR-Cas9 strategies that were pursued concurrently. (A) Sequential LoxP site insertions Cas9 mRNA, 2 guide RNAs (sgRNA) and 2 repair templates (LoxP sites represented by arrowheads – red 3’ LoxP, yellow 5’ LoxP) were injected into the pronucleus of fertilized C57Bl/6J oocytes. Mice with the 3’ LoxP site were obtained and then bred together. Sperm from a mouse homozygous for the 3’LoxP site was used to in vitro fertilize oocytes which were then injected with Cas9 mRNA, the 5’ guide RNA, and the 5’ LoxP repair template. Black arrowheads indicate primer locations on either side of the LoxP insertion sites used for screening in (C). (B) Easi-CRISPR – Cas9 mRNA, 2 guide RNAs, and a long single stranded repair template with both LoxP sites and exon 1 were injected into fertilized oocytes. Black arrowheads indicate primer locations on either side of the LoxP insertion sites used for screening in (D). (C) PCR screening of the sequential founders with primer pairs Ppt1 F3/R3 and 3’ Ppt1 F3/R3. Only #6 (red number) was positive for both 5’ and 3’ LoxP sites. (D) PCR screening of Easi-CRISPR founders with primer pairs Ppt1 F7/R7 and Ppt1 205 F/611 R. Founders #25, 32, 34, 37 & 39 (red numbers) appeared to have both 5’ LoxP and 3’ LoxP sites. (E) Representative images of 4-HT induced Braf mutant pten null melanoma tumors with the indicated Ppt1 genotypes. (F) PCR of the entire 1381 bp Ppt1 F3/611 R amplicon (diagram indicates location of the primers) of DNA isolated from tails and from 4-HT induced melanoma tumors demonstrates deletion of Ppt1 exon 1 by Cre Recombinase in ppt1fl/fl and Ppt1fl/WT tumors in both line 6 and line 25, but not in wild-type Ppt1 mice. Expected bands for deletion of Ppt1 exon 1 were 384 bp for line 6 and 847 bp for line 25. G: Genomic DNA, T: tumor DNA.
Figure 5.
Figure 5.
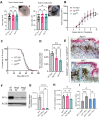
Ppt1 is dispensable for melanoma tumor growth. (A) Time to tumor formation by genotype in line 6 and line 25 (WT n = 17; Ppt1fl/WT n = 38; ppt1fl/fl n = 49) graphed is time to first appearance of black dots after 4-HT treatment, and time to coalescence (merging of the tumor dots). Representative images are shown. (B) Tumor growth measured weekly after 4-HT treatment in both lines by genotype (WT n = 43; Ppt1fl/WT n = 65; ppt1fl/fl n = 65); ANOVA comparing tumor volumes on the last day. (C) Kaplan-Meier survival curve (time to 2000 mm3 tumor volume) by genotype in both lines. (D) Van Diggelen PPT1 enzyme assay in tumor samples from 3 mice of each Ppt1 genotype with duplicate technical replicates. (E) Representative H&E slides of melanoma tumors of each genotype at 100X magnification. (F) Immunoblot demonstrating Ppt1 knockout in YUMM1.7 sgPpt1 Msg1 and Msg3 clones compared to YUMM1.7 sgNT cells. sg: small guide RNA; Msg: mouse guide; NT: non-target. (G) Van Diggelen PPT1 biochemical assay in the indicated cells. n = 3, repeated twice. (H) Cell growth at 3 days after plating the indicated cell lines at 1X10⁵. n = 3. (I) Bodipy C-11 fluorescence of YUMM1.7 cells treated as indicated for 24 h demonstrated a blunted response to RSL3 ferroptosis induction in sgPpt1 cells. One way ANOVA test was used to compare multiple groups. ns: nonsignificant,*p ≤ 0.05, **p ≤ 0.005, ***P ≤ 0.001; ****P ≤ 0.0001; RFU: relative fluorescence units.

References

    1. Yang A, Herter-Sprie G, Zhang H, et al. Autophagy sustains pancreatic cancer growth through both cell-autonomous and nonautonomous mechanisms. Cancer Discov. 2018. Mar;8(3):276–287. doi: 10.1158/2159-8290.CD-17-0952 - DOI - PMC - PubMed
    1. Xie X, Koh JY, Price S, et al. Atg7 overcomes senescence and promotes growth of BrafV600E-Driven melanoma. Cancer Discov. 2015. Apr;5(4):410–423. doi: 10.1158/2159-8290.CD-14-1473 - DOI - PMC - PubMed
    1. Perera RM, Stoykova S, Nicolay BN, et al. Transcriptional control of autophagy-lysosome function drives pancreatic cancer metabolism. Nature. 2015. Aug 20;524(7565):361–365. doi: 10.1038/nature14587 - DOI - PMC - PubMed
    1. Jain V, Singh MP, Amaravadi RK.. Recent advances in targeting autophagy in cancer. Trends Pharmacol Sci. 2023. May;44(5):290–302. doi: 10.1016/j.tips.2023.02.003 - DOI - PMC - PubMed
    1. Abu-Remaileh M, Wyant GA, Kim C, et al. Lysosomal metabolomics reveals V-ATPase- and mTOR-dependent regulation of amino acid efflux from lysosomes. Science. 2017. Nov 10;358(6364):807–813. doi: 10.1126/science.aan6298 - DOI - PMC - PubMed

Publication types