. 2024 Sep 12;7(12):e202302041.
doi: 10.26508/lsa.202302041. Print 2024 Dec.

Crosstalk between bone metastatic cancer cells and sensory nerves in bone metastatic progression

Affiliations

Crosstalk between bone metastatic cancer cells and sensory nerves in bone metastatic progression

Sun H Park et al. Life Sci Alliance. .

Abstract

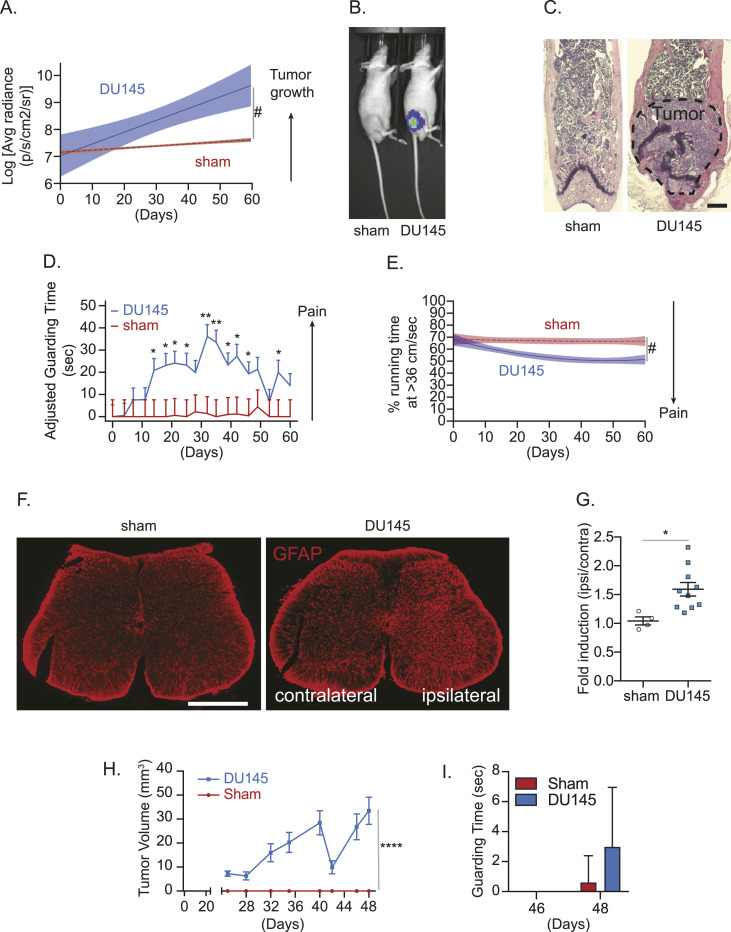
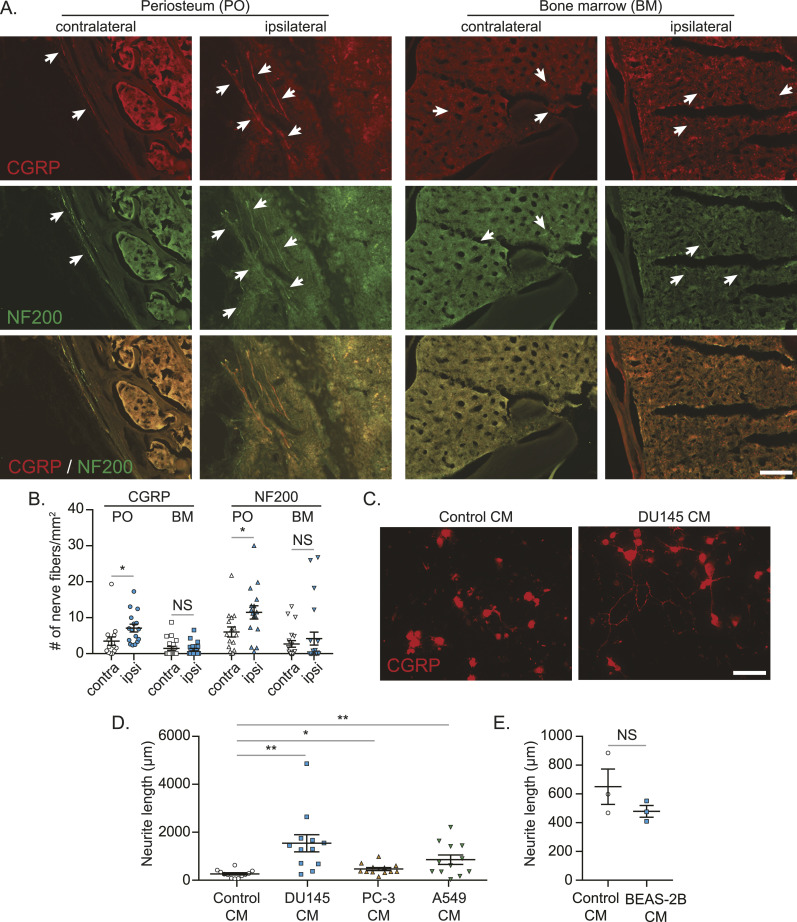
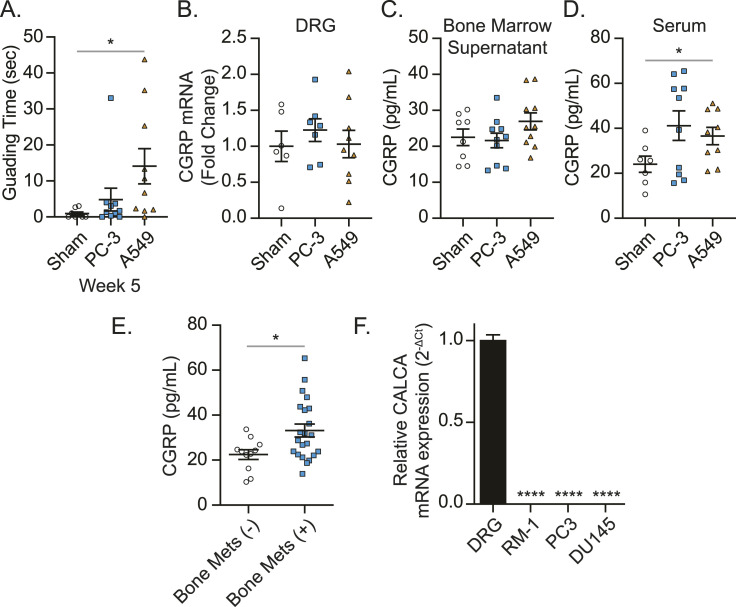
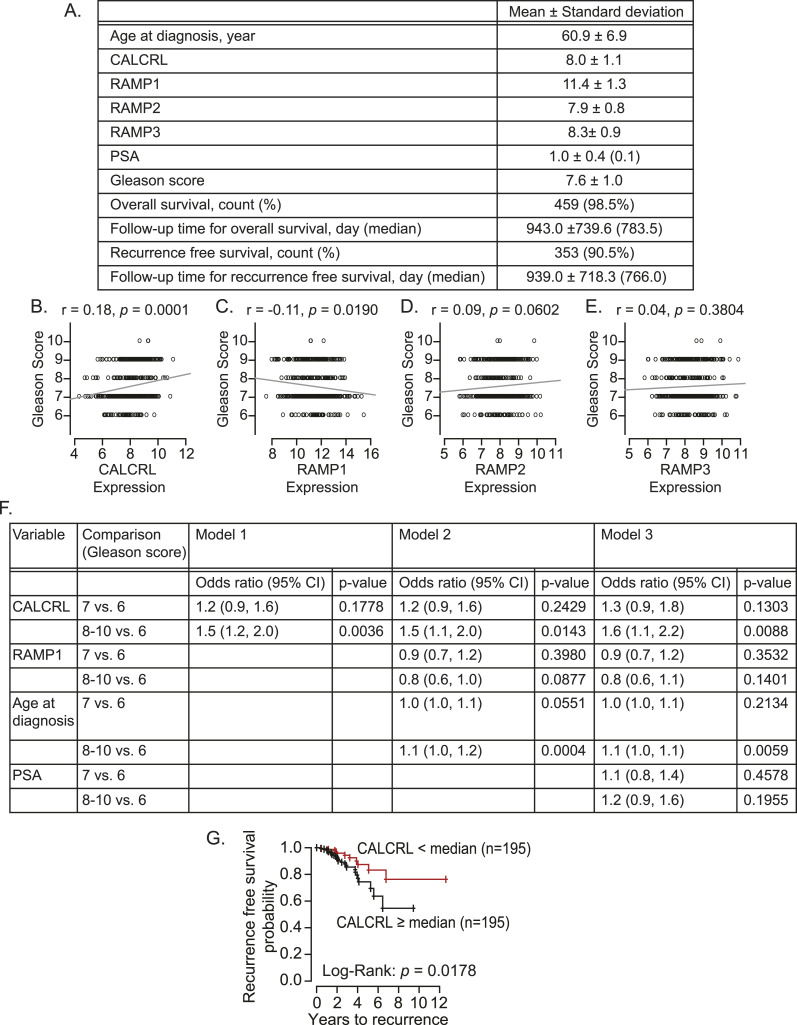
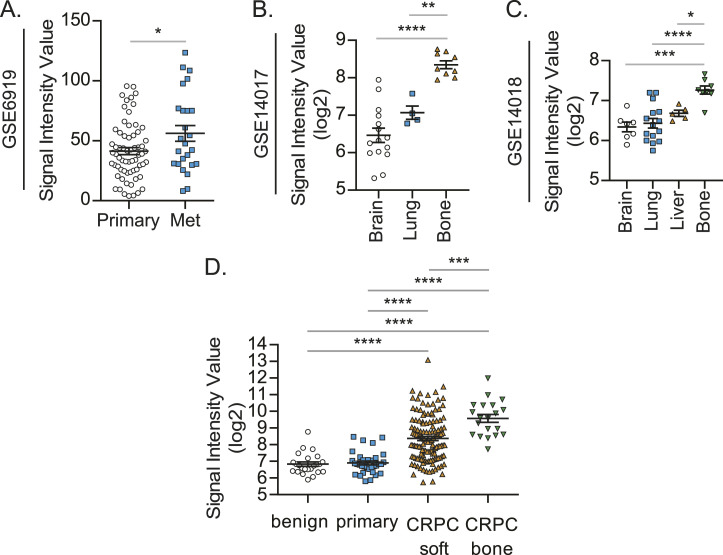
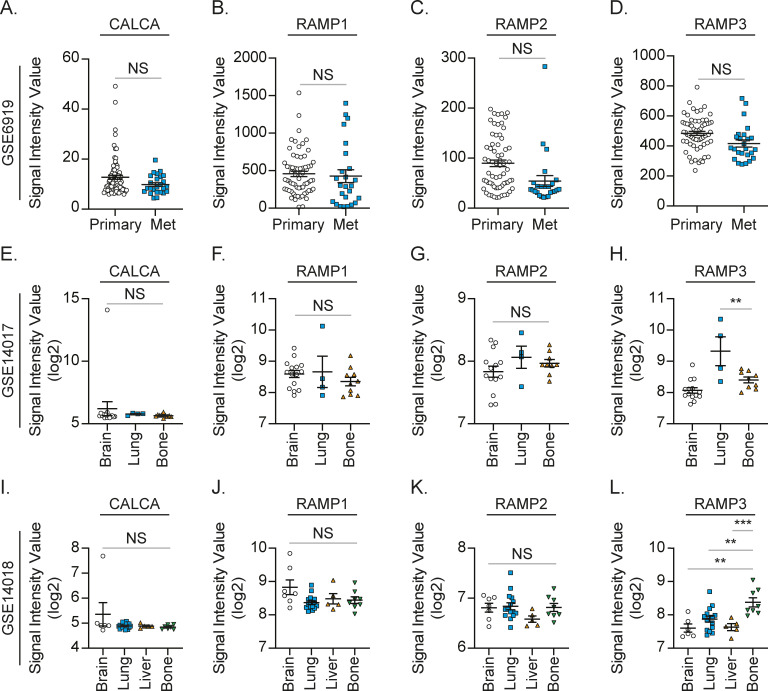
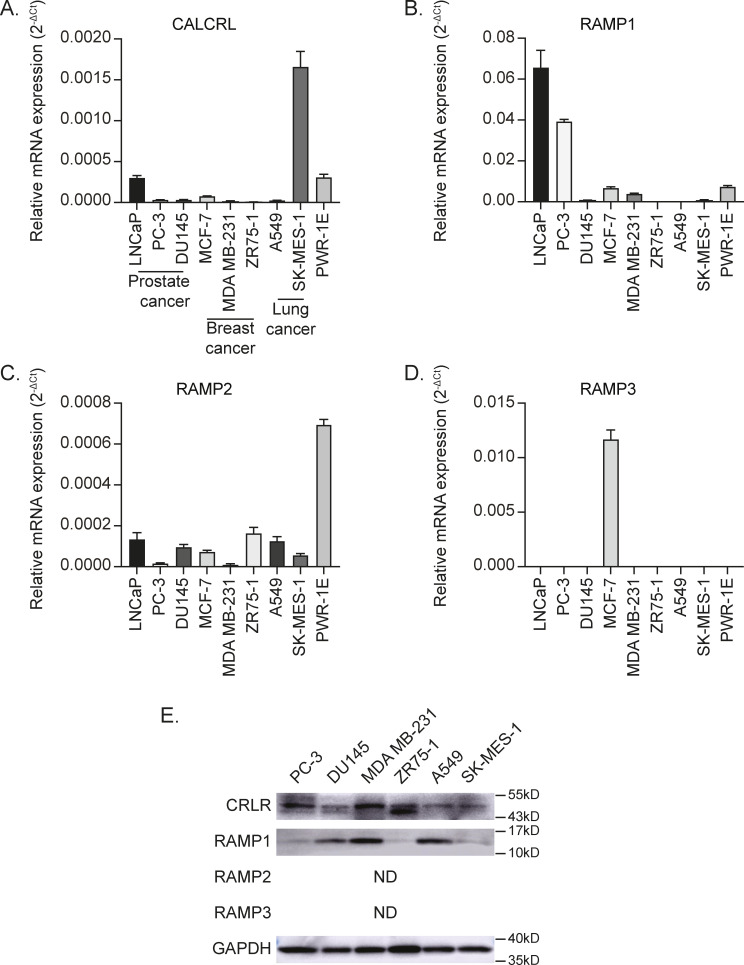
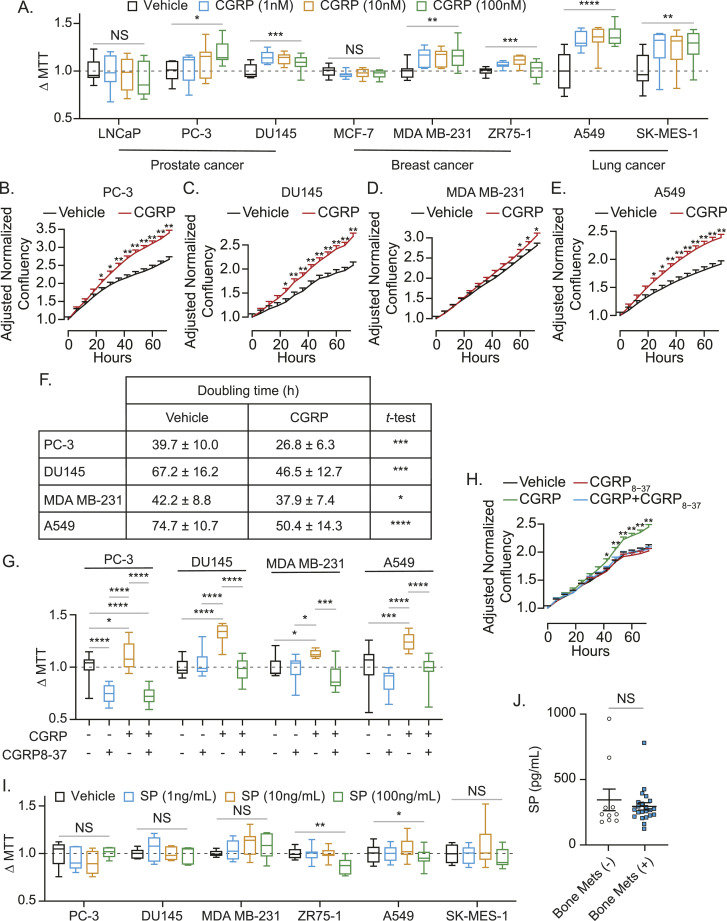
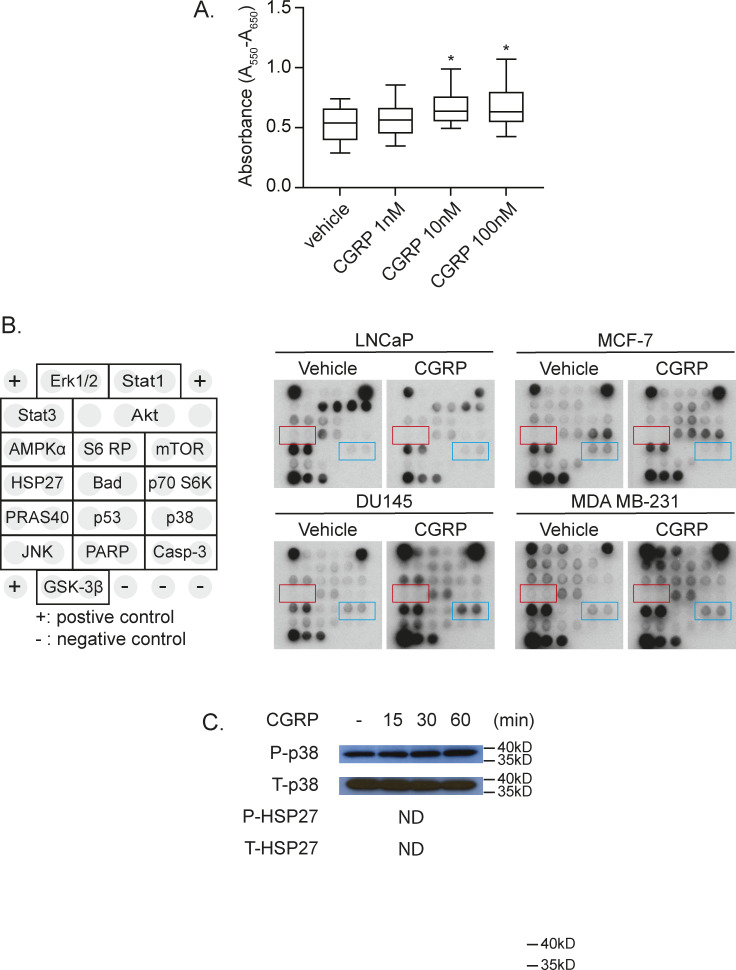
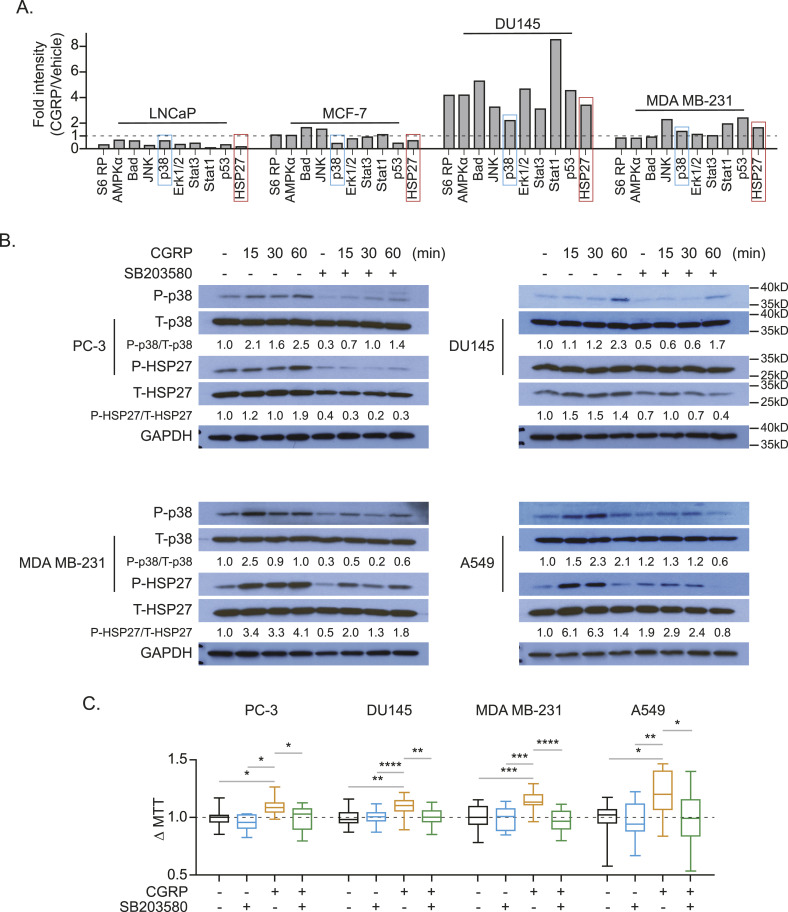
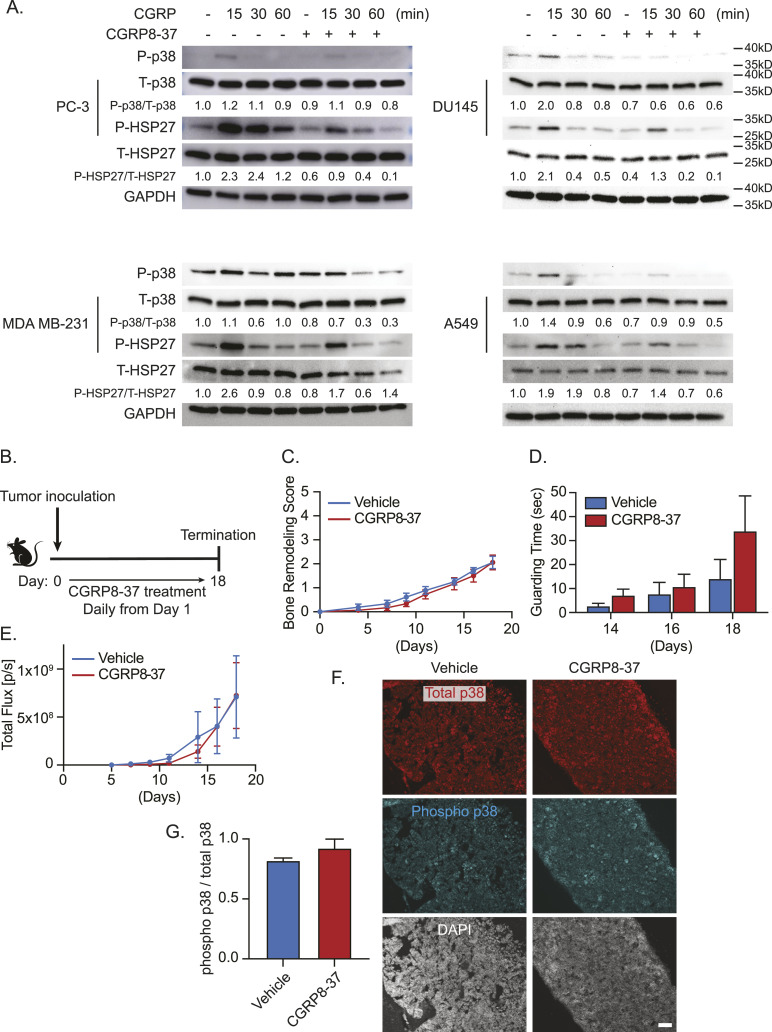
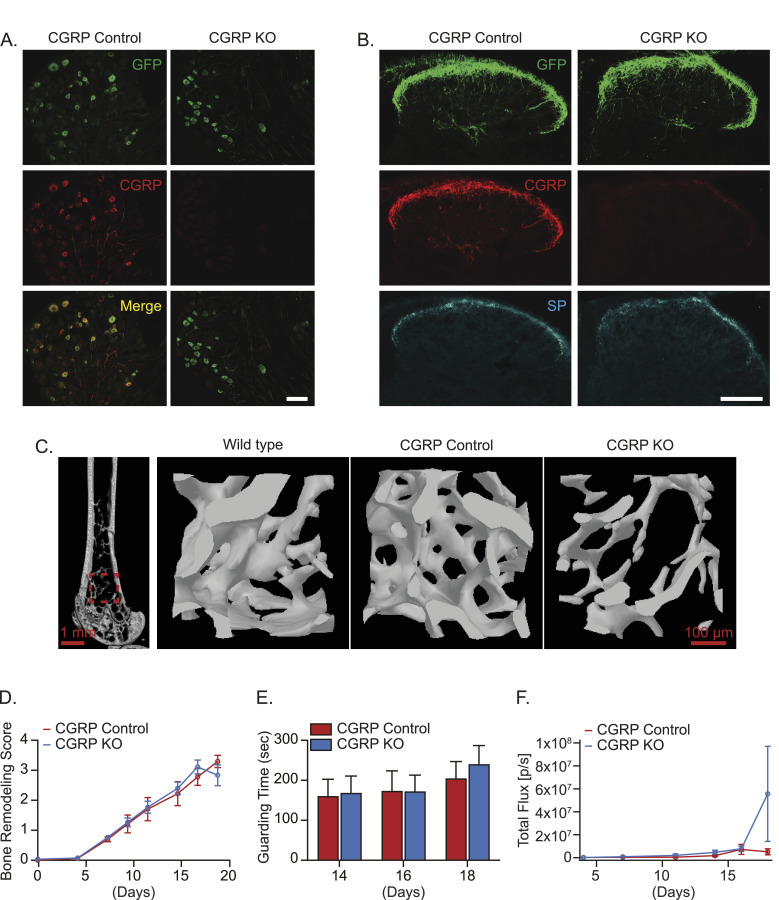
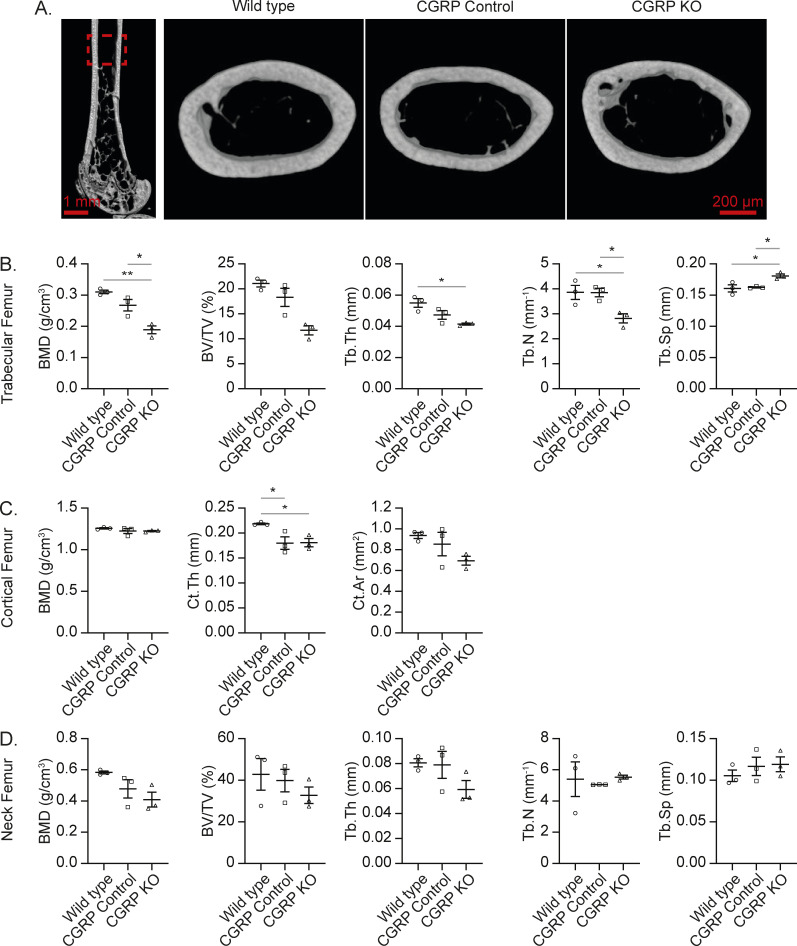
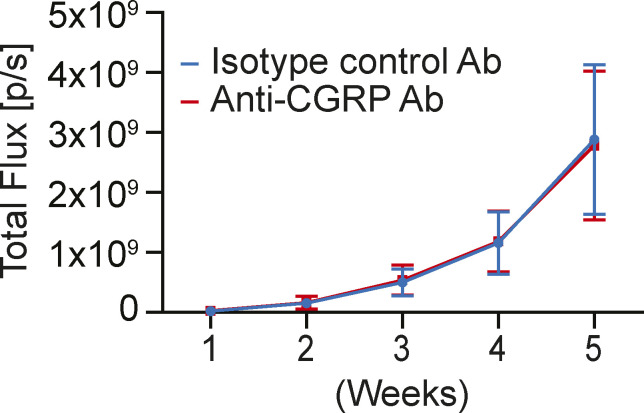
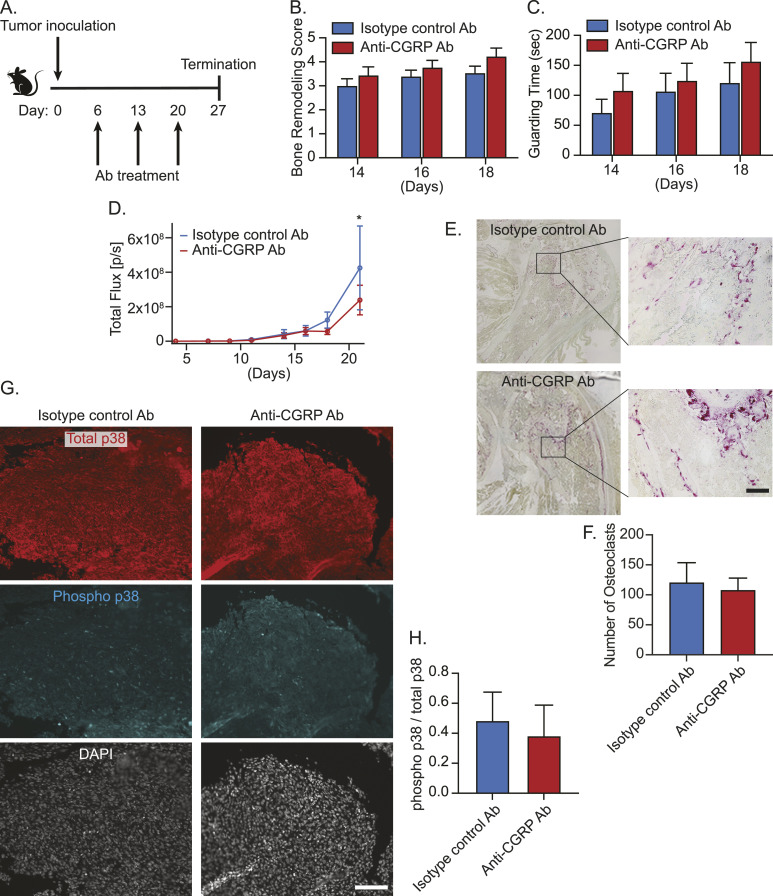
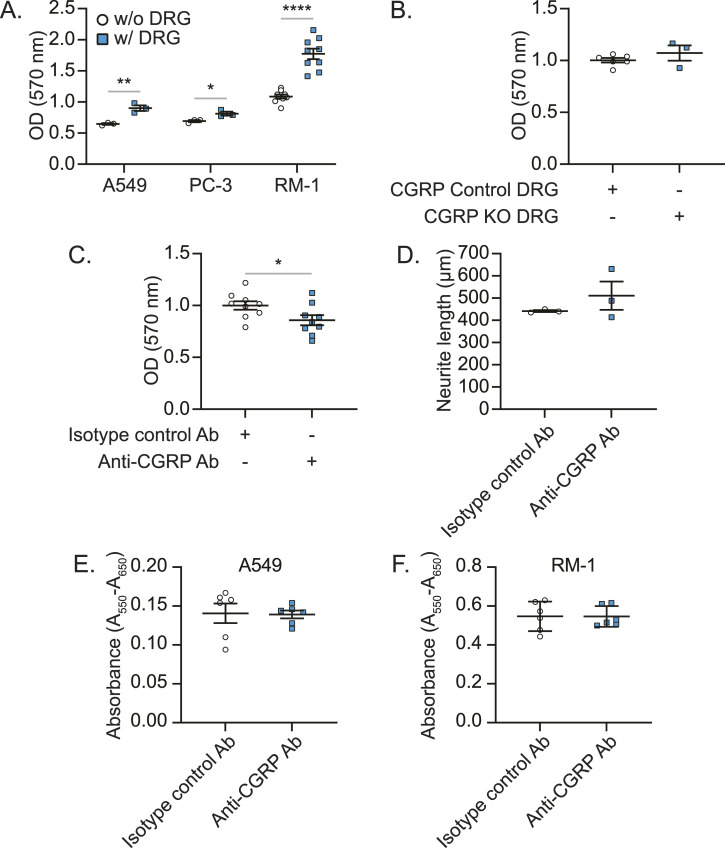
Although the role of peripheral nerves in cancer progression has been appreciated, little is known regarding cancer/sensory nerve crosstalk and its contribution to bone metastasis and associated pain. In this study, we revealed that the cancer/sensory nerve crosstalk plays a crucial role in bone metastatic progression. We found that (i) periosteal sensory nerves expressing calcitonin gene-related peptide (CGRP) are enriched in mice with bone metastasis; (ii) cancer patients with bone metastasis have elevated CGRP serum levels; (iii) bone metastatic patient tumor samples express elevated calcitonin receptor-like receptor (CRLR, a CGRP receptor component); (iv) higher CRLR levels in cancer patients are negatively correlated with recurrence-free survival; (v) CGRP induces cancer cell proliferation through the CRLR/p38/HSP27 pathway; and (vi) blocking sensory neuron-derived CGRP reduces cancer cell proliferation in vitro and bone metastatic progression in vivo. This suggests that CGRP-expressing sensory nerves are involved in bone metastatic progression and that the CGRP/CRLR axis may serve as a potential therapeutic target for bone metastasis.


Conflict of interest statement

Part of the study was funded by Teva Pharmaceuticals (Yusuke Shiozawa). KD Mackenzie and JR Stratton were employed by Teva Pharmaceuticals. No conflict of interest exists for the remaining authors.

Figures

Figure 1.
Figure 1.. In vivo cancer–induced bone pain model.
Luciferase-expressing human prostate cancer cell line DU145 or conditioned medium (sham) was implanted directly into femurs of nude mice. (A) Bioluminescence imaging (BLI) was performed to measure tumor growth (n = 10/group). Data are the mean ± 95% confidence interval (CI). (#P ≤ 0.05 [time-by-group interaction] versus sham group [mixed-effects models]). (B) Representative bioluminescent images of sham- and luciferase-labeled DU145 cell–injected mice (week 8). (C) H&E staining of the femur of animals in (A, B). ×20. Bar = 500 μm. (D) Pain behaviors were measured by (D) guarding behavior measurement (mean ± SEM. (E) *P ≤ 0.05 and **P ≤ 0.01 versus sham group [mixed-effects models]) and (E) the running wheel assay (percent of time running at the optimal velocity of 36 cm/sec or greater) (#P ≤ 0.05 [time-by-group interaction] versus sham group [group-averaged growth curve models]). (F) Representative images of glial fibrillary acidic protein–immunostained spinal cord of animals in (A, B). ×10. Bar = 500 μm. (F, G) Quantification of (F). Data are the mean ± SEM. *P ≤ 0.05 versus sham group (t test). (H) Tumor volume measured by a caliper. Data are the mean ± SEM. ****P ≤ 0.0001 versus sham group (two-way ANOVA). (I) Guarding behavior measurement. Data are the mean ± SEM; P ≤ 0.05 is considered as statistically significant (t test).
Figure 2.
Figure 2.. Bone metastatic cancer cells increase CGRP-positive sensory nerve sprouting both in vitro and in vivo.
(A) Representative images of calcitonin gene–related peptide (CGRP)–positive (red) and NF200-positive (green) sensory nerve sprouting in periosteum area bone marrow of animals in Fig 1A and B. 20x. Bar = 100 μm. White arrows indicate nerve fibers. (A, B) Quantification of nerves in mice shown in (A). Data are the mean ± SEM. *P ≤ 0.05 versus contralateral bone (t test). (C, D, E) Primary dorsal root ganglion cells were treated with either control conditioned media (Control CM), or cancer cells (DU145, PC-3, or A549) or normal epithelial lung cell (BEAS-2B) conditioned media (DU145 CM, PC-3 CM, A549 CM, or BEAS-2B CM) for 48 h. (C) Representative images of CGRP-positive sensory nerve sprouting. 20x. Bar = 100 μm. White arrows indicate nerve fibers. (D) Quantification of the length of CGRP-positive sensory nerves exposed to Control CM, DU145 CM, PC-3 CM, or A549 CM. (E) Quantification of the length of CGRP-positive sensory nerves exposed to Control CM or BEAS-2B CM. Data are the mean ± SEM. *P ≤ 0.05 and **P ≤ 0.01 versus Control CM treatment (t test).
Figure 3.
Figure 3.. Bone metastatic cancer significantly enhances CGRP levels in serum and plasma.
Human prostate cancer cell line PC-3, human lung cancer cell line A549, or conditioned medium (sham) was implanted directly into femurs of nude mice. (A) Pain behaviors were measured by guarding behavior measurement. Data are the mean ± SEM. *P ≤ 0.05 versus sham group (t test). (B) CGRP mRNA levels of ipsilateral dorsal root ganglia (L2-L4), (C, D) CGRP secretion in ipsilateral bone marrow, and (D) CGRP levels in serum among cancer-bearing mice and sham-injected mice were measured at week 5 after cancer inoculation. Data are the mean ± SEM. *P ≤ 0.05 versus sham group (t test). (E) Plasma calcitonin generelated peptide levels of prostate cancer patients without (n = 11) and with (n = 22) bone metastasis. Data are the mean ± SEM. *P ≤ 0.05 versus prostate cancer patients without bone metastasis (t test). (F) CGRP mRNA expression of murine (RM-1) and human (PC3, DU145) prostate cancer cells and dorsal root ganglia using GAPDH as a reference gene and DRG set to 1. Data are the mean ± SEM. ****P ≤ 0.0001 versus DRG (one-way ANOVA, Dunnett’s multiple comparisons).
Figure 4.
Figure 4.. Higher CALCRL gene expression is associated with a higher Gleason score of prostate cancer.
(A) Clinical information and calcitonin gene–related peptide receptor gene expression profiles (CALCRL, RAMP1, RAMP2, and RAMP3) of prostate cancer cohort (390 prostate cancer patients) obtained from The Cancer Genome Atlas database. (B, C, D, E) Correlation analyses between the Gleason score and the gene expression of (B) CALCRL, (C) RAMP1, (D) RAMP2, and (E) RAMP3. P ≤ 0.05 is considered as statistically significant (Spearman’s rank correlation coefficient). (F) Association analyses between the Gleason score, and CALCRL gene expression, RAMP1 gene expression, age at diagnosis, and PSA levels. P ≤ 0.05 is considered as statistically significant (multinomial logistic regression models). (G) Kaplan–Meier curves for the association of CALCRL with recurrence-free survival. P ≤ 0.05 is considered as statistically significant (log-rank test).
Figure 5.
Figure 5.. CALCRL may be responsible for bone metastasis.
(A) CALCRL gene expression in primary prostate cancer (Primary, n = 65) and metastatic prostate cancer (Met, n = 25) obtained from the GEO database (GSE6919). Significance versus primary prostate cancer (t test). (B) CALCRL gene expression in breast cancer with brain metastasis (Brain, n = 15), lung metastasis (Lung, n = 4), and bone metastasis (Bone, n = 10) obtained from the GEO database (GSE14017). Significance versus breast cancer with bone metastasis (one-way ANOVA, Dunnett’s multiple comparisons). (C) CALCRL gene expression in breast cancer with brain metastasis (Brain, n = 7), lung metastasis (Lung, n = 16), liver metastasis (Liver, n = 5), and bone metastasis (Bone, n = 8) obtained from the GEO database (GSE14018). Significance versus breast cancer with bone metastasis (one-way ANOVA, Dunnett’s multiple comparisons). (D) Expression of CALCRL in benign prostatic hyperplasia (n = 24), primary prostate cancer (n = 33), castration-resistant prostate cancer with soft tissue metastases (n = 129), and CRPC with bone metastases (n = 20) (one-way ANOVA, Tukey’s multiple comparisons). Data are the mean ± SEM. *P ≤ 0.05, **P ≤ 0.01, ***P ≤ 0.001, and ****P ≤ 0.0001.
Figure S1.
Figure S1.. RAMP1-3 and CALCA expression in patients with bone metastasis is not significantly different from expression in primary or other metastatic sites.
(A, B, C, D) Gene expression values for (A) CALCA, (B) RAMP1, (C) RAMP2, and (D) RAMP3 in primary prostate cancer (Primary, n = 65) and metastatic prostate cancer (Met, n = 25) obtained from the GEO database (GSE6919). Significance versus primary prostate cancer (t test). (E, F, G, H) Gene expression values for (E) CALCA, (F) RAMP1, (G) RAMP2, and (H) RAMP3 in breast cancer with brain metastasis (Brain, n = 15), lung metastasis (Lung, n = 4), and bone metastasis (Bone, n = 10) obtained from the GEO database (GSE14017). Significance versus breast cancer with bone metastasis (one-way ANOVA, Dunnett’s multiple comparisons). (I, J, K, L) Gene expression values for (I) CALCA, (J) RAMP1, (K) RAMP2, and (L) RAMP3 in breast cancer with brain metastasis (Brain, n = 7), lung metastasis (Lung, n = 16), liver metastasis (Liver, n = 5), and bone metastasis (Bone, n = 8) obtained from the GEO database (GSE14018). Significance versus breast cancer with bone metastasis (one-way ANOVA, Dunnett’s multiple comparisons).
Figure 6.
Figure 6.. Calcitonin receptor–like receptor (CRLR) may be responsible for bone metastasis.
(A) CRLR expression among prostate gland, prostate stroma, and prostate cancer areas in tissue microarray samples from prostate cancer patients. Bar = 100 μm. (A, B) Quantification of (A). Data are the mean ± SEM. **P ≤ 0.01 and ***P ≤ 0.001 versus prostate gland (one-way ANOVA, Tukey’s multiple comparisons). (C) CRLR expression among different Gleason scores in tissue microarray samples from prostate cancer patients. Bar = 100 μm. (C, D) Quantification of (C). Data are the mean ± SEM. *P ≤ 0.05 versus Gleason score (one-way ANOVA, Tukey’s multiple comparisons). (E) CRLR expression in bone marrow autopsy samples from prostate cancer and lung cancer patients who died from bone metastases and other reasons. Bar = 100 μm. (E, F) Quantification of CRLR density between samples from cancer patients who died from bone metastases and other reasons in (E). (E, G) Quantification of CRLR density between bone marrow cells and cancer cells in (E). Data are the mean ± SEM. *P ≤ 0.05 versus patients without bone metastasis (t test).
Figure S2.
Figure S2.. Human cancer cell lines that metastasize to the bone express the receptors for CGRP.
(A, B, C, D) CALCRL, (B) RAMP1, (C) RAMP2, and (D) RAMP3 mRNA expression of human cancer and epithelial cell lines (LNCaP, PC-3, DU145, MCF-7, MDA MB-231, ZR75-1, A549, SK-MES-1, and PWR-1E) using GAPDH as a reference gene. Data are the mean ± SEM. (E) Representative Western blot of CRLR and RAMP1. GAPDH was used as a loading control. ND, not detected.
Figure 7.
Figure 7.. CGRP induces proliferation of human cancer cell lines that metastasize to the bone through CRLR, but SP fails to induce their proliferation.
(A) Box plots of cell viability (MTT) assays ± calcitonin gene–related peptide (CGRP) of human cancer cell lines (LNCaP, PC-3, DU145, MCF-7, ZR75-1, MDA MB-231, SK-MES-1, and A549) for 48 h. P ≤ 0.05 is considered as statistically significant (one-way ANOVA). (B, C, D, E) IncuCyte ZOOM cell proliferation assays ± CGRP of human bone metastatic cancer cell lines (B) PC-3, (C) DU145, (D) MDA MB-231, and (E) A549 for 72 h. Data are the mean ± SEM. Significance versus vehicle (mixed-effects models). (F) Doubling time ± CGRP of human bone metastatic cancer cell lines (PC-3, DU145, MDA MB-231, and A549) for 72 h. Data are the mean ± SEM. Significance versus vehicle (t test). *P ≤ 0.05, **P ≤ 0.01, ***P ≤ 0.001, and ****P ≤ 0.0001. (G) Box plots of cell viability (MTT) assays ± calcitonin gene–related peptide (CGRP) ± CGRP8-37 (calcitonin receptor–like receptor inhibitor) of human cancer cell lines (PC3, DU145, MDA MB-231, and A549) for 48 h. P ≤ 0.05 is considered as statistically significant (one-way ANOVA, Tukey’s multiple comparisons). (H) IncuCyte ZOOM cell proliferation assays ± CGRP ± CGRP8-37 of DU145 for 72 h. Data are the mean ± SEM. Significance versus vehicle (mixed-effects models). (I) Box plots of cell viability (MTT) assays ± substance P (SP) of human cancer cell lines (PC-3, DU145, ZR75-1, MDA MB-231, SK-MES-1, and A549) for 48 h. P ≤ 0.05 is considered as statistically significant (one-way ANOVA). (J) Plasma SP levels of prostate cancer patients without (n = 11) and with (n = 22) bone metastasis. Data are the mean ± SEM (t test). *P ≤ 0.05, **P ≤ 0.01, ***P ≤ 0.001, and ****P ≤ 0.0001.
Figure S3.
Figure S3.. CGRP induces murine prostate cancer cell proliferation and the downstream pathway of CGRP in human cancer cell lines.
(A) MTT assay of RM-1 treated with 0–100 nM of murine CGRP. Data are the mean ± SEM. *P ≤ 0.05 versus vehicle (one-way ANOVA, Tukey’s multiple comparisons). (B) Representative images of antibody-based cell pathway array data presented in Fig 8A. (C) Representative Western blot of p38 and HSP27 phosphorylation ± CGRP. GAPDH was used as a loading control.
Figure 8.
Figure 8.. Calcitonin gene–related peptide (CGRP) induces proliferation of human cancer cell lines that metastasize to the bone by activating P38 and HSP27.
(A) Quantification of antibody-based cell pathway array data. DU145 and MDA-MB-231 cells (responders to CGRP), and LNCaP and MCF-7 cells (non-responders to CGRP) were exposed to CGRP for 60 min. (B) Representative Western blot of p38 and HSP27 phosphorylation ± CGRP ± SB203580 (p38 inhibitor) of human cancer cell lines (PC-3, DU145, MDA MB-231, and A549). GAPDH was used as a loading control. (C) Box plots of cell viability (MTT) assays ± CGRP ± SB203580 of human cancer cell lines (PC-3, DU145, MDA MB-231, and A549) for 48 h. P ≤ 0.05 is considered as statistically significant (one-way ANOVA, Tukey’s multiple comparisons). *P ≤ 0.05, **P ≤ 0.01, ***P ≤ 0.001, ****P ≤ 0.0001.
Figure 9.
Figure 9.. CGRP antagonism reduces p38 and HSP27 in vitro but does not attenuate bone metastatic progression nor p38 expression in vivo.
(A) Representative Western blot of p38 and HSP27 phosphorylation ± CGRP ± CGRP8-37 (CGRP receptor antagonist) of human cancer cell lines (PC-3, DU145, MDA MB-231, and A549). GAPDH was used as a loading control. (B) Experimental schedule. Luciferase-expressing murine prostate cancer cell line RM-1 was implanted directly into femurs of C57BL/6 WT mice (n = 10/group). These mice were treated daily with either vehicle or CGRP8-37. (C) Bone remodeling was measured by X-ray. Data are the mean ± SEM. P ≤ 0.05 is considered as statistically significant (mixed-effects model). (D) Pain behavior was measured by guarding behavior measurement. Data are the mean ± SEM. P ≤ 0.05 is considered as statistically significant (t test). (E) Bone metastatic growth was measured by bioluminescence imaging. Data are the mean ± SEM. P ≤ 0.05 is considered as statistically significant (mixed-effects model). (B, C, D, E, F) Representative images of total and phosphorylated p38–immunostained bone marrow of animals in (B, C, D, E). DAPI is used for nuclear staining. ×10. Bar = 100 μm. (F, G) Quantification of (F). Data are the mean ± SEM. P ≤ 0.05 is considered as statistically significant (t test).
Figure 10.
Figure 10.. Global calcitonin gene–related peptide (CGRP) KO fails to reduce bone metastatic progression.
(A, B, C) Characterizations of CGRP KO mice. (A) Representative images of GFP and CGRP in the dorsal root ganglia of CGRP Control and CGRP KO mice. ×20. Bar = 100 μm. (B) Representative images of GFP, CGRP, and substance P (SP) in the spinal cord of CGRP Control and CGRP KO mice. Bar = 100 μm. (C) Representative images of μCT scans of femurs from WT mice and CGRP Control and CGRP KO mice, including 2D slice image of the femur and 3D image of the distal trabecular area. (D, E, F) Luciferase-expressing murine prostate cancer cell line RM-1 was implanted directly into femurs of CGRP Control and CGRP KO mice (n = 10/group). (D) Bone remodeling was measured by X-ray. (E) Pain behavior was measured by guarding behavior measurement. (F) Bone metastatic growth was measured by bioluminescence imaging. Data are the mean ± SEM. P ≤ 0.05 is considered as statistically significant (mixed-effects model for (D), t test for (E), and mixed-effects model for (F)).
Figure S4.
Figure S4.. CGRP may be involved in bone remodeling.
(A) Representative image of μCT scans of femurs from WT mice, CGRP Control, and CGRP KO mice, including the 2D slice image of the femur and 3D image of the cortical area. (B, C, D) Quantifications of key μCT outcomes at (B) trabecular area, (C) cortical area, and (D) femoral neck area. Data are the mean ± SEM. *P ≤ 0.05 and **P ≤ 0.01 (one-way ANOVA, Tukey’s multiple comparisons).
Figure S5.
Figure S5.. Anti-calcitonin gene–related peptide Ab treatment does not reduce tumor growth in bone in immunodeficient mice.
Luciferase-expressing human lung cancer cell line A549 was implanted directly into femurs of SCID mice (n = 11/group). These mice were treated intraperitoneally with either isotype control antibody (Ab) or anti-CGRP monoclonal Ab (30 mg/kg). Bone metastatic growth was measured by bioluminescence imaging. Data are the mean ± SEM. P ≤ 0.05 is considered as statistically significant (mixed-effects model).
Figure 11.
Figure 11.. Anti-calcitonin gene–related peptide (CGRP) monoclonal antibody treatment inhibits bone metastatic growth.
(A) Experimental schedule. Luciferase-expressing murine prostate cancer cell line RM-1 was implanted directly into femurs of C57BL/6 WT mice (n = 20/group). These mice were treated intraperitoneally with either isotype control antibody (Ab) or anti-CGRP monoclonal Ab (30 mg/kg) at day 6, 13, or 20. (B) Bone remodeling was measured by X-ray. Data are the mean ± SEM. P ≤ 0.05 is considered as statistically significant (t test). (C) Pain behavior was measured by guarding behavior measurement. Data are the mean ± SEM. P ≤ 0.05 is considered as statistically significant (t test). (D) Bone metastatic growth was measured by bioluminescence imaging. Data are the mean ± SEM. *P ≤ 0.05 versus isotype control antibody (Ab) (mixed-effects model). (A, B, C, D, E) Representative images of TRAP-positive osteoclasts in the bone marrow of animals in (A, B, C, D). ×20. Bar = 100 μm. (F) Quantification of (E). Data are the mean ± SEM. P ≤ 0.05 is considered as statistically significant (t test). (A, B, C, D, G) Representative images of total and phosphorylated p38–immunostained bone marrow of animals in (A, B, C, D). DAPI is used for nuclear staining. ×10. Bar = 100 μm. (G, H) Quantification of (G). Data are the mean ± SEM. P ≤ 0.05 is considered as statistically significant (t test).
Figure 12.
Figure 12.. Anti-calcitonin gene–related peptide (CGRP) monoclonal antibody treatment inhibits the proliferation of cancer cells mediated by sensory nerves, but not cancer cells alone.
(A, B, C, D) Cancer cells and murine primary dorsal root ganglion (DRG) sensory neurons were co-cultured for 72 h. The numbers of cancer cells were measured using crystal violet staining at the termination of experiment. (A) Co-culture between cancer cells (A549, PC-3, and RM-1) and murine primary DRG sensory neurons from C57BL/6 WT mice. (B) Co-culture between cancer cells (A549) and murine primary DRG sensory neurons from CGRP Control and CGRP KO mice. (C) Co-culture between cancer cells (A549) and murine primary DRG sensory neurons from C57BL/6 WT mice treated with either isotype control antibody (Ab) or anti-CGRP monoclonal Ab. (D) Quantification of the length of murine primary DRG sensory neurons exposed to isotype control Ab or anti-CGRP monoclonal Ab for 48 h. Data are the mean ± SEM. P ≤ 0.05 is considered as statistically significant (t test). *P ≤ 0.05, **P ≤ 0.01, and ****P ≤ 0.0001. (E, F) MTT proliferation of isotype control and anti-CGRP Ab-treated (E) A549 and (F) RM-1. Data are the mean ± SEM. P ≤ 0.05 is considered as statistically significant (t test).

References

    1. Abou DS, Ulmert D, Doucet M, Hobbs RF, Riddle RC, Thorek DL (2015) Whole-body and microenvironmental localization of Radium-223 in naive and mouse , models of prostate cancer metastasis. J Natl Cancer Inst 108: djv380. 10.1093/jnci/djv380 - DOI - PMC - PubMed
    1. Appelt J, Baranowsky A, Jahn D, Yorgan T, Köhli P, Otto E, Farahani SK, Graef F, Fuchs M, Herrera A, et al. (2020) The neuropeptide calcitonin gene-related peptide alpha is essential for bone healing. EBioMedicine 59: 102970. 10.1016/j.ebiom.2020.102970 - DOI - PMC - PubMed
    1. Armstrong AJ, Garrett-Mayer E, de Wit R, Tannock I, Eisenberger M (2010) Prediction of survival following first-line chemotherapy in men with castration-resistant metastatic prostate cancer. Clin Cancer Res 16: 203–211. 10.1158/1078-0432.CCR-09-2514 - DOI - PubMed
    1. Badrising SK, van der Noort V, Hamberg P, Coenen JL, Aarts MJ, van Oort IM, van den Eertwegh AJ, Los M, van den Berg HP, Gelderblom H, et al. (2016) Enzalutamide as a fourth- or fifth-line treatment option for metastatic castration-resistant prostate cancer. Oncology 91: 267–273. 10.1159/000448219 - DOI - PubMed
    1. Benyamin R, Trescot AM, Datta S, Buenaventura R, Adlaka R, Sehgal N, Glaser SE, Vallejo R (2008) Opioid complications and side effects. Pain Physician 11: S105–S120. - PubMed

Substances

LinkOut - more resources