. 2024 Oct 23;44(43):e1593232024.
doi: 10.1523/JNEUROSCI.1593-23.2024.

Synaptotagmin 4 Supports Spontaneous Axon Sprouting after Spinal Cord Injury

Affiliations

Synaptotagmin 4 Supports Spontaneous Axon Sprouting after Spinal Cord Injury

Kyoka Higuchi et al. J Neurosci. .

Abstract

Injuries to the central nervous system (CNS) can cause severe neurological deficits. Axonal regrowth is a fundamental process for the reconstruction of compensatory neuronal networks after injury; however, it is extremely limited in the adult mammalian CNS. In this study, we conducted a loss-of-function genetic screen in cortical neurons, combined with a Web resource-based phenotypic screen, and identified synaptotagmin 4 (Syt4) as a novel regulator of axon elongation. Silencing Syt4 in primary cultured cortical neurons inhibits neurite elongation, with changes in gene expression involved in signaling pathways related to neuronal development. In a spinal cord injury model, inhibition of Syt4 expression in cortical neurons prevented axonal sprouting of the corticospinal tract, as well as neurological recovery after injury. These results provide a novel therapeutic approach to CNS injury by modulating Syt4 function.

Keywords: axon regeneration; corticospinal tract; spinal cord.


Conflict of interest statement

The authors declare no competing financial interests.

Figures
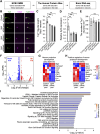
Figure 1.
Figure 1.
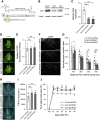
Syt4 promotes neurite elongation in vitro. A, Schematic design for screening to identify the factors involved in neurite elongation from several databases. B, Immunocytochemical images of primary cortical neurons stained with Tuj1 (green) and Ctip2 (magenta) after Control siRNA pool, Syt4 siRNA pool, Syt4 siRNA#1, or Syt4 siRNA#2 transfection. Scale bar, 25 µm. C, Quantitative analysis of the average neurite length in cortical neuron cultures (n = 3 cultures for each group, **p < 0.01). D, Relative expression of Syt4 mRNA in the cortical neurons 3 d after indicated siRNA transfection (n = 3 cultures for each group, **p < 0.01). E, The number of cortical neurons per mm2 after siRNA transfection (n = 3 cultures for each group; NS, not significant). F, Volcano plot of RNA-seq data from primary cortical neurons transfected with Control or Syt4 siRNA (n = 3 cultures for each group). The red and blue dots represent significantly up- and downregulated genes, respectively. G, H, Heatmap showing the expression level of DEGs annotated with “neuron projection development (GO:0031175, G)” and the “positive regulation of neuron projection development (GO: 0010976, H)” in the gene ontology analysis. I, Graph showing top 20 canonical pathways. Color of bars represent z-score of expected activation (positive) or inhibition (negative) state of the pathways calculated using IPA. Gray bars indicate that no activity pattern was identified in IPA, despite significant association of DEGs within the pathway. Data are presented as mean ± standard error of the mean. p values were determined using one-way ANOVA with Tukey's post hoc test.
Figure 2.
Figure 2.
Syt4 is expressed in neurons of the primary motor cortex. A, Relative Syt4 mRNA expression in individual organs of intact mice (n = 3 each). Data are presented as mean ± standard error of the mean. Bars with different letters are significantly different (p < 0.05, one-way ANOVA with Tukey's post hoc test). B, Low magnification view of brain section labeled with DAPI (top image) and immunohistochemistry for Syt4 in the motor cortex indicated with white rectangle in the top image. Scale bar: top, 1 mm; bottom, 100 μm. C, Representative images show dual immunostaining for Syt4 (green) and NeuN, Iba1, Olig2, or Sox9 (magenta) in the motor cortex. Scale bar, 25 μm.
Figure 3.
Figure 3.
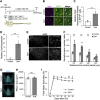
Endogenous Syt4 contributes to spontaneous functional recovery and collateral sprouting after SCI. A, Schematic drawing indicating the timeline and AAV injection procedure for in vivo experiments. B, Western blots showing the expression level of Syt4 and β-actin in the motor cortex after 14 d of AAV infection. C, Graph showing the relative expression level of Syt4 assessed by western blots. Data is normalized to the intensity of β-actin (n = 4 for each, **p < 0.01). D, Representative images show EYFP-labeled CST in the dorsal columns of cervical cord of mice after 14 d of AAV infection. Scale bar, 100 μm. E, Quantitative analysis of the relative EYFP fluorescence intensity assessed from D (n = 3 for each; NS, not significant). F, Representative images show EYFP-labeled CST axons in the cervical cord at Day 57 after SCI. Scale bar, 200 μm. G, Quantification of sprouting fiber index in the indicated distance from the central canal. The number of sprouting fibers was normalized to that of main CST fibers (n = 10 for each, *p < 0.05, **p < 0.01). H, Representative images show immunohistochemistry for PKCγ in the cervical cord of mice at Day 57 after injury. Scale bar, 100 μm. I, Quantitative analysis of PKCγ+ area (n = 6 for each; NS, not significant). J, Graph showing the percentage of faults in ladder walk test after SCI (Control shRNA: n = 14, Syt4 shRNA#1: n = 12, and Syt4 shRNA#2: n = 12, **p < 0.01, Control shRNA vs Syt4 shRNA#1, ##p < 0.01, Control shRNA vs Syt4 shRNA#2). Data are presented as mean ± standard error of the mean. p values were determined by one-way ANOVA with Tukey's post hoc test (C, E, I) or two-way ANOVA with Bonferroni's post hoc test (G, J).
Figure 4.
Figure 4.
Syt4 knockdown does not affect histological feature around the lesion. A, Representative images show EYFP-labeled CST axons around the lesion site at Day 57 after SCI. Scale bar, 500 μm. B, Quantification of EYFP+ axon intensity at indicated distance from lesion site. The percentage of fluorescence intensity was calculated based on 1 mm rostral to the injury (Control shRNA: n = 6, Syt4 shRNA#1: n = 5, and Syt4 hRNA#2: n = 4 for each). C, Representative images show the immunohistochemistry for GFAP (magenta) and Iba1 (cyan) in the lesion site at Day 57 after injury. Scale bar, 500 μm. D, E, Quantification of GFAP+ area (D) and Iba1+ area (E). The area index was calculated as the percentage of stained area per unit area (n = 6 for each). Data are presented as mean ± standard error of the mean. p values were determined by two-way (B) or one-way (D, E) ANOVA; NS, not significant.
Figure 5.
Figure 5.
Syt4 overexpression is sufficient to promote functional recovery and collateral sprouting after SCI. A, Schematic drawing indicating the timeline and AAV injection procedure for in vivo Syt4-overexpressing experiments. B, Representative images of immunohistochemical analysis showing the expression level of Syt4 in the motor cortex after 14 d of AAV infection. Scale bar, 50 μm. C, Graph showing the relative expression level of Syt4 in EYFP+ transduced neurons assessed by immunofluorescence (n = 3 for each; **p < 0.01). D, Graph showing the relative expression level of Syt4 mRNA in the motor cortex after 14 d of AAV infection (n = 3 for each; **p < 0.01). E, Representative images show EYFP-labeled CST axons in the cervical cord at Day 57 after SCI. High magnification images of the boxed areas in the left panels are shown in the right panels. Scale bars: 200 μm for the left panels and 50 μm for the right panels. F, Quantification of sprouting fiber index in the indicated distance from the central canal. The number of sprouting fibers was normalized to that of main CST fibers (Control: n = 7, Syt4: n = 6, **p < 0.01). G, Representative images show immunohistochemistry for PKCγ in the cervical cord of mice at Day 57 after injury. Scale bar, 100 μm. H, Quantitative analysis of PKCγ+ area (n = 4 for each; NS, not significant). I, Graph showing the percentage of faults in ladder walk test after SCI (Control: n = 7; Syt4: n = 6; *p < 0.05, **p < 0.01). Data are presented as mean ± standard error of the mean. p values were determined by Student's t test (C, D, H) or two-way ANOVA with Bonferroni’s post hoc test (F, I).

References

    1. Adolfsen B, Saraswati S, Yoshihara M, Littleton JT (2004) Synaptotagmins are trafficked to distinct subcellular domains including the postsynaptic compartment. J Cell Biol 166:249–260. 10.1083/jcb.200312054 - DOI - PMC - PubMed
    1. Ahuja CS, Wilson JR, Nori S, Kotter MRN, Druschel C, Curt A, Fehlings MG (2017) Traumatic spinal cord injury. Nat Rev Dis Prim 3:17018. 10.1038/nrdp.2017.18 - DOI - PubMed
    1. Aurnhammer C, et al. (2012) Universal real-time PCR for the detection and quantification of adeno-associated virus serotype 2-derived inverted terminal repeat sequences. Hum Gene Ther Methods 23:18–28. 10.1089/hgtb.2011.034 - DOI - PubMed
    1. Balçıkanlı Z, et al. (2022) Lithium promotes long-term neurological recovery after spinal cord injury in mice by enhancing neuronal survival, gray and white matter remodeling, and long-distance axonal regeneration. Front Cell Neurosci 16:1012523. 10.3389/fncel.2022.1012523 - DOI - PMC - PubMed
    1. Bareyre FM, Kerschensteiner M, Raineteau O, Mettenleiter TC, Weinmann O, Schwab ME (2004) The injured spinal cord spontaneously forms a new intraspinal circuit in adult rats. Nat Neurosci 7:269–277. 10.1038/nn1195 - DOI - PubMed

LinkOut - more resources