. 2024 Aug 31;33(4):202-214.
doi: 10.5607/en24004.

Phosphorylated Tau in the Taste Buds of Alzheimer's Disease Mouse Models

Affiliations

Phosphorylated Tau in the Taste Buds of Alzheimer's Disease Mouse Models

Hyun Ji Kim et al. Exp Neurobiol. .

Abstract

Numerous systemic diseases manifest with oral symptoms and signs. The molecular diagnosis of Alzheimer's disease (AD), the most prevalent neurodegenerative disease worldwide, currently relies on invasive or expensive methods, emphasizing the imperative for easily accessible biomarkers. In this study, we explored the expression patterns of key proteins implicated in AD pathophysiology within the taste buds of mice. We detected the expression of amyloid precursor protein (APP) and tau protein in the taste buds of normal C57BL/6 mice. Phosphorylated tau was predominantly found in type II and III taste cells, while APP was located in type I taste cells. Remarkably, we observed significantly stronger immunoreactivity to phosphorylated tau in the taste buds of aged AD mouse models compared to age-matched controls. These findings underscore the oral expression of biomarkers associated with AD, highlighting the diagnostic potential of the oral cavity for neurodegenerative diseases.

Keywords: Alzheimer’s disease; Amyloid protein precursor; Immunohistochemistry; Taste buds; Tauopathies.


Figures

Fig. 1
Fig. 1
Detection of amyloid precursor protein (APP) and phosphorylated tau (p-tau) in taste buds. Representative confocal images of 6E10-immunoreactivity (IR) (A), Tau13-IR (B), AT8-IR (C), and AT180-IR (D) in fungiform (FuP) (A′~D′), folate (FoP) (A″~D″), and circumvallate papillae (CVP) (A‴~D‴) of 8-week-old C57BL/6 mice. Yellow dashed lines demarcate the epithelial boundaries. Immunofluorescent (IF) signals (red) and DAPI (white). Scale bars=50 μm.
Fig. 2
Fig. 2
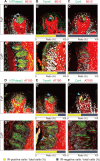
Localization of APP and p-tau in taste cells. (A~C) Double fluorescent images of FuP (A′~C′) and CVP (A″~C″) showing 6E10-IR (red) with cell-type specific markers (green). (D~F) Double fluorescent images of FuP (D′~F′) and CVP (D″~F″) showing AT180-IR (red) with cell-type specific markers (green). Anti- NTPdase2 for type I cells (A, D), anti-Trpm5 for type II cells (B, E), or anti-Car4 for type III cells (C, F). Blue arrowheads indicate colocalization. Scale bars=50 μm. Ratio of IR-positive (yellow bars) and IR-negative cells (gray bars) among type II and type III taste cells were indicated under the tissue images.
Fig. 3
Fig. 3
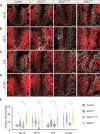
Comparison of APP and p-tau in CVP of Alzheimer’s disease (AD) mouse models. Representative images of Tau13-IR (A), 6E10-IR (B), AT8-IR (C), and AT180-IR (D) in control, ADLPTau, ADLPAPP/PS1, and ADLPAPT mice. Yellow dashed lines demarcate the outer boundaries of taste buds. IF signals (red) and DAPI (white). Scale bars=50 μm. (E) Intensity quantification for Tau13-IR, 6E10-IR, AT8-IR, and AT180-IR in AD mouse models. *p<0.05, ***p<0.005. Detailed statistical information is available in Tables 2, 3.
Fig. 4
Fig. 4
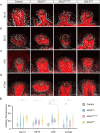
Comparison of APP and p-tau in FuP of AD mouse models. Representative images of Tau13-IR (A), 6E10-IR (B), AT8-IR (C), and AT180-IR (D) in control, ADLPTau, ADLPAPP/PS1, and ADLPAPT mice. Yellow dashed lines demarcate the outer boundaries of taste buds. Immunofluorescent signals (red) and DAPI staining (white). Representative images were selected from 3~4 mice per group. Scale bars=50 μm. (E) Intensity quantification for Tau13-IR, 6E10-IR, AT8-IR, and AT180-IR in AD mouse models. *p<0.05, ***p<0.005. Detailed statistical information is available in Tables 4, 5.
Fig. 5
Fig. 5
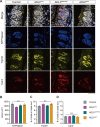
Intact histologic architecture of the CVP in AD mouse models. (A) Representative merged and split confocal images showing the expression of cell-specific markers for type I taste cells: anti-NTPdase2 in blue, type II taste cells: anti-Trpm5 in yellow, and type III taste cells: anti-Car4 in red in AD mouse models. DAPI appears in white. Scale bars=50 μm. (B) The average size of areas occupied by anti-NTPdase2 immunosignals in taste buds. (C) The average number of Trpm5+ cells in a taste bud in AD mouse models. (D) The average number of Car4+ cells in a taste bud in AD mouse models. n.s. Not significant.

Similar articles

References

    1. Gaddey HL. Oral manifestations of systemic disease. Gen Dent. 2017;65:23–29. doi: 10.1016/0030-4220(67)90362-3. - DOI - PubMed
    1. Jang JH, Kwon O, Moon SJ, Jeong YT. Recent advances in understanding peripheral taste decoding I: 2010 to 2020. Endocrinol Metab (Seoul) 2021;36:469–477. doi: 10.3803/EnM.2021.302. - DOI - PMC - PubMed
    1. Yee KK, Li Y, Redding KM, Iwatsuki K, Margolskee RF, Jiang P. Lgr5-EGFP marks taste bud stem/progenitor cells in posterior tongue. Stem Cells. 2013;31:992–1000. doi: 10.1002/stem.1338. - DOI - PMC - PubMed
    1. Stone LM, Finger TE, Tam PP, Tan SS. Taste receptor cells arise from local epithelium, not neurogenic ectoderm. Proc Natl Acad Sci U S A. 1995;92:1916–1920. doi: 10.1073/pnas.92.6.1916. - DOI - PMC - PubMed
    1. Roper S. Regenerative impulses in taste cells. Science. 1983;220:1311–1312. doi: 10.1126/science.6857254. - DOI - PubMed

LinkOut - more resources