. 2024 Sep 12;15(1):7921.
doi: 10.1038/s41467-024-51978-3.

IL-4 drives exhaustion of CD8+ CART cells

Affiliations

IL-4 drives exhaustion of CD8+ CART cells

Carli M Stewart et al. Nat Commun. .

Abstract

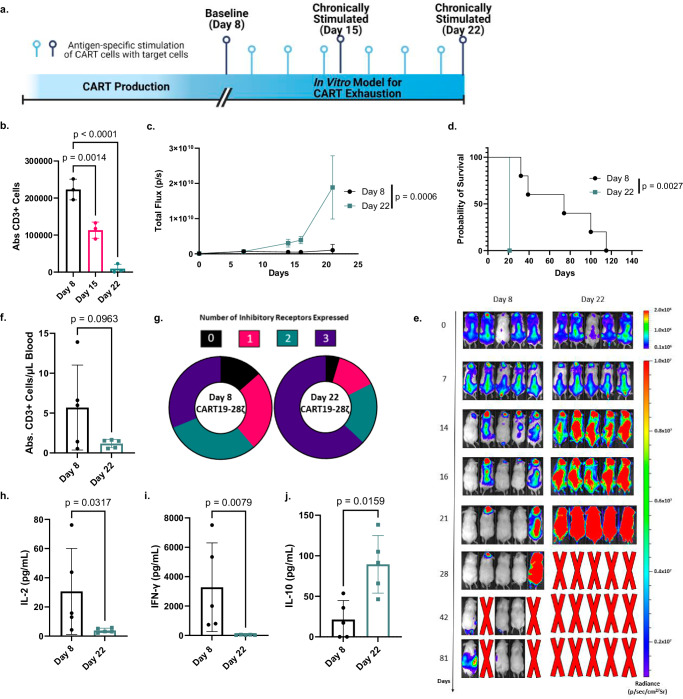
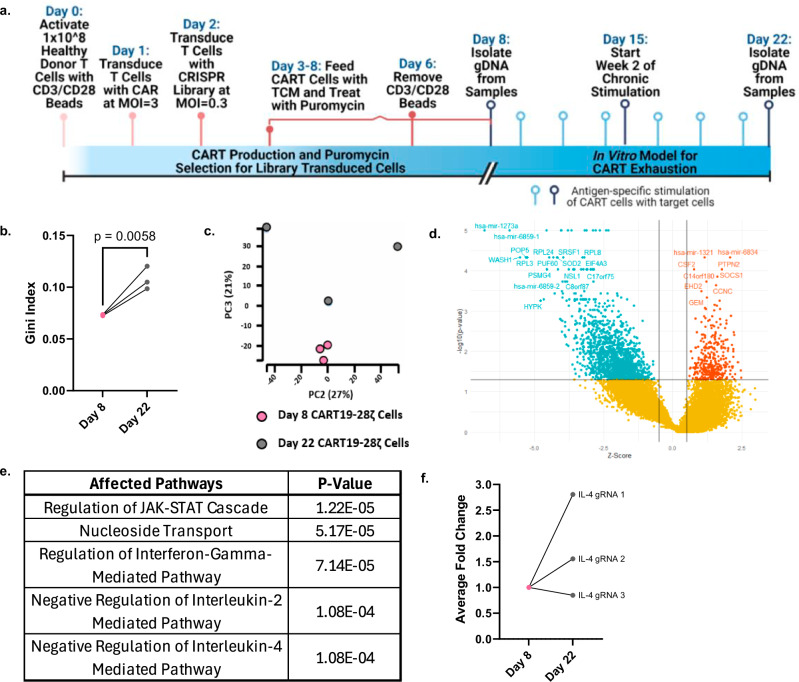
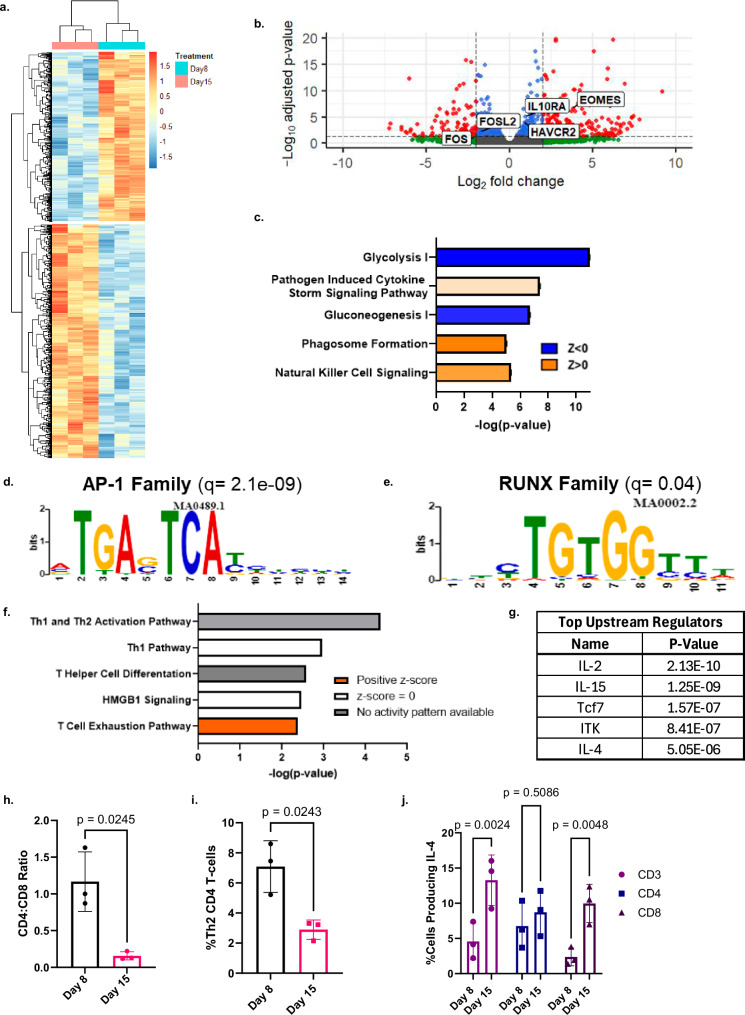
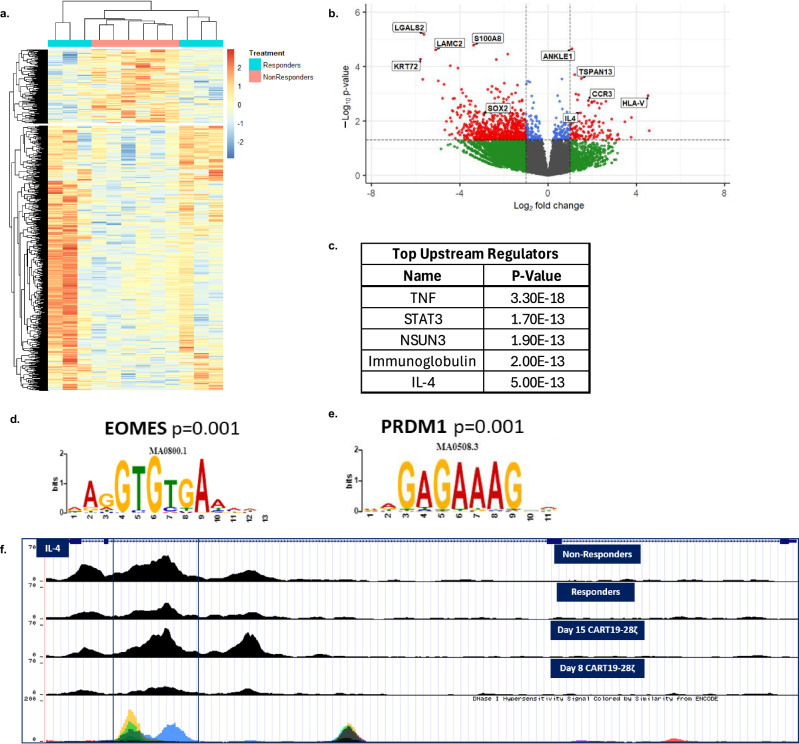
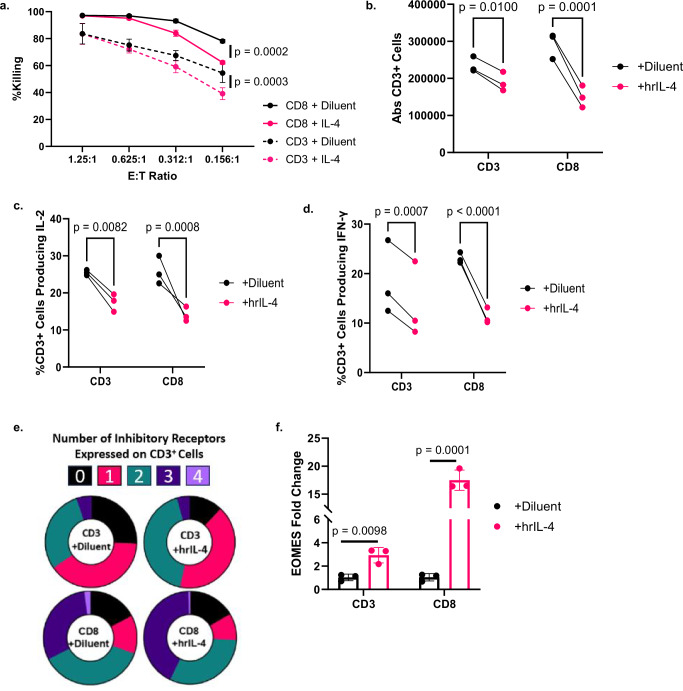
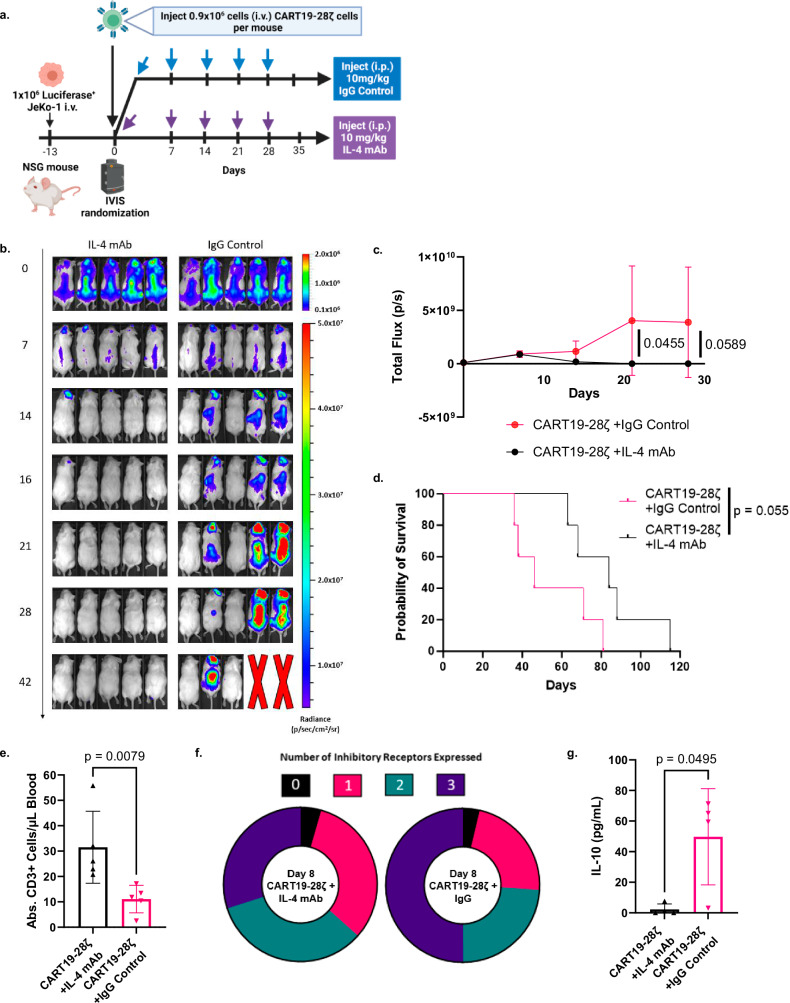
Durable response to chimeric antigen receptor T (CART) cell therapy remains limited in part due to CART cell exhaustion. Here, we investigate the regulation of CART cell exhaustion with three independent approaches including: a genome-wide CRISPR knockout screen using an in vitro model for exhaustion, RNA and ATAC sequencing on baseline and exhausted CART cells, and RNA and ATAC sequencing on pre-infusion CART cell products from responders and non-responders in the ZUMA-1 clinical trial. Each of these approaches identify interleukin (IL)-4 as a regulator of CART cell dysfunction. Further, IL-4-treated CD8+ CART cells develop signs of exhaustion independently of the presence of CD4+ CART cells. Conversely, IL-4 pathway editing or the combination of CART cells with an IL-4 monoclonal antibody improves antitumor efficacy and reduces signs of CART cell exhaustion in mantle cell lymphoma xenograft mouse models. Therefore, we identify both a role for IL-4 in inducing CART exhaustion and translatable approaches to improve CART cell therapy.


Conflict of interest statement

S.S.K. is an inventor on patents in the field of CAR immunotherapy that are licensed to Novartis (through an agreement between Mayo Clinic, University of Pennsylvania, and Novartis). R.L.S., M.J.C., and S.S.K. are inventors on patents in the field of CAR immunotherapy that are licensed to Humanigen (through Mayo Clinic). S.S.K. is an inventor on patents in the field of CAR immunotherapy that are licensed to Mettaforge (through Mayo Clinic). S.S.K. receives research funding from Kite, Gilead, Juno, BMS, Novartis, Humanigen, MorphoSys, Tolero, Sunesis/Viracta, LifEngine Animal Health Laboratories Inc, and Lentigen. S.S.K. has participated in advisory meetings with Kite/Gilead, Calibr, Luminary Therapeutics, Humanigen, Juno/BMS, Capstan Bio, and Novartis. SSK has served on the data safety and monitoring board with Humanigen. S.S.K. has severed a consultant for Torque, Calibr, Novartis, Capstan Bio, and Humanigen. J.B., J.K., M.M., N.S., and S.F. are employed by Gilead. C.M.S., M.M., S.F., and S.S.K. are inventors on intellectual property related to this work. All other authors do not have competing interests to disclose at this time.

Figures

Fig. 1
Fig. 1. An in vitro model for chronic stimulation induces phenotypic and functional signs of exhaustion in CART19-28ζ cells.
a Schematic depicting an in vitro model for exhaustion in CART cells (Fig. 1a was created with BioRender.com released under a Creative Commons Attribution-NonCommercial-NoDerivs 4.0 International license). b Absolute CD3+ cell count, as determined with flow cytometry, after Day 8 (baseline), Day 15 (1 week of chronic stimulation), and Day 22 (2 weeks of chronic stimulation) CART19-28ζ cells were co-cultured with JeKo-1 target cells at a 1:1 ratio for 5 days (One-way ANOVA with average of two technical replicates for three biological replicates, mean ± standard deviation (SD)). c In vivo antitumor activity of Day 22 and Day 8 CART19-28ζ cells in a JeKo-1 xenograft model. NOD-SCID-IL2rγ−/− (NSG) mice were engrafted with the CD19+ luciferase+ JeKo-1 cells (1 x 10⁶ cells I.V.). Mice underwent bioluminescent imaging weekly to confirm engraftment and to monitor tumor burden. Total flux is depicted over time following treatment with CART19-28ζ (0.9 x 10⁶ cells I.V.) on Day 0 (Two-way ANOVA, n = 5 mice per group, mean ± SD). d Overall survival curve based on JeKo-1 xenograft mouse model comparing treatment with Day 8 or Day 22 CART19-28ζ cells (Log-rank (Mantel–Cox) test, n = 5 mice per group) e Bioluminescent imaging of the tumor growth in the JeKo-1 xenograft mouse model. f In vivo CART cell expansion as determined by absolute count of hCD45+CD3+ cells per μL of blood by flow cytometry on Day 15 of the JeKo-1 xenograft model. (two-sided t test, n = 5 mice per group, mean ± SD) g Circle graphs showing the average portion of CART cells expressing multiple inhibitory receptors (0—black, 1—pink, 2—green, 3—dark purple) based on flow cytometry detection of PD-1, CTLA-4, and TIM-3 on human CD3+ cells in the peripheral blood of mice on Day 15 of the JeKo-1 xenograft model. (Average portion from n = 5 mice per group) hj Human cytokine levels for IL-2, IFN-γ, and IL-10 as determined by Multiplex bead assay of mouse serum collected from peripheral blood on Day 15 of the JeKo-1 xenograft model. (two-sided t test, n = 5 mice per group, mean ± SD). Source data for (bd) and (fj) are provided in the Source Data file.
Fig. 2
Fig. 2. A genome-wide CRISPR knockout screen identifies a role for the IL-4 pathway in the development of CART cell dysfunction resulting from chronic stimulation.
a Schematic depicting the in vitro genome-wide CRISPR knockout screen conducted in healthy donor CART19-28ζ cells (Fig. 2a was created with BioRender.com released under a Creative Commons Attribution-NonCommercial-NoDerivs 4.0 International license). b The Gini index on Day 8 and Day 22 of the CRISPR screen (Gini index was calculated with MAGeCK-VISPR and compared with a two-sided t test, three biological replicates). c Principal component analysis plot of gRNA representation in the CRISPR screen at Day 8 and Day 22 (MAGeCK-VISPR maximum likelihood estimation (MLE) analysis with three biological replicates). d Volcano plot showing genes that were positively (red) or negatively (green) selected by Day 22 of the CRISPR screen as compared to Day 8 (Results from MAGeCK-VISPR MLE analysis with three biological replicates). e Top pathways identified by gene ontology enrichment analysis of the positively selected genes (FDR < 0.25 as determined with MAGeCK-VISPR analysis with three biological replicates). f Average fold-change of IL-4 gRNA representation from Day 8 to Day 22 of the CRISPR screen from three biological replicates (fold change calculated with normalized counts of IL-4 targeting gRNAs as determined with MAGeCK-MLE with three biological replicates). Source data for (b) and (f) are provided in the Source Data file.
Fig. 3
Fig. 3. Transcriptomic and chromatin accessibility interrogation reveals a role for IL-4 in the development of CART cell exhaustion that is independent of its classical role in Th2 polarization.
a, b Heat map and volcano plot showing differentially expressed genes when comparing chronically stimulated (Day 15) to baseline (Day 8) CART19-28ζ cells (DESEQ2 with three biological replicates, padj < 0.05). In the volcano plot, significantly differentially expressed genes (padj < 0.05) are colored red. c Top differentially regulated pathways as determined by QIAGEN IPA of differentially expressed genes (DESEQ2 with three biological replicates, padj < 0.05). d, e Motifs enriched in chronically stimulated as compared with baseline CART19-28ζ cells (MEME/TOMTOM analysis with three biological replicates). f, g Top canonical pathways and upstream regulators as identified by QIAGEN IPA of genes that were both differentially expressed (DESEQ2 with three biological replicates, padj < 0.05) and differentially accessible (DiffBind with DESEQ2 using three biological replicates, padj < 0.05). h Ratio of CD4+ to CD8+ CART19-28ζ cells in baseline (Day 8) and chronically stimulated (Day 15) cell populations from the in vitro model for exhaustion (Paired two-sided t test, average of two technical replicates for three biological replicates, mean ± SD). i The percent of CD4+ CART19-28ζ cells that are Th2 polarized as determined by CCR6-CCR4+CXCR3- via flow cytometry in baseline (Day 8) and chronically (Day 15) stimulated CART19-28ζ cell populations (Paired two-sided t test, average of two technical replicates for three biological replicates, mean ± SD). j The percent of either CD3+, CD4+, or CD8+ CART19-28ζ cells producing IL-4 as determined by intracellular staining for IL-4 by flow cytometry following four hours of antigen-specific CAR stimulation through co-culturing Day 8 or Day 15 CART19-28ζ cells with JeKo-1 cells at a 1:5 effector-to-target (E:T) cell ratio (Two-way ANOVA, average of two technical replicates for three biological replicates, mean ± SD). Source data for (hj) are provided in the Source Data file.
Fig. 4
Fig. 4. Transcriptomic and chromatin accessibility interrogation of pre-infusion axi-cel products from responders and non-responders in the ZUMA-1 clinical trial identifies IL-4 as a regulator of response.
a, b Heat map and volcano plot showing differentially expressed genes when comparing pre-infusion axi-cel products from non-responders to pre-infusion axi-cel products from responders (DESEQ2, six biological replicates per condition, p < 0.05). In the volcano plot, significantly differentially expressed genes (p < 0.05) are colored red. c Top upstream regulators as determined by QIAGEN IPA of differentially expressed genes between non-responder and responder samples (DESEQ2, six biological replicates per condition, p < 0.05). d, e Enriched motifs in pre-infusion products from non-responders as compared to pre-infusion products from responders (MEME/TOMTOM analysis with six biological replicates per condition). f ATAC signal track of IL-4 gene locus from averaged signal for each experimental condition (axi-cel products from non-responders (n = 6), axi-cel products from responders (n = 6), Day 15 CART19-28ζ cells (n = 3), and Day 8 CART19-28ζ cells (n = 3)) as visualized with the UCSC genome browser.
Fig. 5
Fig. 5. Treatment of CART19-28ζ cells with hrIL-4 leads to phenotypical and functional signs of exhaustion in a CD4-independent manner.
a Percent killing as measured with bioluminescent imaging after Day 8 CD3+ or CD8+ CART19-28ζ cells were co-cultured with luciferase+ JeKo-1 cells at various E:T cell ratios for 48 hours in the presence of either 20ng/mL human recombinant IL-4 (hrIL-4) or diluent (Two-way ANOVA, average of two technical replicates for three biological replicates, mean ± SD). b, f CD3+ and CD8+ CART19-28ζ cells were kept in media supplemented with 100 IU/mL hrIL-2 and chronically stimulated from Day 8 to Day 15 of the in vitro model for exhaustion in the presence of either 20ng/mL hrIL-4 or diluent control. b Absolute CD3+ cell count as measured with flow cytometry after Day 15 CART19-28ζ cells were co-cultured with JeKo-1 cells at a 1:1 E:T cell ratio for five days. (Two-way ANOVA, average of two technical replicates for three biological replicates). c, d The percent of CD3+ cells producing IL-2 and IFN-γ as determined with intracellular staining and flow cytometry after Day 15 CART19-28ζ cells were co-cultured with JeKo-1 cells at a 1:5 E:T cell ratio for four hours (Two-way ANOVA, average of two technical replicates for three biological replicates). e The percent of CART19-28ζ cells co-expressing multiple inhibitory receptors (0—black, 1—pink, 2—green, 3—dark purple, 4—light purple) on Day 15 as determined by flow cytometric detection of PD-1, CTLA-4, TIM-3, and LAG-3 on CD3+ cells (Circle plots from one representative biological replicate). f The change in the transcription of EOMES as determined with RT-qPCR of Day 15 CD3+ or Day 15 CD8+ CART19-28ζ cells (Paired two-sided t-tests average of two technical replicates for three biological replicates, mean ± SD). Source data are provided as a Source Data file.
Fig. 6
Fig. 6. Combination of CART19-28ζ cells with an IL-4 monoclonal antibody improves overall treatment efficacy and CART cell function in an in vivo mouse model for mantle cell lymphoma.
a Schema for mantle cell lymphoma xenograft mouse model in NSG mice used to test the treatment efficacy of CART19-28ζ cells combined with 10mg/kg IL-4 monoclonal antibody (mAb) as compared with CART19-28ζ combined with 10mg/kg IgG control antibody (Fig. 6a was created with BioRender.com released under a Creative Commons Attribution-NonCommercial-NoDerivs 4.0 International license). b, c Tumor progression as monitored by bioluminescence imaging over time following injection of CART cells on Day 0 (Two-way ANOVA, n = 5 mice per group, mean ± SD). d Overall survival curve comparing CART19-28ζ cell treatment combined with either an IL-4 mAb or IgG control antibody (Log-rank (Mantel–Cox) test, n = 5 mice per group). e Absolute hCD45+CD3+ cells per μL of blood on Day 15 of the in vivo study as determined by flow cytometric measurement of cells that are human CD45+ and human CD3+ after collecting peripheral blood via tail vein bleeding (two-sided t test, n = 5 mice per group, mean ± SD). f Circle graph showing the average portion of CART cells positive for multiple inhibitory receptors (0—black, 1—pink, 2—green, 3—dark purple) as determined with flow cytometric detection of human CD3+ cells positive for PD-1, TIM-3, and/or CTLA-4 in the peripheral blood of mice on Day 15 of the in vivo study (Average value from n = 5 mice per group). g The concentration of IL-10 in the serum of mice in the in vivo model two weeks after the injection of CART cells. Serum was collected through tail vein bleeding of the mice, and cytokine concentration was determined with the use of the Milliplex MAP Human High Sensitivity T Cell Panel Premixed 13-plex (two-sided t test, n = 5 mice per group, mean ± SD). Source data for (cg) are provided in the Source Data file.

References

    1. Sakemura, R., Cox, M. J., Hefazi, M., Siegler, E. L. & Kenderian, S. S. Resistance to CART cell therapy: lessons learned from the treatment of hematological malignancies. Leuk Lymphoma62, 2052–2063 (2021). 10.1080/10428194.2021.1894648 - DOI - PubMed
    1. Neelapu, S. S. et al. Five-year follow-up of ZUMA-1 supports the curative potential of axicabtagene ciloleucel in refractory large B-cell lymphoma. Blood141, 2307–2315 (2023). - PMC - PubMed
    1. Locke, F. L. et al. Long-term safety and activity of axicabtagene ciloleucel in refractory large B-cell lymphoma (ZUMA-1): a single-arm, multicentre, phase 1-2 trial. Lancet Oncol.20, 31–42 (2019). 10.1016/S1470-2045(18)30864-7 - DOI - PMC - PubMed
    1. Schuster, S. J. et al. Tisagenlecleucel in adult relapsed or refractory diffuse large B-cell lymphoma. 380, 45–56 (2018). - PubMed
    1. Wittibschlager, V. et al. CAR T-cell persistence correlates with improved outcome in patients with B-cell lymphoma. Int. J. Mol. Sci.24, 5688 (2023). - PMC - PubMed

Publication types

MeSH terms

Associated data