. 2024 Sep 12;15(1):7996.
doi: 10.1038/s41467-024-52221-9.

Engineered model of heart tissue repair for exploring fibrotic processes and therapeutic interventions

Affiliations

Engineered model of heart tissue repair for exploring fibrotic processes and therapeutic interventions

Pengcheng Yang et al. Nat Commun. .

Abstract

Advancements in human-engineered heart tissue have enhanced the understanding of cardiac cellular alteration. Nevertheless, a human model simulating pathological remodeling following myocardial infarction for therapeutic development remains essential. Here we develop an engineered model of myocardial repair that replicates the phased remodeling process, including hypoxic stress, fibrosis, and electrophysiological dysfunction. Transcriptomic analysis identifies nine critical signaling pathways related to cellular fate transitions, leading to the evaluation of seventeen modulators for their therapeutic potential in a mini-repair model. A scoring system quantitatively evaluates the restoration of abnormal electrophysiology, demonstrating that the phased combination of TGFβ inhibitor SB431542, Rho kinase inhibitor Y27632, and WNT activator CHIR99021 yields enhanced functional restoration compared to single factor treatments in both engineered and mouse myocardial infarction model. This engineered heart tissue repair model effectively captures the phased remodeling following myocardial infarction, providing a crucial platform for discovering therapeutic targets for ischemic heart disease.


Conflict of interest statement

For the development of the hEHT injury model and its application in drug screening, we have been granted a Chinese patent, with inventors Donghui Zhang, Pengcheng Yang, and Jixing Gong, and patent number ZL 2020 1 0620164. X. Besides that, the authors declare no competing interests.

Figures

Fig. 1
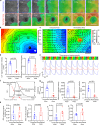
Fig. 1. Establishment of hEHT injury repair model.
a Schematic overview of the remodeling response of cryoinjured hEHT. b Representative phase-contrast images showing the remodeling in the cryoinjured area. Dotted lines outlined the initial cryoinjured area. Scale bar, 250 μm. c Quantification of the cryoinjured area over time. (n = 18 areas from 3 independent experiments). d Immunostaining for CM (SAA+), myoCF (αSMA+), and apoptotic cells (TUNEL+) at days 2 and 4 demonstrated the dynamics of CF in the remodeling of cryoinjured hEHT. Scale bar, 200 μm. Inside the white dashed circle was the remodeled area (RA), and outside was the uninjured area (UA). e TUNEL+ cells variation in RA and UA on days 2 and 4 after cryoinjured. n = 20 areas from 3 independent experiments. f Differences in the length of the stress fiber located in αSMA+ cells in RA and UA of cryoinjured hEHT at days 2 and 4. n = 60 stress fibers in 6 areas from 3 independent experiments. g Representative immunofluorescence staining images of the cardiac cell (VIM, SM22α, cTNT) and ECM markers (Collagen I and Fibronectin) characterizing both RA and UA at day 6 after the hEHT cryoinjured. Scale bar, 200 μm. h The difference in the fluorescent intensity of cardiac cell markers (VIM, SM22α, cTNT) and ECM markers (Collagen I and Fibronectin) between UA and RA. Each marker was normalized to the fluorescence intensity of DAPI. (VIM, n = 15 areas; SM22α, n = 19 areas; cTNT, n = 33 areas; Collagen I, n = 24 areas; Fibronectin, n = 15 areas). Data are presented as mean ± SEM in (e), (f), and (h). p values were calculated by Sidak’s multiple comparisons test in (e) and (f), and two-sided unpaired t-test in (h).
Fig. 2
Fig. 2. Regional calcium activity abnormalities in remodeled hEHT.
a Representative time-lapse images showed calcium wave propagation in both uninjured (UA) and remodeled areas (RA). b Representative spatial map of the four remodeled areas in hEHT presenting the difference in calcium activity between the UA and RA. Initial cryoinjured areas are marked in circles. The white triangle represented the electrical stimulation origin (1 Hz). The representative RA was marked as a red box, and the UA was marked as a blue box. Scale bar, 1 mm. c Enlarged spatial maps of UA and RA (20 × 20 pixels) were represented as the box in (b). Calcium signal conduction velocity and direction were labeled by the colorized arrows. Scale bar, 200 μm. d Differences in calcium signal conduction velocity and direction homogeneity between UA and RA. n = 8 areas from 3 independent experiments. e Existence of abnormal continuous calcium signal in the remodeled area. The representative stripe image showed the time course of the calcium signal in the black line shown in (b) that passed the uninjured and remodeled areas, with waveform representing the average calcium signal during 10 seconds of representative dots (3 × 3 pixels, labeled by a, b, c located in UA and RA in (b)). f The schematic diagram outlined parameters for evaluating the waveform characteristics of the calcium signal. g Differences in amplitude, maximum upstroke velocity, and maximum recovery velocity of calcium signal between UA and RA. n = 8 areas from 3 independent experiments. h Differences in 50% CSD, 80% CSD, T maximum upstroke velocity, and T maximum recovery velocity of calcium signal between UA and RA. n = 8 areas from 3 independent experiments. Data are presented as mean ± SEM in (d), (g), and (h). p values were calculated by two-sided unpaired t-test in (d), (g), and (h).
Fig. 3
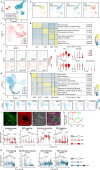
Fig. 3. Transcriptomic analysis underlying the subcellular composition and signaling dynamics during the remodeling of injured hEHT.
a UMAP plot showing the four main cell clusters from scRNA-seq of control and cryoinjured hEHT at early and late periods. b Feature UMAP plots demonstrating the four cell clusters in each group. c UMAP plot showing the four CM subpopulations in control and cryoinjured hEHT at early and late periods. d Heatmap showing Z score scaled average DEG expression in each CM subpopulations with top GO terms presented. e Feature UMAP plots of DEGs in four CM subpopulations. f Violin plots for sarcomere-related gene expression in four CM subpopulations. g UMAP plot showing five CF subpopulations in control and remodeled hEHT at early and late periods. h Heatmap showing Z score scaled average DEG expression across five CF subpopulations with top GO terms presented. i Feature UMAP plots for DEGs in five CF subpopulations. j Immunostaining of CD44, CXADR, and VIM in remodeled hEHT to reveal the different distribution of CF4 (VIM+/CD44+/CXADR) and CF5 (VIM+/CD44+/CXADR+) in UA and RA. Scale bar, 200 μm. k Representative line graph reflecting changes in fluorescence intensity (normalized to the gray value of DAPI) of CD44, CXADR, and VIM from UA to RA in (j). l, m Violin plots showing representative DEG expression levels in four CM and five CF subpopulations from control and cryoinjured hEHT at early and late periods. p values were calculated by modified Fisher’s Exact test in (d) and (h), and two-sided unpaired t-test in (l) and (m).
Fig. 4
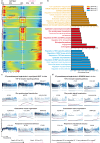
Fig. 4. Pseudotime analysis revealed that CF in the hEHT injury repair model exhibited similar cell fate transitions in vivo.
a Heatmap displaying significantly altered genes at the transition node from epicardial-like fibroblasts (CF5) to quiescent fibroblasts (CF3) or proliferative fibroblasts (CF1). The black line indicated the gene expression change from CF5 to CF3, while the pink dashed line depicted the change from CF5 to CF1. The color gradients from blue to red indicate the relative gene expression level from low to high. b Top 10 GO terms of significantly altered gene set (different colored frames in (a)) in pseudotime trajectory. c Spline plots illustrating representative genes changed in the two CF transition trajectories within the hEHT injury repair model. d Comparison spline plots for the same genes in (c), showing changes in two CF transition trajectories in clinical dilated cardiomyopathy (DCM) and ischemic cardiomyopathy (ICM) hearts (GEO: GSE145154), where the black line indicated the gene expression change from quiescent CF to contractile CF, and the pink dashed line indicated the change from quiescent CF to myoCF.
Fig. 5
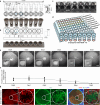
Fig. 5. Establishment of the mini hEHT-injury repair model.
a Three views drawing and image of the device for batch fabrication of mini-hEHT: x, z-view (top left); x, y-view (lower left); y, z-view (right). b Three views drawing and image of the pedestal for batch cryoinjury in mini-hEHT repair model: x, y-view (top left); x, z-view (lower left); y, z-view (right). c Photos of cryoinjured mini-hEHT. The white arrow indicated the cryoinjured area on the cryoinjured mini-hEHT. d Schematic of the mini hEHT-injury repair model for screening potential therapeutic targets of IHD. e Representative phase-contrast images and enlarged views of cryoinjured area remodeling in mini-hEHT- injury repair model. Scale bar 500 μm, 200 μm for enlarged views. f Quantification of individual cryoinjured area changes during remodeling in cryoinjured mini-hEHT. n = 15 remodeled mini-hEHTs from 3 independent experiments. g Representative confocal images and enlarged views of cardiac cell markers (cTNT for CM, TE7 for human CF) in single remodeled mini-hEHT. Scale bar 500 μm, 200 μm for enlarged views.
Fig. 6
Fig. 6. The evaluation of treatment effects on the mini hEHT-injury repair model.
a Representative confocal images of CM and CF in the remodeled area of cryoinjured mini-hEHT under various treatments. Scale bar, 200 um. b Correlation analysis between the volume share of CM and the CM’s eccentricity degree in the remodeled area. n = 200 from different groups. c Correlations analysis between the volume share of CM and CF’s stress fiber length in the remodeled area. n = 100 from different groups. d Integrative ranking plots based on the mean values of CM’s volume share, CM’s eccentricity degree, and CF’s stress fiber length under various treatments.
Fig. 7
Fig. 7. The integrative evaluation of treatment effects on the recovery of abnormal calcium activities in the hEHT repair model.
a Flowchart comparing single-factor and combination treatment on remodeling in cryoinjured hEHT. b Representative spatial maps showing RA under varying electrical stimulation and ISO loads (1 Hz stimulation with or without ISO and 1.5 Hz stimulation with ISO). Calcium signal conduction velocity and direction were labeled by the colorized arrows, with each area containing 20×20 pixels. c Quantitative analysis of abnormal calcium activity areas from spatial maps across different loading conditions. n = 10 remodeled areas from 3 independent experiments. Scores for different treatments under 3 load conditions are represented with varying-colored numbers; higher scores reflect better recovery. d Differences in the calcium signal conduction velocity and direction homogeneity of calcium signal propagation in the remodeled areas under different loading conditions. n = 10 remodeled areas from 3 independent experiments. e Representative calcium signal waveforms in the remodeled area under varying loading conditions. f Quantification of the amplitude and CSD80 of calcium signal in the remodeled areas under different loading conditions. n = 10 remodeled areas from 3 independent experiments. g Integrative ranking charts for 8 parameters of calcium activities in remodeled areas under different treatments versus the uninjured area in the control group. Increased green intensity means the closer the corresponding parameter to the criterion, with scores ranging from 1 (yellow) to 5 (green) as the number shown in (c)–(f). Data are presented as mean ± SEM.
Fig. 8
Fig. 8. The combination treatment reduced the fibrotic area and enhanced cardiac function in the adult mouse model of MI.
a Schematic of various treatments (DMSO, Y27632, CHIR99021, SB431542, and their combination) to adult mice post-MI. b Representative images of M-code echocardiography from Sham, Vehicle, Y27632, CHIR99021, SB431542, and their combination-treated mice after 21 days of treatment. c Ejection fraction measured by echocardiography in different groups of mice before treatment and 21 days after treatment. n = 7 mice for Sham, Vehicle and Combination; n = 6 mice for Y27632 and CHIR99021; n = 5 mice for SB431542. d Fraction shortening measured by echocardiography in different groups of mice before treatment and 21 days after treatment. n = 7 mice for Sham, Vehicle and Combination; n = 6 mice for Y27632 and CHIR99021; n = 5 mice for SB431542. e Representative Masson staining images of heart sections from various groups at 21 days after treatment. Scale bar,2.5 mm. f Quantitative analysis of the fibrotic area measured from Masson staining image from different group mice at 21 days after treatment. n = 7 mice for Vehicle and Combination; n = 6 for Y27632 and CHIR99021; n = 5 mice for SB431542. Data are presented as mean ± SEM in (c), (d), and (f). p values were calculated by Dunnett’s multiple comparisons test vs. vehicle at the same time point in (c), (d), and (f).

References

    1. Safiri, S. et al. Burden of ischemic heart disease and its attributable risk factors in 204 countries and territories, 1990–2019. Eur. J. Prev. Cardiol.29, 420–431 (2022). 10.1093/eurjpc/zwab213 - DOI - PubMed
    1. Nowbar, A. N., Gitto, M., Howard, J. P., Francis, D. P. & Al-Lamee, R. Mortality from ischemic heart disease. Circ. Cardiovasc Qual. Outcomes12, e005375 (2019). 10.1161/CIRCOUTCOMES.118.005375 - DOI - PMC - PubMed
    1. Pesce, M. et al. Cardiac fibroblasts and mechanosensation in heart development, health and disease. Nat. Rev. Cardiol.20, 309–324 (2023). 10.1038/s41569-022-00799-2 - DOI - PubMed
    1. Piamsiri, C., Maneechote, C., Siri-Angkul, N., Chattipakorn, S. C. & Chattipakorn, N. Targeting necroptosis as therapeutic potential in chronic myocardial infarction. J. Biomed. Sci.28, 25 (2021). 10.1186/s12929-021-00722-w - DOI - PMC - PubMed
    1. de Bakker, J. M. et al. Reentry as a cause of ventricular tachycardia in patients with chronic ischemic heart disease: electrophysiologic and anatomic correlation. Circulation77, 589–606 (1988). 10.1161/01.CIR.77.3.589 - DOI - PubMed

Publication types

MeSH terms

Associated data