. 2024 Sep 12;15(1):7638.
doi: 10.1038/s41467-024-52068-0.

Protein kinase N promotes cardiac fibrosis in heart failure by fibroblast-to-myofibroblast conversion

Affiliations

Protein kinase N promotes cardiac fibrosis in heart failure by fibroblast-to-myofibroblast conversion

Satoya Yoshida et al. Nat Commun. .

Abstract

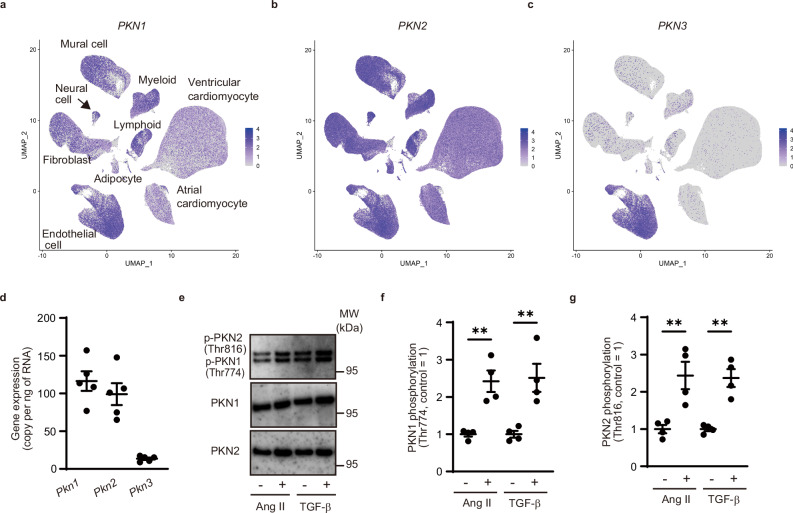
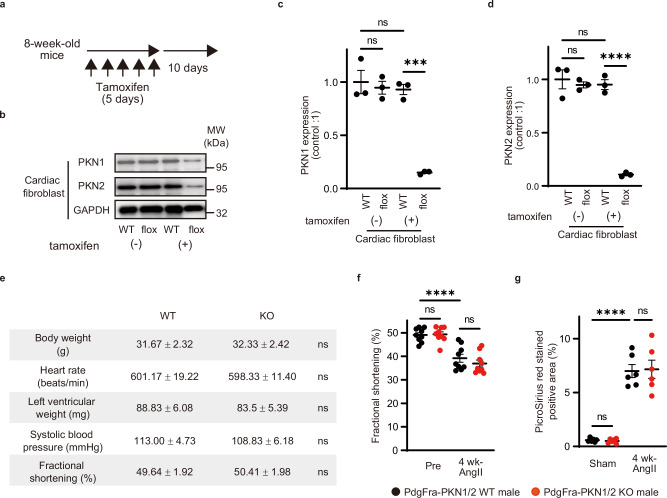
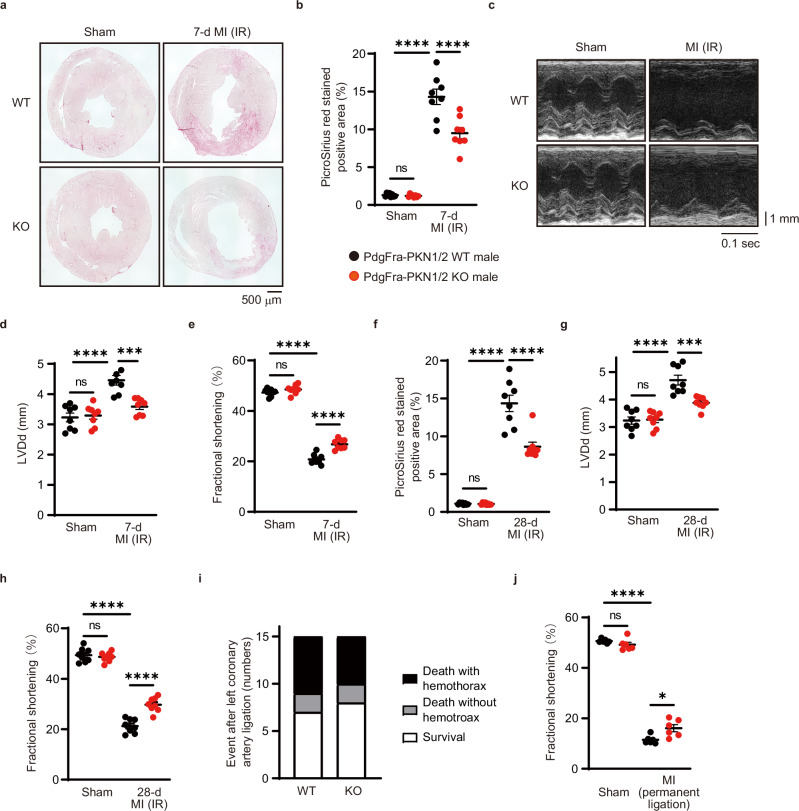
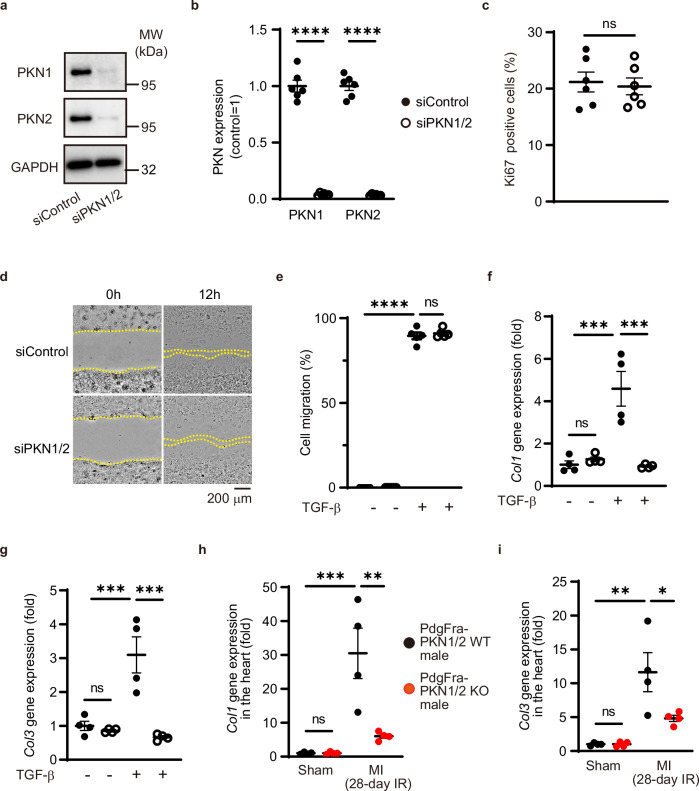
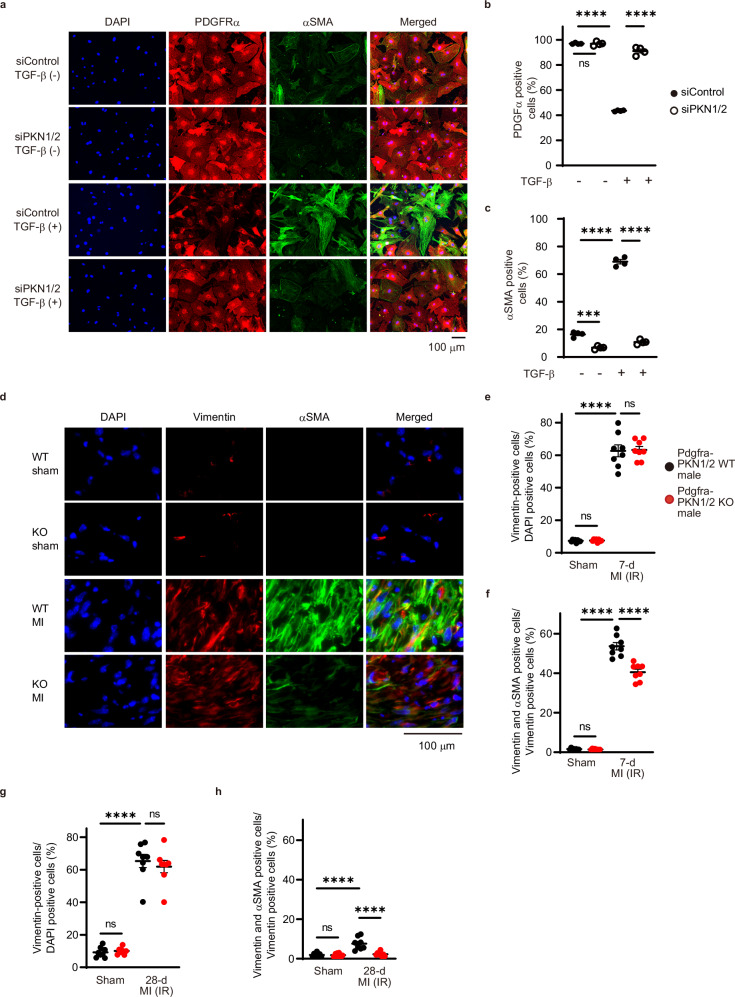
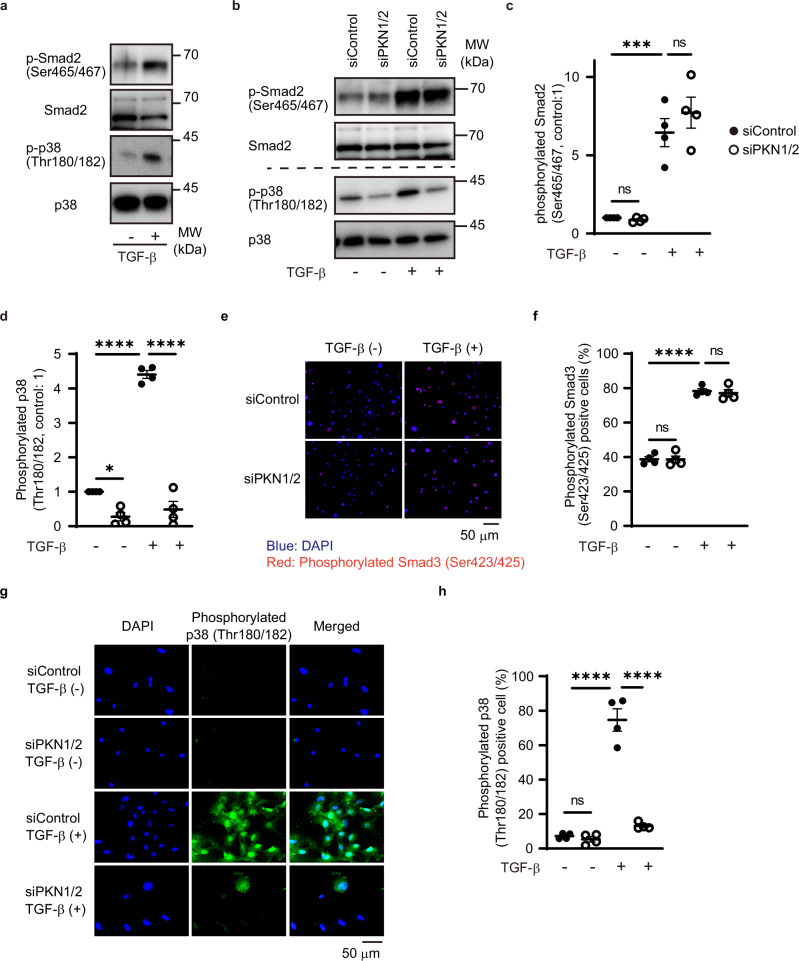
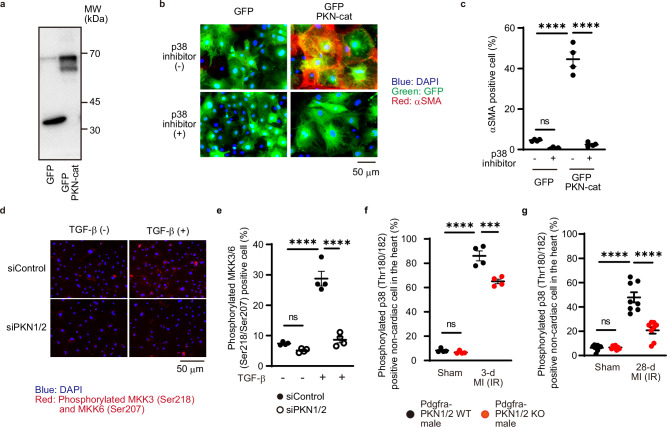
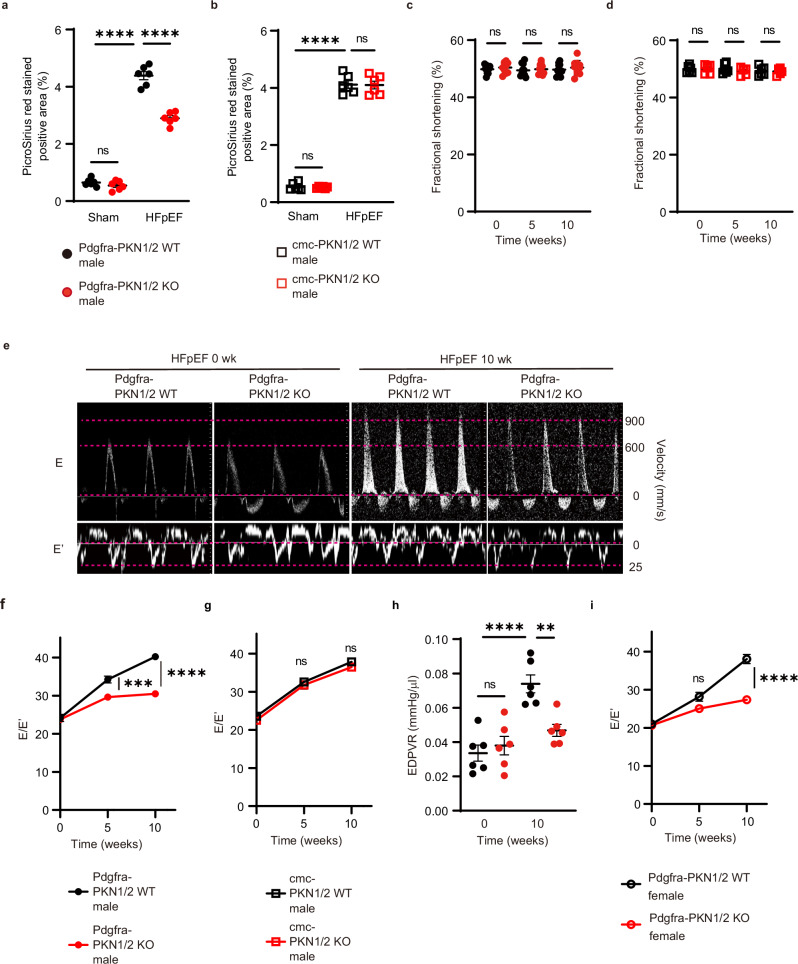
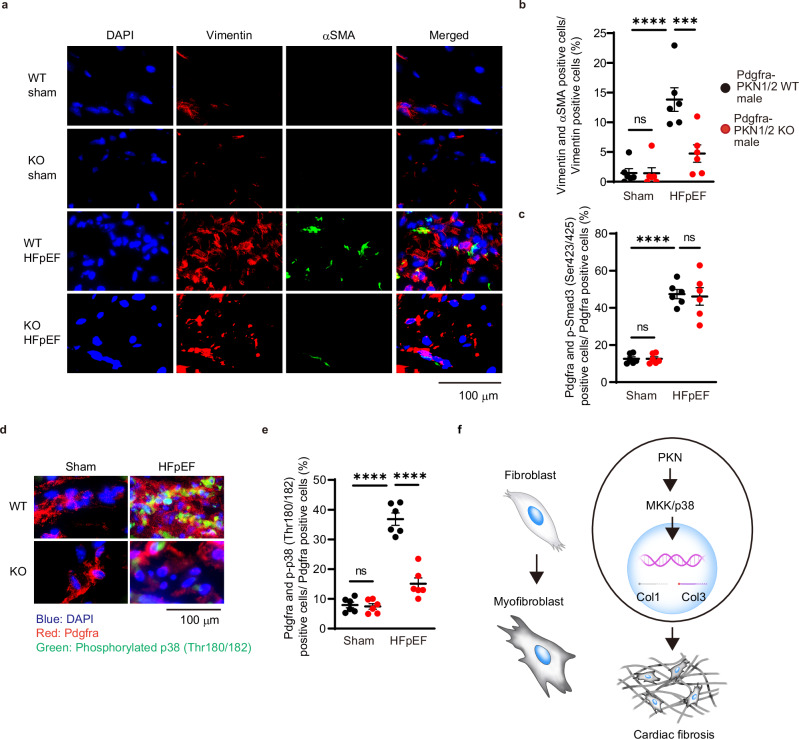
Chronic fibrotic tissue disrupts various organ functions. Despite significant advances in therapies, mortality and morbidity due to heart failure remain high, resulting in poor quality of life. Beyond the cardiomyocyte-centric view of heart failure, it is now accepted that alterations in the interstitial extracellular matrix (ECM) also play a major role in the development of heart failure. Here, we show that protein kinase N (PKN) is expressed in cardiac fibroblasts. Furthermore, PKN mediates the conversion of fibroblasts into myofibroblasts, which plays a central role in secreting large amounts of ECM proteins via p38 phosphorylation signaling. Fibroblast-specific deletion of PKN led to a reduction of myocardial fibrotic changes and cardiac dysfunction in mice models of ischemia-reperfusion or heart failure with preserved ejection fraction. Our results indicate that PKN is a therapeutic target for cardiac fibrosis in heart failure.


Conflict of interest statement

The authors declare no competing interests.

Figures

Fig. 1
Fig. 1. Protein kinase N (PKN) 1 and PKN2 are expressed in cardiac fibroblasts.
ac Feature plot of cardiac cells labeled according to PKN1, PKN2, and PKN3 transcription expression, visualized using Uniform Manifold Approximation and Projection (UMAP). d Quantitative real-time polymerase chain reaction analysis of Pkn1, Pkn2, and Pkn3 expression in isolated cardiac fibroblasts (n = 5, biological replicates per group). e Western blot analysis for PKN1 (Thr774) and PKN2 (Thr816) phosphorylation in cardiac fibroblasts after treatment with angiotensin II (AngII, 100 nM) or TGF-β (10 ng/mL). f Statistical evaluation of (e) (n = 4, biological replicates per group; AngII, **p = 0.0029, TGF-β, **p = 0.0079). g Statistical evaluation of (e) (n = 4, biological replicates per group; AngII, **p = 0.0096, TGF-β, **p = 0.0014). Data are presented as the mean ± SEM and analyzed using a two-sided unpaired Student t test (f, g). The data represent three independent experiments with similar results. Source data are provided as a Source Data file.
Fig. 2
Fig. 2. Fibroblasts in PKN1/2-deficient mice.
a Animals were treated with intraperitoneal injections of tamoxifen for 5 consecutive days, and the efficiency of recombination was determined 10 days later. b Western blot analysis for PKN1 and PKN2 in cardiac fibroblasts isolated from the heart of Pdgfra-PKN1/2 WT or KO mice after tamoxifen induction. GAPDH is used for control. c, d Statistical evaluation of (b) (n = 3, biological replicates per group). ns, not significant; ***p = 0.0002; ****p < 0.0001. e Physiological function in Pdgfra-PKN1/2 WT or KO male mice (n = 6, biological replicates per group). ns, not significant. f Left ventricular fractional shortening assessed using echocardiography (n = 8, biological replicates per group) and (g) fibrotic changes in left ventricles assessed using Picrosirius red staining (n = 6, biological replicates per group) after 4 weeks of sustained AngII infusion (100 ng·g−1·d−1) in Pdgfra-PKN1/2 WT or KO male mice. ns, not significant; ****p < 0.0001. Data are presented as the mean ± SEM and analyzed using a two-sided unpaired Student t test (e) and two-way ANOVA followed by Tukey’s post hoc test (c, d, f, g). The data represent three independent experiments with similar results. Source data are provided as a Source Data file.
Fig. 3
Fig. 3. PKN1 and PKN2 deletion in cardiac fibroblasts suppresses cardiac fibrosis after myocardial infarction.
a, b Fibrotic changes in the left ventricles after 7 days of myocardial infarction (MI) with the ischemia-reperfusion (IR) model were assessed using Picrosirius red staining (n = 8, biological replicates per group). ns, not significant; ****p < 0.0001. ce Echocardiogram analysis of left ventricular end-diastolic diameter (d; LVDd) and fractional shortening (e) was performed before and 7 days after MI accompanied by IR (n = 8, biological replicates per group). ns, not significant; ***p = 0.0004; ****p < 0.0001. Fibrotic changes in the left ventricles (f), LVDd (g), and fractional shortening (h) were examined after 28 days of MI with the IR model. ns, not significant; ***p = 0.0005; ****p < 0.0001. i Number of events during 7 days of MI accompanied by permanent ligation of the left coronary artery (n = 15, biological replicates per group). j Fractional shortening 7 days after permanent ligation of the left coronary artery (n = 6, biological replicates per group). ns, not significant; *p = 0.0108; ****p < 0.0001. Data are presented as the mean ± SEM and analyzed using the two-way ANOVA followed by Tukey’s post hoc test (b, dh, j). The data represent three independent experiments with similar results. Source data are provided as a Source Data file.
Fig. 4
Fig. 4. PKN1 and PKN2 deletion in cardiac fibroblasts suppresses the synthesis of collagen.
a Efficiency of PKN1 and PKN2 knockdown in cardiac fibroblasts as shown via western blot analysis. b Statistical evaluation of (a) (n = 6, biological replicates per group). ****p < 0.0001. c Quantification of the percentage of Ki67-positive cells in αSMA-positive cells (n = 6, biological replicates per group). ns, not significant. Scratch wound healing assay (d) and quantification (e) after 12 h (n = 5, biological replicates per group). ns, not significant; ****p < 0.0001. f, g Gene expression of collagen isoforms 1 and 3 (determined by quantitative real-time polymerase chain reaction; n = 4, biological replicates per group) after 48 h of TGF-β treatment. ns, not significant; ***p = 0.0003 (f). ns, not significant; ***p = 0.0008 (siControl, TGF-β – vs. siControl, TGF-β +); ***p = 0.0002 (siControl, TGF-β + vs. siPKN1/2, TGF-β +) (g). h, i Gene expression of collagen isoforms 1 and 3 (determined by quantitative real-time polymerase chain reaction; n = 6, biological replicates per group) in the infarct area after 28 days of an MI with the ischemia-reperfusion (IR) model. ns, not significant; **p = 0.0028; ***p = 0.0006 (h). ns, not significant; *p = 0.0284; **p = 0.0012 (i). Data are presented as the mean ± SEM and analyzed using a two-sided unpaired Student t test (b, c) and two-way ANOVA followed by the Tukey’s post hoc test (e, f, g, h, i). The data represent three independent experiments with similar results. Source data are provided as a Source Data file.
Fig. 5
Fig. 5. PKN1 and PKN2 deletion suppresses the differentiation of cardiac fibroblasts after MI.
a Immunofluorescent images of siRNA-treated cardiac fibroblasts immunostained for α-smooth muscle actin (αSMA)-positive stress fibers (green), PDGFRα (red), and nuclei (blue). Quantification of PDGFRα-positive cells (b) and αSMA-positive cells (c) shown as a percentage of DAPI-positive cells (n = 4, biological replicates per group). ns, not significant; ***p = 0.0001; ****p < 0.0001. d Immunofluorescent staining of fibroblasts and myofibroblasts in the cardiac infarction area 7 days after injury. The fibroblasts and myofibroblasts were immunostained for vimentin (red), αSMA (green), and nuclei (blue). e Quantification of vimentin-positive cells shown as a percentage of DAPI-positive cells (n = 6, biological replicates per group). ns, not significant; ****p < 0.0001. f Quantification of dual-positive cells for vimentin and αSMA shown as a percentage of vimentin-positive cells (n = 6, biological replicates per group). ns, not significant; ****p < 0.0001. g Quantification of vimentin-positive cells in the cardiac infarction area 28 days after injury (n = 8, biological replicates per group). ns, not significant; ****p < 0.0001. h Quantification of dual-positive cells for vimentin and αSMA shown as a percentage of vimentin-positive cells 28 days after injury (n = 8, biological replicates per group). ns, not significant; ****p < 0.0001. Data are presented as the mean ± SEM and analyzed using two-way ANOVA followed by Tukey’s post hoc test (b, c, e, f, g, h). The data represent three independent experiments with similar results. Source data are provided as a Source Data file.
Fig. 6
Fig. 6. PKN1/2 knockdown significantly reduced TGF-β-mediated p38 phosphorylation.
a Western blot analysis for TGF-β-mediated phosphorylation of Smad2 (Ser465/467) and p38 (Thr180/182) in cardiac fibroblasts. The results represent three independent experiments. Western blot analysis (b) and quantification for TGF-β-mediated phosphorylation of endogenous Smad2 (c) and p38 (d) in cardiac fibroblasts after siRNA-mediated PKN1/2 knockdown (n = 4, biological replicates per group). ns, not significant; *p = 0.0169; ***p = 0.0005; ****p < 0.0001. Immunofluorescent images (e) and quantification of the number (f) of cardiac fibroblasts with phosphorylated Smad3 (Ser423/425; red) after siRNA-mediated PKN1/2 knockdown and TGF-β treatment (n = 4, biological replicates per group). ns, not significant; ****p < 0.0001. Immunofluorescent images (g) and quantification of the number (h) of cardiac fibroblasts with phosphorylated p38 (green) after siRNA-mediated PKN1/2 knockdown and TGF-β treatment (n = 4, biological replicates per group). ns, not significant; ****p < 0.0001. Data are presented as the mean ± SEM and analyzed using two-way ANOVA followed by Tukey’s post hoc test (c, d, f, h). The data represent three independent experiments with similar results. Source data are provided as a Source Data file.
Fig. 7
Fig. 7. PKN1/2 knockdown significantly reduced MI-induced p38 phosphorylation.
a Western blot analysis for GFP-PKN-cat expression in cardiac fibroblasts. The results represent three independent experiments. Immunofluorescent images (b. blue, DAPI; green, GFP; red, αSMA) and quantification of the number (c) of αSMA-positive cardiac fibroblasts after overexpression of GFP-PKN-cat and treatment with a p38 inhibitor (10 μM, n = 4, biological replicates per group). ns, not significant; ****p < 0.0001. Immunofluorescent images (d) and quantification of the number (e) of cardiac fibroblasts with phosphorylated MKK3/6 (Ser218/Ser207, red) and DAPI (blue) after siRNA-mediated PKN1/2 knockdown and TGF-β treatment (n = 4, biological replicates per group). ns, not significant; ****p < 0.0001. Immunofluorescent-based quantification of dual-positive cells for PDGFRα and phosphorylated p38 shown as a percentage of PDGFRα-positive cells in the control and ischemia-reperfusion hearts at 3 days (f, n = 4, biological replicates per group) and 28 days (g, n = 8, biological replicates per group) after injury. ns, not significant; ***p = 0.0001; ****p < 0.0001. Data are presented as the mean ± SEM and analyzed with two-way ANOVA followed by Tukey’s post hoc test (c, e, f, g). The data represent three independent experiments with similar results. Source data are provided as a Source Data file.
Fig. 8
Fig. 8. PKN 1/2 deletion in resident cardiac fibroblasts, not in cardiomyocytes, suppressed cardiac fibrosis in HFpEF.
Fibrotic changes in left ventricles assessed using Picrosirius red staining at 10 weeks after combination exposure to HFD and L-NAME in Pdgfra-PKN1/2 WT and KO mice (a) and in cardiomyocyte-specific PKN1/2 (cmc-PKN1/2) WT and KO mice (b) (n = 6, biological replicates per group). ns, not significant; ****p < 0.0001. Fraction shortening examined using echocardiography at 0, 5, and 10 weeks after combination exposure to HFD and L-NAME in Pdgfra-PKN1/2 WT and KO mice (c) (n = 10, biological replicates per group) and in cmc-PKN1/2 WT and KO mice (d) (n = 6, biological replicates per group). ns, not significant. e Representative early diastolic mitral inflow velocity (top) and annular velocity (bottom). Mitral E and E’ waves (E/E’) ratio at 0, 5, and 10 weeks after combination exposure to HFD and L-NAME in Pdgfra-PKN1/2 WT and KO male mice (f) (n = 10, biological replicates per group), and in cmc-PKN1/2 mice WT and KO male mice (g) (n = 6, biological replicates per group). ns, not significant; ***p = 0.0006; ****p < 0.0001. h End-diastolic pressure-volume relationship (EDPVR) obtained by cardiac catheterization at 0 and 10 weeks after combination exposure to HFD and L-NAME in Pdgfra-PKN1/2 WT and KO mice (n = 6, biological replicates per group). ns, not significant; **p = 0.0035; ****p < 0.0001. i E/E’ at 0, 5, and 10 weeks after combination exposure to HFD and L-NAME in Pdgfra-PKN1/2 WT and KO female mice (n = 6, biological replicates per group). ns, not significant; ****p < 0.0001. Data are presented as the mean ± SEM and analyzed using two-way ANOVA followed by Tukey’s post hoc test (ad, h), or with two-way repeated measures ANOVA followed by Bonferroni post hoc test (f, g, i). The data represent three independent experiments with similar results. Source data are provided as a Source Data file.
Fig. 9
Fig. 9. PKN1/2 deletion suppressed the differentiation of cardiac fibroblasts in the HFpEF model.
a Immunofluorescent staining of fibroblasts and myofibroblasts at 10 weeks after combination exposure to HFD and L-NAME in Pdgfra-PKN1/2 WT and KO male mice (red, vimentin; green, αSMA; blue, nuclei). b Quantification of dual-positive cells for vimentin and αSMA shown as a percentage of vimentin-positive cells (n = 6, biological replicates per group). ns, not significant; ***p = 0.0008; ****p < 0.0001. c Quantification of the number of cardiac fibroblasts with phosphorylated Smad3 (Ser423/425) at 10 weeks after combination exposure to HFD and L-NAME in Pdgfra-PKN1/2 WT and KO male mice (n = 6, biological replicates per group). ns, not significant; ****p < 0.0001. Immunofluorescent images (d) and quantification of the number (e) of cardiac fibroblasts with phosphorylated p38 at 10 weeks after combination exposure to HFD and L-NAME in Pdgfra-PKN1/2 WT and KO male mice (n = 6, biological replicates per group. Red, Pdgfra; green, phosphorylated p38; blue, nuclei). ns, not significant; ****p < 0.0001. f Schematic diagram showing PKN1/2-mediated cardiac fibrosis. Data are presented as the mean ± SEM and analyzed using two-way ANOVA followed by the Tukey’s post hoc test (b, c, e). The data represent three independent experiments with similar results. Source data are provided as a Source Data file.

References

    1. Wynn, T. A. Cellular and molecular mechanisms of fibrosis. J. Pathol.214, 199–210 (2008). 10.1002/path.2277 - DOI - PMC - PubMed
    1. Wijsenbeek, M., Suzuki, A. & Maher, T. M. Interstitial lung diseases. Lancet400, 769–786 (2022). 10.1016/S0140-6736(22)01052-2 - DOI - PubMed
    1. Ginès, P. et al. Liver cirrhosis. Lancet398, 1359–1376 (2021). 10.1016/S0140-6736(21)01374-X - DOI - PubMed
    1. Henderson, N. C., Rieder, F. & Wynn, T. A. Fibrosis: from mechanisms to medicines. Nature587, 555–566 (2020). 10.1038/s41586-020-2938-9 - DOI - PMC - PubMed
    1. Savarese, G. & Lund, L. H. Global public health burden of heart failure. Card. Fail. Rev.3, 7–11 (2017). 10.15420/cfr.2016:25:2 - DOI - PMC - PubMed

Publication types

MeSH terms

Substances

LinkOut - more resources