. 2024 Sep 12;13(1):33.
doi: 10.1038/s41389-024-00534-1.

TFCP2L1 drives stemness and enhances their resistance to Sorafenib treatment by modulating the NANOG/STAT3 pathway in hepatocellular carcinoma

Affiliations

TFCP2L1 drives stemness and enhances their resistance to Sorafenib treatment by modulating the NANOG/STAT3 pathway in hepatocellular carcinoma

Dongbo Qiu et al. Oncogenesis. .

Abstract

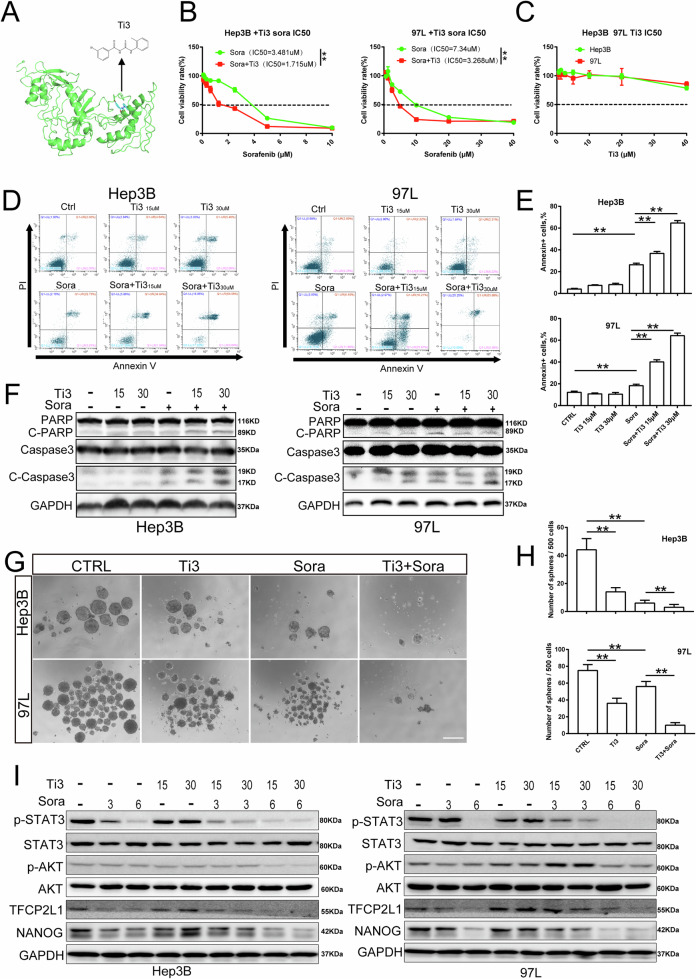
Hepatocellular carcinoma (HCC) is a prevalent and aggressive malignancy associated with high risks of recurrence and metastasis. Liver cancer stem cells (CSCs) are increasingly recognized as pivotal drivers of these processes. In our previous research, we demonstrated the involvement of TFCP2L1 in maintaining the pluripotency of embryonic stem cells. However, its relevance to liver CSCs remains unexplored. In this study, we report an inverse correlation between TFCP2L1 protein levels in HCC tissue and patient outcomes. The knockdown of TFCP2L1 significantly reduced HCC cell proliferation, invasion, metastasis, clonal formation, and sphere-forming capacity, while its overexpression enhanced these functions. In addition, experiments using a nude mouse model confirmed TFCP2L1's essential role in liver CSCs' function and tumorigenic potential. Mechanistically, we showed that TFCP2L1 promotes the stemness of CSCs by upregulating NANOG, which subsequently activates the JAK/STAT3 pathway, thereby contributing to HCC pathogenesis. Importantly, we identified a specific small molecule targeting TFCP2L1's active domain, which, in combination with Sorafenib, sensitizes hepatoma cells to treatment. Together, these findings underscore TFCP2L1's pathological significance in HCC progression, supporting its potential as a prognostic biomarker and therapeutic target in this disease.


Conflict of interest statement

The authors declare no competing interests.

Figures

Fig. 1
Fig. 1. Expression level of TFCP2L1 in liver tissue is inversely correlated with the survival of HCC patients.
A Kaplan–Meier curve analysis depicting overall survival (OS; p = 0.022) in HCC patients based on high and low TFCP2L1 expression levels in TCGA cohorts. B Kaplan–Meier curve analysis illustrating disease-specific survival (p = 0.085) in HCC patients stratified by high and low TFCP2L1 expression using TCGA cohorts. C Immunohistochemical staining showing TFCP2L1 expression in tumor and adjacent normal liver tissues. D Representative images demonstrating high and low TFCP2L1 expression in tumor tissues. E, F Kaplan-Meier curve analysis presenting overall survival (OS; p = 0.001) and progression-free survival (PFS; p = 0.014) in HCC patients based on high and low TFCP2L1 protein expression levels in immunohistochemical staining (Red arrowhead indicates low nuclear expression; blue arrowhead indicates high nuclear expression). G Quantitative analysis of TFCP2L1 mRNA expression levels in liver tissues from HCC patients by qRT-PCR analysis (n = 16 paired samples, p = 0.0053). H Western blot analysis showing representative TFCP2L1 protein levels in adjacent normal tissues and tumor tissues from 10 HCC patients.
Fig. 2
Fig. 2. TFCP2L1 expression is increased in HCC cell spheres.
A Western blot analysis of TFCP2L1 protein expression levels in different HCC cell lines, with β-ACTIN used as a loading control. B qRT-PCR analysis of TFCP2L1 mRNA expression levels in different HCC cell lines. C Quantification of CD133 and CD90 double-positive cells by flow cytometry after culturing different HCC cell lines in tumor sphere-forming medium for 12 days. DG qRT-PCR analysis showing mRNA expression levels of OCT4, NANOG, c-MYC, and TFCP2L1 in various types of HCC spheres across different passages. H Western blot analysis depicting c-MYC and TFCP2L1 protein expression levels in different HCC cell lines, with GAPDH used as a loading control. I Fold change in TFCP2L1 mRNA expression levels in liver tissues of HCC patients with varying expression levels of CSC genes. The data are presented as mean ± SD of three independent experiments. *p < 0.05; **p < 0.01; ns no significance, compared with the control group.
Fig. 3
Fig. 3. TFCP2L1 overexpression promotes the proliferation and clonogenicity of HCC cells.
A Western blot analysis showing the effect of TFCP2L1 overexpression in Hep3B and 97L cell lines. B Cell viability of Hep3B and 97L cells overexpressing TFCP2L1 assessed by CCK-8 assay at indicated time points. C Colony formation assay demonstrating increased clonogenicity of Hep3B and 97 L cell lines with TFCP2L1 overexpression. D Representative images of sphere formation assay in Hep3B and Huh7 cells with TFCP2L1 overexpression. Scale bar = 100 μm. E, F Quantitative analysis of colony formation (E) and sphere formation (F) assays. G Representative images of transwell invasion assay showing enhanced invasion of Hep3B and 97L cells overexpressing TFCP2L1 compared to empty vector control. Scale bar = 100 μm. H Quantitative analysis of cell invasion. I IC50 values of Sorafenib in indicated HCC cell lines after 48 h, evaluated using Compusyn. The data are presented as mean ± SD of three independent experiments. *p < 0.05; **p < 0.01; ns no significance, compared with the control group.
Fig. 4
Fig. 4. TFCP2L1 knockdown decreases the proliferation and clonogenicity of HCC cells.
A qRT-PCR analysis showing the effect of TFCP2L1 knockdown in Hep3B and 97 L cell lines. B Western blot analysis confirming TFCP2L1 knockdown in Hep3B and 97 L cell lines. C Cell viability of Hep3B and 97 L cells with TFCP2L1 knockdown assessed by CCK-8 assay at indicated time points. D Colony formation assay demonstrating reduced clonogenic potential of Hep3B and 97L cell lines with TFCP2L1 knockdown. E Quantitative analysis of colony formation assay. F Representative images of sphere formation assay in Hep3B and 97L cells with TFCP2L1 knockdown. Scale bar = 100 μm. G Quantitative analysis of sphere formation assay. H Representative images of transwell invasion assay showing decreased invasion of Hep3B and 97 L cells with TFCP2L1 knockdown compared to scramble RNA control. Scale bar = 100 μm. I Quantitative analysis of cell invasion assay. J IC50 values of Sorafenib in indicated HCC cell lines after 48 h, evaluated using Compusyn. K Photograph of xenograft tumors derived from modified Hep3B cells at the final time point after subcutaneous injection into nude mice. L Statistical analysis of the final weight of xenograft tumors derived from indicated Hep3B cells at the endpoint. The data are presented as mean ± SD of three independent experiments. *p < 0.05; **p < 0.01; ns no significance, compared with the control group.
Fig. 5
Fig. 5. The N-terminal domain and CP2 domain are required to promote TFCP2L1 function.
A Schematic representation of TFCP2L1 domains. B Western blot analysis showing overexpression of different TFCP2L1 mutants in Hep3B and 97L cell lines. C Representative images of transwell invasion assay in indicated cell lines, with empty vector as the control group. Scale bar = 100 μm. D Colony formation assay of indicated cell lines, with empty vector as the control group. E Representative images of sphere formation assay in indicated cell lines. Scale bar = 100 μm. FH Quantitative analysis of cell invasion (F), colony formation (G), and sphere formation (H) assays. The data are presented as mean ± SD of three independent experiments. *p < 0.05; **p < 0.01; ns no significance, compared with the control group.
Fig. 6
Fig. 6. Potential mechanism for the stem cell-promotion activity of TFCP2L1.
A Western blot analysis of total and phosphorylated levels of STAT3, AKT, and ERK after TFCP2L1 overexpression in Hep3B and 97L cells. B Western blot analysis of total and phosphorylated levels of STAT3, AKT, and ERK after TFCP2L1 knockdown in Hep3B and 97L cells. C Quantitative analysis of phosphorylation levels in panel A. D Quantitative analysis of phosphorylation levels in panel B. E Western blot analysis showing expression levels of CTNNB1, c-MYC, and NANOG after TFCP2L1 overexpression in Hep3B and 97L cells. F Western blot analysis showing expression levels of CTNNB1, c-MYC, and NANOG after TFCP2L1 knockdown in Hep3B and 97L cells. G Promoter activity of the NANOG gene measured using Dual-luciferase reporter assay. The cells were transfected with pGL3-basic or various lengths of the 5′-flanking region of the NANOG gene, as indicated. The data are presented as mean ± SD of three independent experiments. *p < 0.05; **p < 0.01; ns no significance, compared with the control group.
Fig. 7
Fig. 7. TFCP2L1 specific inhibitor promotes the anti-tumor effects of Sorafenib by suppressing the STAT3/NANOG pathway.
A Structural formula of Ti3, a specific inhibitor of TFCP2L1. B IC50 values of Sorafenib in the indicated HCC cell lines for 48 h with or without Ti3. C IC50 values of Ti3 in the indicated HCC cell lines for 48 h were evaluated using Compusyn. D Cell apoptosis of HCC cell lines treated with Ti3, Sorafenib, and their combination at different concentrations as assessed by flow cytometry. E Quantitative analysis of apoptotic cells in panel D. F Expression of cleaved-PARP, PARP, cleaved-Caspase3, and Caspase3 after treatment with Ti3 or Sorafenib at indicated concentrations in HCC cell lines detected by western blotting. G Representative image of sphere formation assay in indicated cell lines treated with Ti3, Sorafenib, and their combination. Scale bar = 100 μm. H Quantitative analysis of sphere formation in panel G. I Expression of p-STAT3, STAT3, p-AKT, AKT, TFCP2L1, and NANOG after treatment with Ti3 or Sorafenib at indicated concentrations in HCC cell lines detected by western blotting. The data are presented as mean ± SD of three independent experiments. *p < 0.05; **p < 0.01; ns no significance, compared with the control group.
Fig. 8
Fig. 8. Effects of Sorafenib and TFCP2L1 inhibitor combination treatment on Hep3B xenografts.
AC Photographs of Hep3B-Ctrl (A), Hep3B TFCP2L1-OE (B), and Hep3B TFCP2L1-KO (C) xenograft tumors at the endpoint after treatment with the indicated drug combinations. DF Statistical analysis of the final weight of xenograft tumors at the endpoint. *p < 0.05; **p < 0.01; ns represents no significance compared with the control group. GI Immunofluorescence staining of Caspase3 and TFCP2L1 expression in xenograft tumors, along with TUNEL staining to assess tumor cell apoptosis. Representative images are shown. DAPI was used to stain the nuclei. Scale bar = 100 μm. J Statistical analysis of TUNEL-positive cells per field from panels GI. *p < 0.05; **p < 0.01; ns represents no significance compared with the control group. K Graphical abstract of the research findings. TFCP2L1 drives NANOG expression in HCC cells, activating the JAK/STAT3 signaling pathway to promote CSC stemness and HCC pathogenesis. The small molecule Ti3, which targets the active domain of TFCP2L1, can enhance the efficacy of Sorafenib treatment in hepatoma cells.

Similar articles

Cited by

References

    1. Liao W, Coupland CAC, Innes H, Jepsen P, Matthews PC, Campbell C, et al. Disparities in care and outcomes for primary liver cancer in England during 2008-2018: a cohort study of 8.52 million primary care population using the QResearch database. EClinicalMedicine. 2023;59:101969. 10.1016/j.eclinm.2023.101969 - DOI - PMC - PubMed
    1. Siegel RL, Miller KD, Wagle NS, Jemal A. Cancer statistics, 2023. CA: A Cancer J Clinicians. 2023;73:17–48. - PubMed
    1. Kim J, Kang W, Sinn DH, Gwak GY, Paik YH, Choi MS, et al. Substantial risk of recurrence even after 5 recurrence-free years in early-stage hepatocellular carcinoma patients. Clin Mol Hepatol. 2020;26:516–28. 10.3350/cmh.2020.0016 - DOI - PMC - PubMed
    1. Marasco G, Colecchia A, Colli A, Ravaioli F, Casazza G, Bacchi Reggiani ML, et al. Role of liver and spleen stiffness in predicting the recurrence of hepatocellular carcinoma after resection. J Hepatol. 2019;70:440–8. 10.1016/j.jhep.2018.10.022 - DOI - PubMed
    1. Ladd AD, Duarte S, Sahin I, Zarrinpar A. Mechanisms of drug resistance in HCC. Hepatology. 2024;79:926–40. 10.1097/HEP.0000000000000237 - DOI - PubMed

LinkOut - more resources