. 2024 Sep 12;15(1):7941.
doi: 10.1038/s41467-024-52067-1.

Cellular origin and clonal evolution of human dedifferentiated liposarcoma

Affiliations

Cellular origin and clonal evolution of human dedifferentiated liposarcoma

Nadège Gruel et al. Nat Commun. .

Abstract

Dedifferentiated liposarcoma (DDLPS) is the most frequent high-grade soft tissue sarcoma subtype. It is characterized by a component of undifferentiated tumor cells coexisting with a component of well-differentiated adipocytic tumor cells. Both dedifferentiated (DD) and well-differentiated (WD) components exhibit MDM2 amplification, however their cellular origin remains elusive. Using single-cell RNA sequencing, DNA sequencing, in situ multiplex immunofluorescence and functional assays in paired WD and DD components from primary DDLPS tumors, we characterize the cellular heterogeneity of DDLPS tumor and micro-environment. We identify a population of tumor adipocyte stem cells (ASC) showing striking similarities with adipocyte stromal progenitors found in white adipose tissue. We show that tumor ASC harbor the ancestral genomic alterations of WD and DD components, suggesting that both derive from these progenitors following clonal evolution. Last, we show that DD tumor cells keep important biological properties of ASC including pluripotency and that their adipogenic properties are inhibited by a TGF-β-high immunosuppressive tumor micro-environment.


Conflict of interest statement

The authors declare no competing interests.

Figures
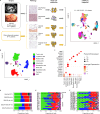
Fig. 1
Fig. 1. Single-cell analysis of adipocytic lesions.
A Graphical view of the study roadmap. Fresh samples were collected from patients undergoing surgery for primary untreated DDLPS (N = 11) and other adipocytic tumors (N = 11) and processed for single-cell suspension. For DDLPS, paired samples in the well-differentiated area (WD, white star) and in the dedifferentiated area (DD, black star) were identified on pre-operative computed tomography, defined macroscopically on the surgical specimen, and later confirmed at the microscopic level by expert pathologists. All samples were analyzed by scRNA-seq using the 10X Genomics platform and integrated into a single adipocytic tumor atlas. A total of 102,753 single cells were recovered, clustering within 42 clusters according to Seurat, and used for subsequent analyses. B Uniform Manifold Approximation and Projection (UMAP) of the 10 main cell types identified according to expression of marker genes. C Dot plots showing the expression of 15 marker genes across the 10 cellular clusters. The size of the dot represents the proportion of cells expressing the marker and the spectrum of color indicates the average expression level of the marker (log1p transformed) scaled over cell clusters. D Relative proportion of each cell cluster according to the histological subtypes (Lipoma, N = 1; WDLPS, N = 5; DDLPS, N = 19; DDLPS-WD, N = 10; DDLPS-DD, N = 9). E: Relative proportion of each cell cluster according to Lipoma (N = 1), WDLPS (N = 5), and DDLPS (N = 11) patients. F: Relative proportion of each cell cluster between paired WD and DD samples from DDLPS patients (N = 8 paired samples). Color scales are similar for panels (B, D, E, and F). Source data are provided as a Source Data file.
Fig. 2
Fig. 2. Heterogeneity of myeloid and lymphoid cell populations within adipocytic tumors.
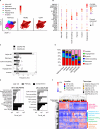
A UMAP of the 10 main myeloid cell types identified according to the expression of marker genes. B Dot plots showing the expression of 22 marker genes across the clusters (n = 26,557 single cells). C Proportion of the myeloid populations among all myeloid cells according to histological subtypes (Lipoma, N = 1; WDLPS, N = 5; DDLPS, N = 19; DDLPS-WD, N = 10; DDLPS-DD, N = 9). D Proportion of CD163-positive myeloid cells by immunohistochemistry (IHC) in the independent cohort of paired WD and DD DDLPS (N = 15). The mean value is indicated in bold ( ± SD). p-val = 2.6 × 10−6 (two-sided t test). E In situ multiplex immunofluorescence (mIF) staining of tumor cells (MDM2+), monocytes/macrophages (CD163+), M2-like macrophages (TAM2-like, CD163+ and CD68+), myeloid-derived suppressor cells (MDSC, CD33+) and tumor-associated neutrophils (TAN, S100A8+) (representative pictures from one paired tumor sample, n = 7 paired samples analyzed); scale bar: 50 µm. F UMAP of the 8 main lymphoid cell types. G Dot plots showing the expression of 10 marker genes across the clusters (n = 19,978 single cells). H Proportions of the lymphoid populations among all lymphoid cells according to histological subtypes (Lipoma, N = 1; WDLPS, N = 5; DDLPS, N = 19; DDLPS-WD, N = 10; DDLPS-DD, N = 9). I Proportion of CD3-positive (left panel, N = 21 DDLPS-WD and N = 19 DDLPS-DD) and FOXP3-positive (right panel, N = 15 DDLPS-WD and N = 10 DDLPS-DD) T cells by IHC in an independent cohort of WD and DD DDLPS components; the number of CD3 and FOXP3-positive cells was normalized on the same number of total cells in both components. The mean value is indicated in bold (± SD). p-val = 1 × 10−3 (CD3) and p-val = 4 × 10−4 (FOXP3) (two-sided t test). J mIF staining of tumor cells (MDM2+), T lymphocytes (CD4+ or CD8+), CD4 Treg cells (CD4+, FOXP3+), and exhausted CD8 T cells (CD8+, PD1+) (representative pictures from one paired tumor sample, n = 7 paired samples analyzed); scale bar: 50 µm. Abbreviations: c: classical; i: intermediate; nc: non-classical. ***: p-val ≤ 0.001. Source data are provided as a Source Data file.
Fig. 3
Fig. 3. Transcriptional heterogeneity of DDLPS tumor cells.
A UMAP of the 6 main tumor cell populations identified within DDLPS-WD (N = 10) and DDLPS-DD (N = 9) samples (N = 24,000 single cells) (left panel). All cells are characterized by strong expression of MDM2 and CDK4 (middle and right panel). B Dot plots showing the expression of 20 marker genes across the 6 identified cellular clusters. C Proportion of DDLPS-WD and DDLPS-DD tumor cells within each cell cluster. Adipo diff, p-val = 0.0 × 100; stemness, p-val = 3.3 × 10−113; ECM remodeling, p-val = 4.1 × 10−2; hypoxia p-val = 4.1 × 10−2; angiogenesis, p-val = 0.0 × 100; invasion: p-val = 2.8 × 10−13 (Chi2 test). D Distribution of cells within each of the 6 clusters in all samples analyzed by scRNA-seq and within each tissue type (Adipose tissue, N = 5; Lipoma, N = 1; WDLPS, N = 5; DDLPS, N = 19; DDLPS-WD, N = 10; DDLPS-DD, N = 9). E Barplots showing Gene Ontologies (GO), pathways, and coexpression identified with Toppfun analysis and found differentially and specifically (p-val_adj ≤ 0.05) overexpressed in DDLPS-WD (left panel) or DDLPS-DD (right panel) tumor cells after FDR correction for multiple testings. F Hierarchical clustering and scaled expression matrix using the 800 most variant genes across the larger cohort of adipocytic samples analyzed by bulk RNA-seq. Abbreviations: Adipo diff: adipocytic differentiation. ECM: extracellular matrix. UR: upregulated. *: p-val ≤ 0.05; ***: p-val ≤ 0.001; ns: p-val > 0.05. Source data are provided as a Source Data file.
Fig. 4
Fig. 4. Identification of a population of tumor adipose stem cells at the origin of DDLPS.
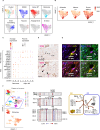
A UMAP of the 12 main tumor cell clusters found in DDLPS-WD samples (N = 10), expression of MDM2, and application of the 6 main gene expression signatures identified in the whole dataset. B UMAP showing the expression of three previously reported adipocyte stem cell signatures in DDLPS-WD tumor cells. C Dot plots showing the expression of 10 ASPC marker genes and 7 pre-adipocytes/adipocytes marker genes across the stemness and adipocytic differentiation clusters. D MDM2 (pink) and CD55 (brown) immunohistochemical stainings of a human DDLPS-WD component showing the presence of double positive, undifferentiated tumor cells interspersed between tumor adipocytes (arrowheads) (Scale bars: 100 µm (upper panel) and 50 µm (lower panel)); n = 9 tumor samples analyzed. E In situ multiplex immunofluorescence staining of tumor adipocyte stem cells with MDM2, CD55, CD44, and ALDH1 antibodies; n = 7 tumor samples analyzed. Scale bar: 50 µm. F Representative example of the genomic evolution of DDLPS-WD and -DD components from tumor ASPC (Patient P15). Left panel: UMAP of the tumor clusters identified in WD and DD components (top) and of the expression of the stemness signature highlighting one cluster (WD-4) in the WD component of the tumor (bottom). Middle panel: inference of Copy Number Variations (CNVs) using InferCNV in all tumor cell clusters of patient P15. Right panel: reconstitution of P15 genomic clonal and subclonal evolution based on CNVs found in each cell cluster.
Fig. 5
Fig. 5. WD and DD DDLPS components diverge early from a common genomic ancestor.
A Pangenomic profiles assessed by shallow Whole Genome Sequencing (shWGS) of P14 (upper panel), P29 (middle panel), and P48 (lower panel) paired DDLPS samples showing major Copy Number Variations (CNVs) private to each WD (blue) and DD (red) component. B Genomic profiles of the chromosome 12q region containing MDM2 and CDK4 showing the shared amplicons between WD (red) and DD (blue) pairs for patients P14 (left panel), P29 (middle panel), and P48 (right panel). C Oncoprint summarizing the main CNVs found in WD and DD pairs analyzed by shWGS, either private to one component or shared by both components. The genomic profiles obtained after shWGS initially contained 52,725 segments that were combined into 296 final chromosomal regions containing the largest and most discriminant alterations spanning the 22 chromosomes, and represented on the Y-axis of the oncoprint. D Oncoprint summarizing the single nucleotide variations found by targeted DNA Sequencing using the SureSelect CD Curie CGP panel (Agilent) in paired WD and DD DDLPS samples.
Fig. 6
Fig. 6. DDLPS tumor cells keep the biological properties of ASPC.
A Graphical view of the study roadmap. DDLPS tumors from four different PDX models were resected from nude mice and processed for single-cell suspension before being cultured in the presence of adipocytic differentiation cocktail (ADC) for 14 days or osteogenic differentiation cocktail (ODC) for 21 days and then later processed for characterization of differentiation using RT-qPCR and phenotypic staining. B Bodipy staining (green) after culture with ADC, and Alizarin red staining (red) after culture with ODC showing the multipotent properties of PDX SIL10AS tumor cells (Gx10). C Western Blot showing the expression of phospho-Smad2 (P-Smad2), total Smad2, and GAPDH in PDX SIL10AS cells after treatment with TGF-β and TGF-βR inhibitors SB431542 and galunisertib and quantification of P-Smad2/total Smad2 expression in comparison to TGF-β condition. D Bodipy staining of SIL10AS PDX cells cultured for 14 days in ADC, in the presence or absence of TGF-β and TGF-βR inhibitors SB431542 and galunisertib (left panel, Gx10) and quantification of the activity of TGF-β (p-val = 5.3 × 10−12) and TGF-βR inhibitors SB431542 (p-val = 3.7 × 10−6) and galunisertib (p-val = 3.3 × 10−9) on tumor cells adipocytic differentiation properties evaluated by Bodipy staining (N = 10 independent experiments, median ± SD, one-sided ANOVA test) (right panel). E Relative expression of FABP4 by RT-qPCR in PDX SIL10AS cells in the presence of TGF-β (p-val = ns) and TGF-βR inhibitors SB431542 (p-val = 1.7 × 10−3) and galunisertib (p-val = 1.1 × 10−4) (n = 3 independent experiments, mean ± SD, Chi2 test). F Western Blot showing the expression of FABP4 in PDX SIL10AS cells in the presence of TGF-β and TGF-βR inhibitors (n = 3 independent experiments). G In situ multiplex immunofluorescence staining of tumor cells (MDM2+), monocytes/macrophages (CD14+), and T lymphocytes (CD3+) together with TGFβ1; n = 7 tumor samples analyzed. Scale bar: 50 µm. H Quantification of intratumoral TGF-β concentration by ELISA in WD (N = 5) and DD (N = 4) samples from human DDLPS (mean ± SD). p-val = 1.4 × 10−2 (two-sided t test). Abbreviations:  *: p-val  ≤ 0.05; **: p-val ≤ 0.01; ***: p-val ≤ 0.001. Source data are provided as a Source Data file.
Fig. 7
Fig. 7. Model of the tumoral and microenvironmental heterogeneity of DDLPS.
In the context of low-TGF-β exposition, DPP4+CD55+ liposarcoma adipocyte stem cells (LPS ASC) harboring MDM2 amplification can differentiate into the adipocytic lineage and give rise to the development of WDLPS and DDLPS-WD component, characterized by expression of adipocytic-related genes and anti-tumoral tumor micro-environment containing Natural Killer (NK) cells, Dendritic cells (DC) and monocytes. Following a maturation arrest signal during LPS ASC early adipocytic differentiation and acquisition of copy number events and genomic instability, clones of undifferentiated tumor cells arise and develop within a TGF-β-high microenvironment. TGF-β prevents the differentiation of tumor cells into the adipocytic lineage and favors cell proliferation, metastases, and development of a DDLPS-DD immunosuppressive TME containing myeloid-derived suppressor cells (MDSC), tumor-associated neutrophils (TAN), immunosuppressive tumor-associated macrophages (TAM-2 like), CD4+ Treg cells and exhausted CD8+ T cells.

References

    1. Lee, A. T. J., Thway, K., Huang, P. H. & Jones, R. L. Clinical and molecular spectrum of liposarcoma. J. Clin. Oncol.36, 151–159 (2018). 10.1200/JCO.2017.74.9598 - DOI - PMC - PubMed
    1. Board, W.C.o.T.E. WHO Classification of Tumours: Soft Tissue and Bone Tumours, (International Agency for Research on Cancer, 2020).
    1. de Pinieux, G. et al. Nationwide incidence of sarcomas and connective tissue tumors of intermediate malignancy over four years using an expert pathology review network. PLoS ONE16, e0246958 (2021). 10.1371/journal.pone.0246958 - DOI - PMC - PubMed
    1. Coindre, J. M., Pedeutour, F. & Aurias, A. Well-differentiated and dedifferentiated liposarcomas. Virchows Arch.456, 167–179 (2010). 10.1007/s00428-009-0815-x - DOI - PubMed
    1. Gronchi, A. et al. Soft tissue and visceral sarcomas: ESMO-EURACAN-GENTURIS Clinical Practice Guidelines for diagnosis, treatment and follow-up(☆). Ann. Oncol.32, 1348–1365 (2021). 10.1016/j.annonc.2021.07.006 - DOI - PubMed

Publication types

MeSH terms

Substances