. 2024 Sep 12;15(1):8002.
doi: 10.1038/s41467-024-52326-1.

SHANK3 depletion leads to ERK signalling overdose and cell death in KRAS-mutant cancers

Affiliations

SHANK3 depletion leads to ERK signalling overdose and cell death in KRAS-mutant cancers

Johanna Lilja et al. Nat Commun. .

Abstract

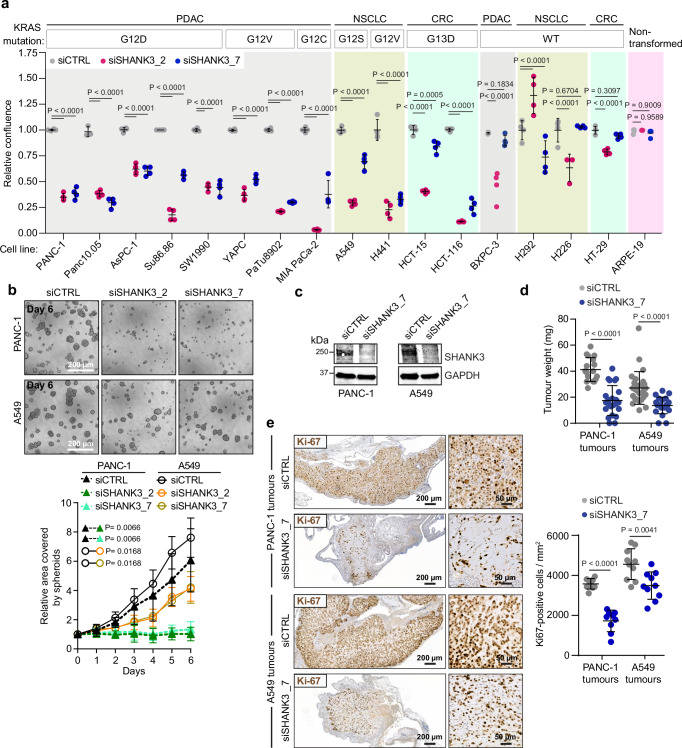
The KRAS oncogene drives many common and highly fatal malignancies. These include pancreatic, lung, and colorectal cancer, where various activating KRAS mutations have made the development of KRAS inhibitors difficult. Here we identify the scaffold protein SH3 and multiple ankyrin repeat domain 3 (SHANK3) as a RAS interactor that binds active KRAS, including mutant forms, competes with RAF and limits oncogenic KRAS downstream signalling, maintaining mitogen-activated protein kinase/extracellular signal-regulated kinase (MAPK/ERK) activity at an optimal level. SHANK3 depletion breaches this threshold, triggering MAPK/ERK signalling hyperactivation and MAPK/ERK-dependent cell death in KRAS-mutant cancers. Targeting this vulnerability through RNA interference or nanobody-mediated disruption of the SHANK3-KRAS interaction constrains tumour growth in vivo in female mice. Thus, inhibition of SHANK3-KRAS interaction represents an alternative strategy for selective killing of KRAS-mutant cancer cells through excessive signalling.


Conflict of interest statement

The authors J.L. and J.I. declare that they have filed patent applications related to these findings (Therapy of Ras-Dependent Cancers, WO/2021/160937; Nanobodies specifically binding to SH3 and multiple ankyrin repeat domains 3 (SHANK3), WO/2023/021181). All other authors declare no competing interests.

Figures

Fig. 1
Fig. 1. SHANK3 depletion inhibits cell proliferation in vitro and in vivo in different cancer types driven by distinct KRAS mutations.
a A cell proliferation screen following control (siCTRL, grey) or SHANK3 silencing (siSHANK3_2 (red) or siSHANK3_7 (blue)) in wild-type (WT) or KRAS-mutant pancreatic (PDAC), lung (NSCLC) and colorectal (CRC) cancer cell lines. ARPE-19, non-transformed retinal epithelial cells. Shown are the individual data points relative to control [the mean of the control is set to 1.0 by definition; data are mean ± s.d.; n = 3 (Panc10.05 siCTRL and H226 siSHANK3_2) or 4 (other samples) individually silenced wells; two-way ANOVA with Dunnett’s multiple comparisons test]. b Spheroid growth of siCTRL or siSHANK3 PANC-1 or A549 cells. Shown are representative images and quantification of spheroid area (mean ± s.d.; n = 3 independent experiments; statistical analysis at end point, one-way ANOVA with Holm-Sidak’s multiple comparison test). ce Analysis of siCTRL or siSHANK3 PANC-1 and A549 tumour growth on chorioallantoic membranes (CAMs). c Immunoblots showing SHANK3 protein levels in cell suspensions inoculated onto the CAMs [n = 1 (PANC1) and 2 (A549) independent experiments], (d) tumour weights, and (e) representative immunostainings and quantification of Ki-67-positive cells in tumours. Shown are individual data points [mean ± s.d.; n = 17 (PANC-1 siCTRL), 23 (PANC-1 siSHANK3), 27 (A549 siCTRL) or 22 (A549 siSHANK3) (d) and 9 (PANC-1) or 10 (A549) (e) tumours per sample group from 1 (PANC-1) or 2 (A549) independent experiments; two-way ANOVA with Mann–Whitney test (d) and Unpaired two-tailed Student’s t-test with Welch’s correction (e)]. Source data are provided as a Source Data file.
Fig. 2
Fig. 2. SHANK3 directly interacts with active KRAS, regardless of the activating mutation.
a Schematic of the SHANK3 protein domains and crystal structure model of the SHANK3 SPN domain in complex with active KRAS. The zoom-in shows the critical interacting amino acids. Modified from our previous publication. SPN, Shank/ProSAP N-terminal domain; ARR, ankyrin repeat domain; SH3, Src homology 3 domain; PDZ, PSD-95/Discs large/ZO-1 domain; PP, proline-rich region; SAM, sterile alpha motif domain. b MST binding curve for the indicated proteins. The affinity curve and Kd-value are obtained from triplicate measurements (mean ± s.e.m.; representative of two independent experiments). c, d ITC titration and isotherms for interaction between the indicated proteins. Solid line in c indicates fitting to the single-site-bin ding model at 25 °C with 350 µM of KRASQ61H and 20 µM of SPN-ARR (graphs are a representative of three technical replicates; one independent experiment). e Immunoprecipitation (IP) in HEK293 cells co-expressing mRFP-SHANK3 WT and GFP-KRASG12V using mRFP-trap beads. A representative western blot is shown (three independent experiments). f IP in HEK293 cells co-expressing the GFP-tagged SHANK3 SPN domain (WT or RAS-binding-deficient mutant, R12E/K22D) and KRASG12V-dsRed using GFP-trap beads. A representative western blot is shown (three independent experiments). g FRET assay between GFP-tagged SHANK3 SPN domain (WT or R12E/K22D; FRET donor) and mCherry-KRASG12V (FRET acceptor) in HEK293 cells. Quantification of relative FRET efficiency, normalised to mCherry control vector (see methods). Individual data points and the population average of each biological replicate are shown [mean ± s.d.; three independent experiments; unpaired two-tailed Student’s t-test with Welch’s correction; 190 (mCherry +  WT SPN), 227 (mCherry-KRASG12V + WT SPN), 108 (mCherry + R12E/K22D SPN), 153 (mCherry-KRASG12V + R12E/K22D SPN) individual data points analysed]. h, i Rescue of cell viability after SHANK3 silencing. Quantification of viable GFP- or mCherry-positive MIA PaCa-2 cells expressing either full-length GFP-SHANK3 WT or mutant R12E/K22D (h), or GFP/mCherry-tagged SHANK3 SPN domain (i) after endogenous SHANK3 silencing (36 h). Shown are individual data points [mean ± s.d., n = 4 (h) and 3 (i) independent experiments (i, each replicate is shown in a different colour); one-way ANOVA with Holm-Sidak’s multiple comparison test]. Source data are provided as a Source Data file.
Fig. 3
Fig. 3. SHANK3 competes with RAF for the binding of active KRAS and limits downstream MAPK/ERK signalling.
a Representative images of GFP-SHANK3 and mCherry-KRASG12V localisation in A549 cells (maximum projections shown; one experiment with this cell line). Insets and yellow arrows indicate colocalization of GFP-SHANK3 with mCherry-KRASG12V at membrane protrusions. b KRAS–SHANK3 SPN-ARR in an open conformation modelled by aligning the RBD and SPN domains of RAF and SHANK3, respectively, on a membrane composed of POPC (1-Palmitoyl-2-oleoyl-sn-glycero-3-phosphocholine)/ Phosphatidylinositol 4,5-bisphosphate/ Cholesterol. c Structural alignment between KRAS–SHANK3 SPN-ARR (model) and nanodisc-bound KRAS–RAF complex (PDB:6PTW). d Analysis of RAF-RBD–KRAS binding in the presence of the SHANK3 SPN domain using the depicted pulldown assay. Samples were resolved on SDS-PAGE gel and stained with Coomassie. A representative gel is shown (three independent experiments). e Quantification of relative FRET efficiency between GFP-KRASG12V (FRET donor) and mRFP-RAF-RBD (FRET acceptor) in siCTRL or siSHANK3 (smartpool SHANK3 siRNA) HEK293 cells. Shown are the individual data points [mean ± s.d., n = 79 (siCTRL) or 87 (siSHANK3) from three independent experiments. Unpaired two-tailed Student’s t-test with Welch’s correction]. f A representative immunoblot and quantification of ERK activation levels (phospho-ERK1/2 (Thr202/Y204) / total ERK relative to loading) in HCT-116 cells expressing GFP-SHANK3 SPN WT or GFP-SHANK3 SPN R12E/K22D (data represent the individual values; mean ± s.d.; mean of control is set to 1.0 by definition; three independent experiments; Kruskal-Wallis one-way ANOVA and Dunn’s post hoc test). g Representative confocal images (middle plane) and quantification of nuclear ERK (indicating ERK activity) in MIA PaCa-2 cells. Yellow arrowheads point to representative nuclei. N/C, nuclear to cytoplasmic ratio. Shown are the individual data points and the population average of each biological replicate (mean ± s.d.; three independent experiments; one-way ANOVA with Holm-Sidak’s multiple comparison test). h Representative images and quantification of tumour growth of HCT-116 cells, transiently expressing GFP-SHANK3 SPN WT or GFP-SHANK3 SPN R12E/K22D, on CAMs. Tumours are delimited by the yellow circles [mean ± s.d.; n = 21 (GFP, SPN WT) or 19 (SPN R12E/K22D) tumours from two independent experiments; Kruskal-Wallis one-way ANOVA and Dunn’s post hoc test]. Source data are provided as a Source Data file.
Fig. 4
Fig. 4. SHANK3 depletion triggers RAS-MAPK pathway hyperactivation and apoptosis in KRAS-mutant cells.
a ERK activity in PANC-1 and A549 cells post SHANK3 silencing (3 days). Samples blotted on duplicate membranes, m#1 and m#2. SHANK3 mRNA levels (fold change) indicated below [mean ± s.d.; PANC-1, n = 8 (siCTRL), 5 (siSHANK3_2) or 6 (siSHANK3_7); A549, n = 5 (siCTRL) or 3 (siSHANK3_2 and siSHANK3_7) independent experiments; Kruskal-Wallis one-way ANOVA and Dunn’s post hoc tests]. b Confocal images of ERK-KTR-mRuby2-expressing siCTRL and siSHANK3 cells (nuclei outlined by yellow dashed lines). C/N, ERK-KTR-mRuby2 cytoplasmic/nuclear ratio [mean ± s.d.; n = 61 (siCTRL, 48 h), 38 (siSHANK3_7, 48 h), 185 (siCTRL, 72 h) or 59 (siSHANK3_7, 72 h) cells from three independent experiments; unpaired two-tailed Student’s t-test with Welch’s correction]. c Immunoblotting analysis of cleaved-PARP1 from 4a [mean ± s.d., normalized to siCTRL; PANC-1, n = 6 (siCTRL, siSHANK3_7) or 3 (siSHANK3_2); A549, n = 5 (siCTRL, siSHANK3_7) or 3 (siSHANK3_2) independent experiments; Kruskal-Wallis and Dunn’s post hoc tests]. d, e siSHANK3 PANC-1 cell death in 2D (annexin V-FITC flow cytometry analysis, d) and 3D (annexin-positive spheroid area, e) [mean ± s.d.; five independent experiments; unpaired two-tailed Student’s t-test with Welch’s correction (d); one-way ANOVA with Holm-Sidak’s multiple comparison test at endpoint (e)]. f Cleaved caspase-3-postive cells in siSHANK3 A549 tumours (CAM assay) (mean ± s.d.; n = 10 tumours from two independent experiments; two-tailed Mann–Whitney test; no/residual siSHANK3 PANC-1 tumours detected). g ERK activity in siSHANK3 PANC-1 cells ± MEK inhibitor (trametinib) (two independent experiments). h siSHANK3 PANC-1 cell proliferation (confluence % at day 5) ± trametinib (mean ± s.d; n = 4 technical replicates; representative of three independent experiments). i siSHANK3 PANC-1 cell proliferation ± 300 nM trametinib over time (mean ± s.e.m.; n = 4 technical replicates; representative of three independent experiments). j, k siSHANK3 PANC-1 cell viability ± selumetinib (MEK inhibitor) (j) or SCH772984 (ERK inhibitor) (k) [mean ± s.d; n = 4 (j, k siSHANK3) or 3 (k, siCTRL) technical replicates; representative of three independent experiments]. Source data are provided as a Source Data file.
Fig. 5
Fig. 5. SHANK3 depletion impairs the growth of pre-existing KRAS-mutant PDAC tumours.
a A schematic representation of the lentiviral vector for tetracycline/doxycycline (dox)-inducible synthesis of SHANK3 shRNA with a tRFP (TurboRFP) reporter for visual confirmation of shRNA expression following dox induction. 5’LTR, 5’long terminal repeat; Ψ, Psi packaging sequence; PuroR, puromycin resistance gene; 2a, self-cleaving peptide; WPRE, Woodchuck Hepatitis Post-transcriptional Regulatory Element; 3’ SIN LTR, 3’ Self-inactivating Long Terminal Repeat (see methods for more detail). b ERK activation kinetics in shSHANK3 KRAS-mutant cells. Representative immunoblots showing SHANK3, p-ERK and cleaved-PARP1 levels in control (-dox) and dox-induced (+dox) shSHANK3-expressing PANC-1 cells (mix of two independent clones) collected at different time points. GAPDH, loading control (n = three independent experiments). ce Analysis of the growth and viability of shSHANK3-expressing PANC-1 spheroids ± dox (dox added at day 5, when spheroids were established, and continued until day 15). Representative images show SHANK3 depletion as observed by the tRFP reporter and apoptotic Annexin V-positive cells (c). Quantification of spheroid growth over time (d), shaded region denotes sphere growth prior to treatment and cell viability at endpoint (e) (mean ± s.d. from n = 3 independent experiments; unpaired two-tailed Student’s t-test with Welch’s correction at endpoint). f, g Caspase-3 (f) and caspase-8 activity (g) in shSHANK3-expressing PANC-1 cells ± dox at the indicated time points (shown is normalized fluorescence intensity). Staurosporine used as a positive control (mean ± s.d.; n = 3 independent experiments; one-way ANOVA with Holm-Sidak’s multiple comparison test). h–l Analysis of the growth of established tumours in mice following SHANK3 depletion. h Outline of animal experiments. i Tumour volumes after starting the dox treatment (normalised to tumour volumes at the start of dox induction). j Representative IVIS images of the tRFP reporter expression in tumours 5 and 26 days after dox induction. k SHANK3 gene expression (mRNA levels) in tumours at the end of the experiment. l Tumour weights at the end of the experiment (26 days after dox-induction) (data represent individual tumours and the mean ± s.d.; n = 11 (-dox) and 12 (+dox) tumours; unpaired Student’s t-test with Welch’s correction). Source data are provided as a Source Data file.
Fig. 6
Fig. 6. Targeting of KRAS–SHANK3 interaction by anti-SHANK3 nanobodies induces apoptosis and inhibits KRAS-driven tumour growth.
ac The inhibitory function of anti-SHANK3 SPN nanobodies on KRAS–SHANK3 interaction. a The effect of two independent SHANK3 SPN nanobodies (A01 and E01) at the indicated concentration on the binding of His-tagged SHANK3 SPN to GST-tagged KRAS-GTP as measured by ELISA (data are mean ± s.d. of the Eu-signal; three independent experiments; Unpaired two-tailed Student’s t-test with Welch’s correction). b Top: The experimental outline showing His-SHANK3 SPN pulldown of GST-KRAS-GTP in the presence of anti-SHANK3 SPN nanobodies. Bottom: A representative blot showing loss of SHANK3–KRAS interaction in the presence of the nanobodies (n = 2 independent experiments). c Specificity analysis of anti-SHANK3 SPN nanobodies. A549 cells expressing mCherry alone (control; Ctrl) or mCherry-tagged anti-SHANK3 SPN nanobodies (A01, E01) were subjected to IP. A representative western blot, probed with the indicated antibodies is shown (n = 2 independent experiments). d, e, Analysis of cell viability in the presence of anti-SHANK3 nanobodies. Representative flow cytometry assay histograms (d) and quantification (e) of apoptosis (Annexin V-FITC-positive (+) cells) in PANC-1, A549 and H441 cells, expressing mCherry (Ctrl) or mCherry-tagged anti-SHANK3 SPN-nanobodies, 4 days after transfections [mean ± s.d.; n = 3 (PANC-1) and 4 (A549) independent experiments; two-way ANOVA and Sidak’s post hoc test; example scatter plots and gating strategy are shown in Supplementary Fig. 12]. f Analysis of tumour growth with HCT-116 cells transiently expressing mCherry-tagged anti-SHANK3 SPN nanobodies (A01 and E01) or mCherry (Ctrl) and inoculated on CAM membranes (data represent individual tumours and the mean ± s.d.; n = 18 (Ctrl, E01) or 21 (A01) tumours/treatment group; Kruskal-Wallis one-way ANOVA and Dunn’s post hoc test). g Schematic model of SHANK3-controlled cell fate in KRAS-mutant cancers. SHANK3 directly interacts with active KRAS and competes with RAF for KRAS binding to sustain oncogenic RAS-MAPK/ERK signalling at an optimal level (i.e. below toxic oncogenic signalling) in KRAS-mutant cancers. SHANK3 loss (1) or inhibition of SHANK3–KRAS interaction (2) drive KRAS-mutant cells into cell death. Source data are provided as a Source Data file.

References

    1. Prior, I. A., Hood, F. E. & Hartley, J. L. The frequency of ras mutations in cancer. Cancer Res.80, 2969–2974 (2020). 10.1158/0008-5472.CAN-19-3682 - DOI - PMC - PubMed
    1. Simanshu, D. K., Nissley, D. V. & McCormick, F. RAS proteins and their regulators in human disease. Cell170, 17–33 (2017). 10.1016/j.cell.2017.06.009 - DOI - PMC - PubMed
    1. DeStefanis, R. A., Kratz, J. D., Emmerich, P. B. & Deming, D. A. Targeted therapy in metastatic colorectal cancer: current standards and novel agents in review. Curr. Colorectal Cancer Rep.15, 61–69 (2019). 10.1007/s11888-019-00430-6 - DOI - PMC - PubMed
    1. Waters, A. M. & Der, C. J. KRAS: The critical driver and therapeutic target for pancreatic cancer. Cold Spring Harb. Perspect. Med.8, a031435 (2018). 10.1101/cshperspect.a031435 - DOI - PMC - PubMed
    1. Salgia, R., Pharaon, R., Mambetsariev, I., Nam, A. & Sattler, M. The improbable targeted therapy: KRAS as an emerging target in non-small cell lung cancer (NSCLC). Cell Rep. Med.2, 100186 (2021). 10.1016/j.xcrm.2020.100186 - DOI - PMC - PubMed

Publication types

Substances

LinkOut - more resources