. 2024 Sep 12;15(1):7982.
doi: 10.1038/s41467-024-52224-6.

Maf expression in B cells restricts reactive plasmablast and germinal center B cell expansion

Affiliations

Maf expression in B cells restricts reactive plasmablast and germinal center B cell expansion

Sophie Hillion et al. Nat Commun. .

Abstract

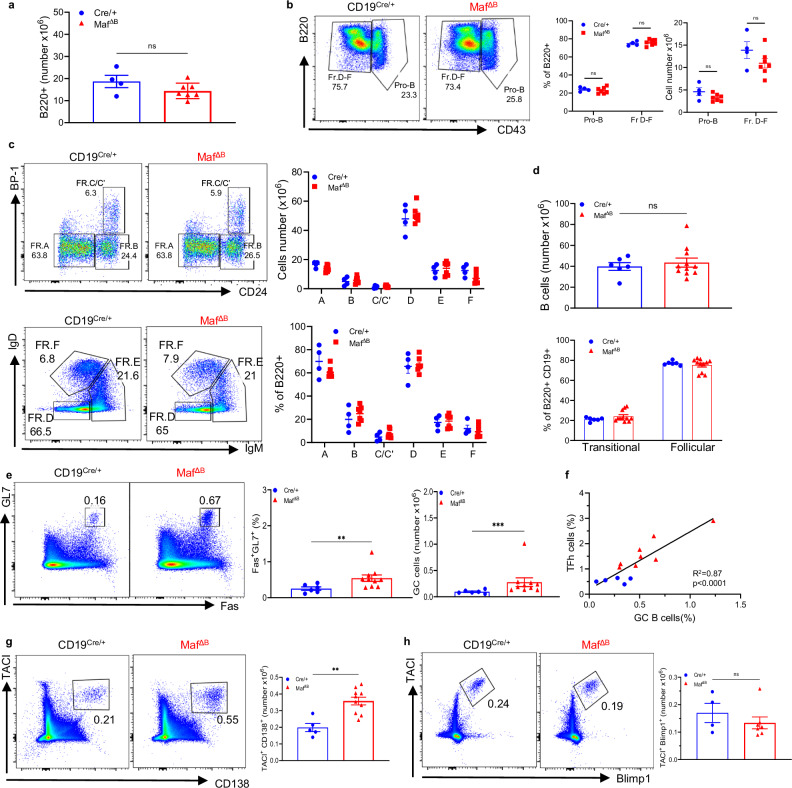
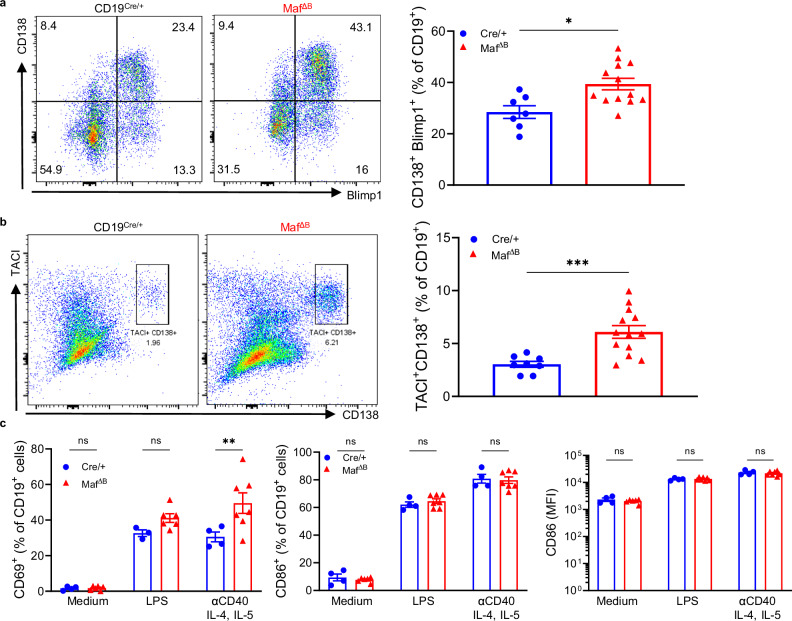
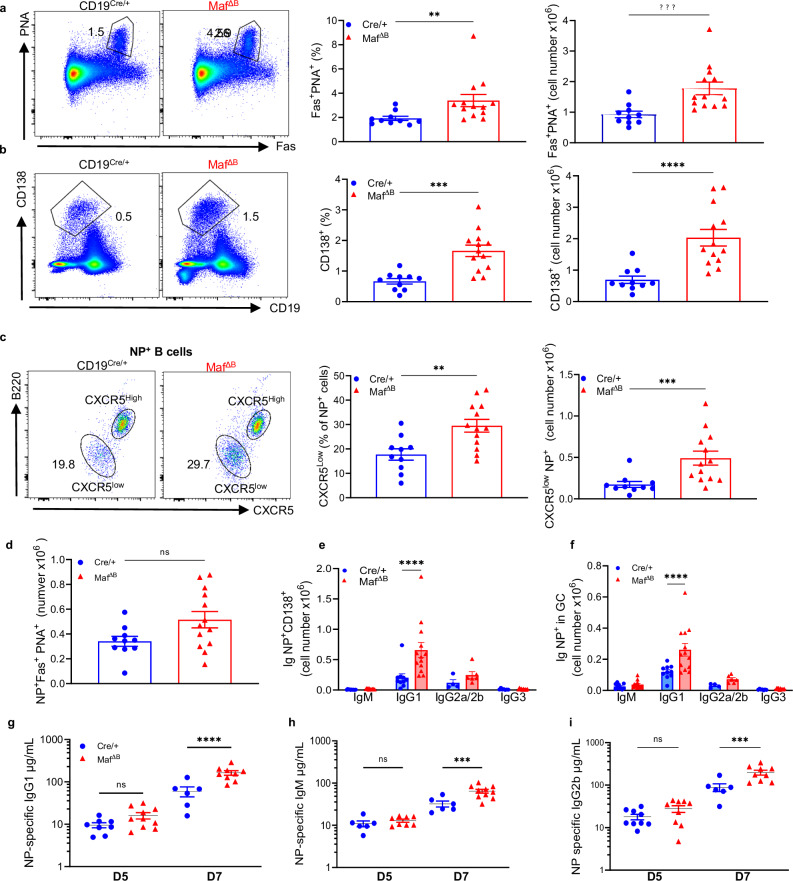
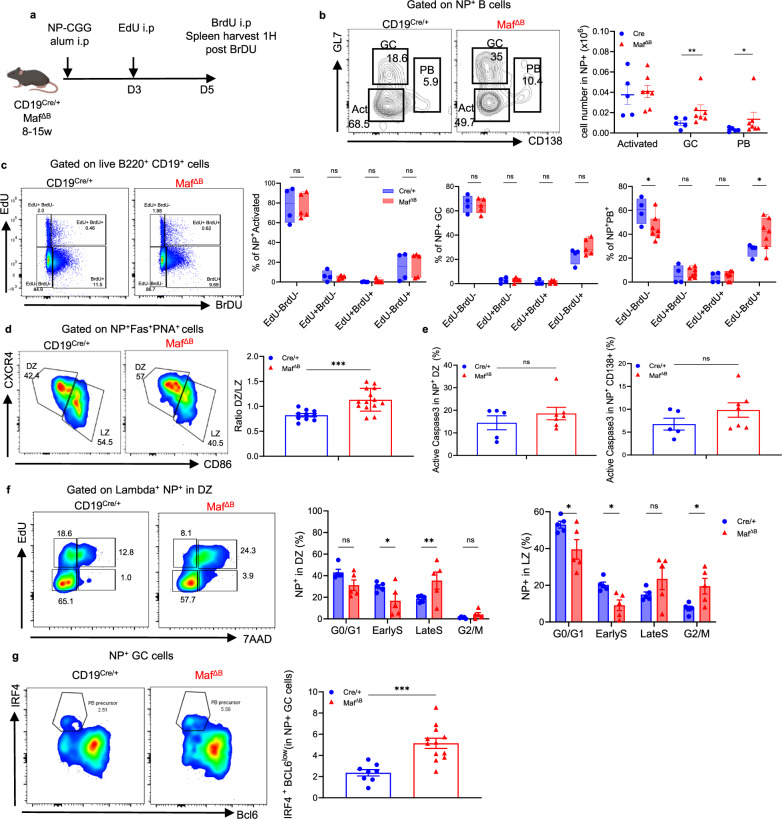
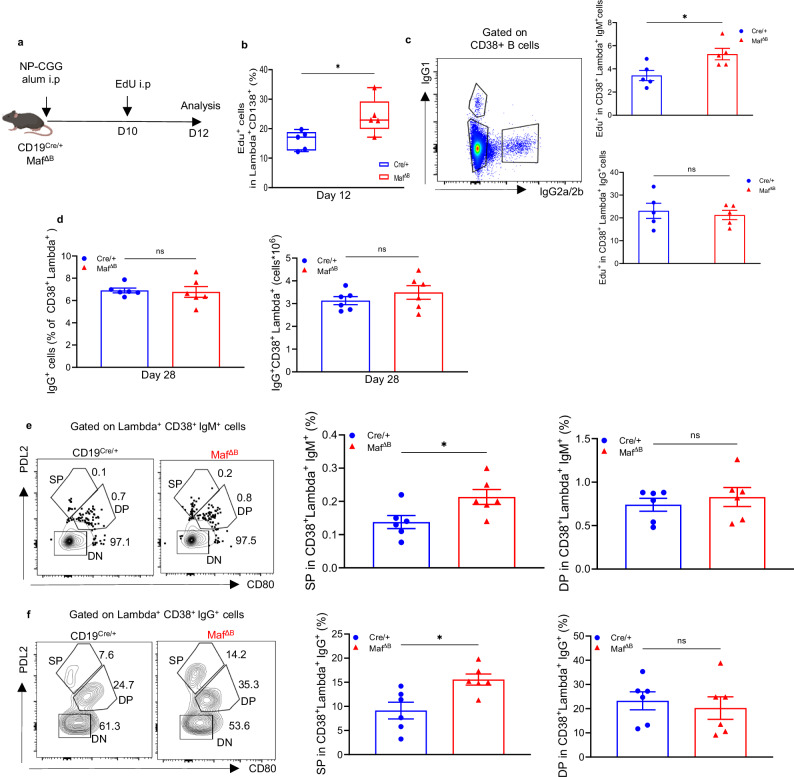
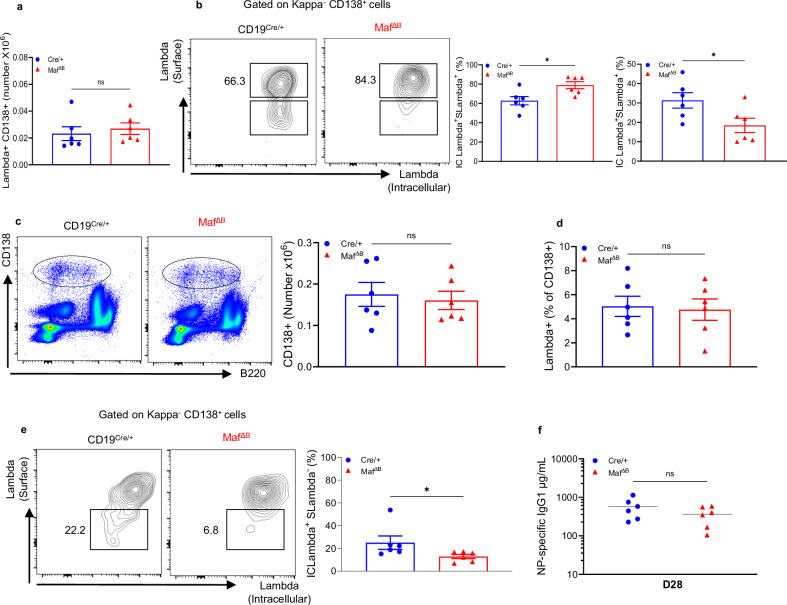
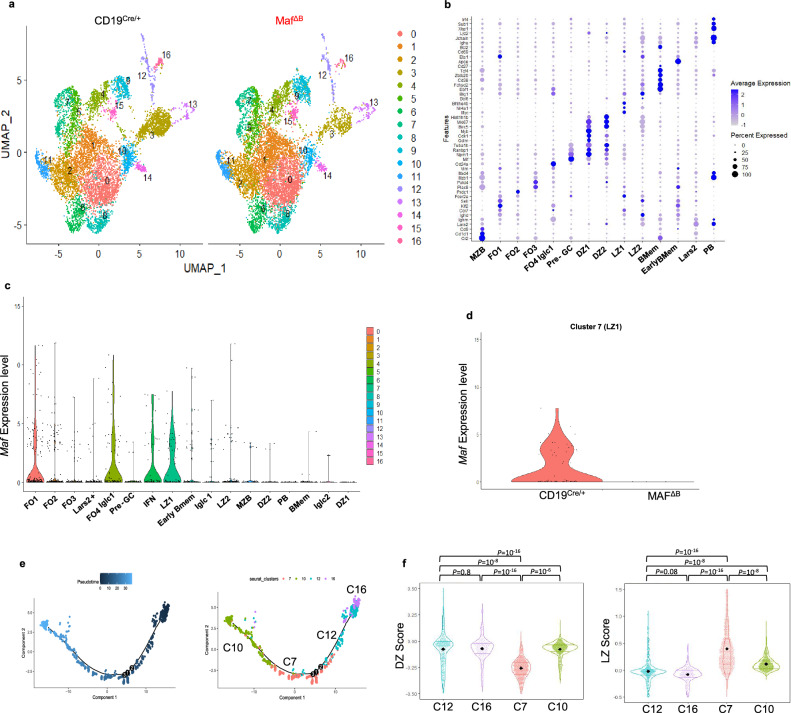
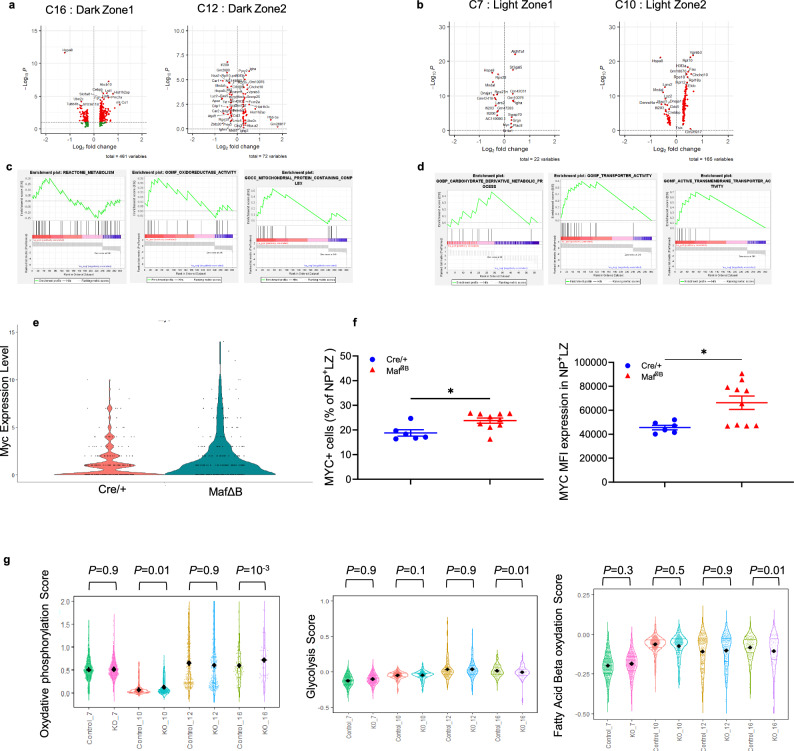
Precise regulation of B cell differentiation is essential for an effective adaptive immune response. Here, we show that B cell development in mice with B cell-specific Maf deletion is unaffected, but marginal zone B cells, germinal centre B cells, and plasmablasts are significantly more frequent in the spleen of naive Maf-deficient mice compared to wild type controls. In the context of a T cell-dependent immunization, Maf deletion causes increased proliferation of germinal centre B cells and extrafollicular plasmablasts. This is accompanied by higher production of antigen-specific IgG1 antibodies with minimal modification of early memory B cells, but a reduction in plasma cell numbers. Single-cell RNA sequencing shows upregulation of genes associated with DNA replication and cell cycle progression, confirming the role of Maf in cell proliferation. Subsequent pathway analysis reveals that Maf influences cellular metabolism, transporter activity, and mitochondrial proteins, which have been implicated in controlling the germinal centre reaction. In summary, our findings demonstrate that Maf acts intrinsically in B cells as a negative regulator of late B cell differentiation, plasmablast proliferation and germinal centre B cell formation.


Conflict of interest statement

The authors declare no competing interests.

Figures

Fig. 1
Fig. 1. Mice with Maf deficiency in B cells exhibit more MZ B cells, spontaneous GC B cells and PB cell numbers in the spleen.
Analysis of B cells from CD19Cre/+ (Cre+) and MafΔB naïve mice in bone marrow (ac, h, Cre+: N = 4; MafΔB: N = 7) and in spleen (d–g; Cre+: N = 5-6; MafΔB: N = 10-11). a Bar graphs showing total B220+ cell counts. b Pseudocolor plots and bar graphs illustrating pro-B cells and pre-B to mature recirculating B cells (Fr. D-F, as described in ref. )in percentages and total cell numbers c Pseudocolor plots illustrating the Hardy’s B cell fractions and bar graphs showing percentages and total cell numbers of the different cell fractions. d Bar graphs showing total (CD19+B220+) B cell numbers and percentages of Transitional (CD24highCD93high) and follicular (CD21+CD23+) B cells gated on CD19+B220+ B cells. e Pseudocolor plots gating germinal center (GC) B cells gated on B220+CD19+ B cells and bar graphs showing percentages (p = 0.008) and number (p = 0.0017) of total GC B cells. f Plot showing total number of GC B cells and number of follicular helper T cells (Tfh) (Cre+: N = 5; MafΔB: N = 8) and the coefficient and P value (p < 0.0001) from the Pearson correlation g Pseudocolor plots illustrating plasmablasts (PBs) gated on live cells and bar graphs showing total PB cell counts (p = 0.0027). h Pseudocolor plots illustrating antibody secreting cells (including both PBs and plasma cells) gated on live cells and bar graphs showing total antibody secreting cells counts. (p = 0.26) Data show mean ± SEM (ah). Statistical analysis: unpaired two-tailed Mann–Whitney tests (a, d, e, g, h) or ANOVA test using Tukey’s correction for multiple comparisons (b, c) *p < 0.05, **p < 0.01, ***p < 0.001, ns not significant. Source data are provided as a Source Data file.
Fig. 2
Fig. 2. In vitro stimulated B cells from MafΔB mice exhibit enhanced differentiation into plasmablasts.
Analysis of in vitro-stimulated B cells from CD19Cre/+ and MafΔB mice. a Pseudocolor plots and bar graphs showing percentages of CD138+Blimp1+ PB cells of CD19+ live cells after LPS stimulation (Cre+: N = 7; MafΔB: N = 13, p = 0.011). b Pseudocolor plots and bar graphs showing percentages of CD138+TACI+ PB cells of stimulated CD19+ live cells (Cre+: N = 8; MafΔB: N = 13, p = 0.0009). c Bar graphs showing percentages of CD69+ cells, of CD86+ cells, and CD86 mean fluorescence intensity (MFI) gated on live CD19+ B cells 3 days after stimulation. (Cre+: N = 3–4; MafΔB: N = 6-7). Data show mean ± SEM (ac). Statistical analysis: unpaired two-tailed Mann–Whitney tests (a, b) or one-way ANOVA test using Tukey’s correction for multiple comparisons (c). **p < 0.01, *** p < 0.001, ns not significant. Source data are provided as a Source Data file.
Fig. 3
Fig. 3. MafΔB mice mount stronger GC reaction and extrafollicular PB generation following T-dependent immunization.
B cell response to NP-CGG in CD19Cre/+ and MafΔB mice. a Pseudocolor plots of GC B cells according to PNA-binding and Fas expression gated on live B220+ B cells in spleen at day 7 after immunization with NP-CGG in alum; bar graphs showing percentages (of B220+ cells, p = 0.0015 and numbers of Fas+PNA+ GC B cells (p = 0.0005). b Pseudocolor plots of plasmablast (PB) gated on live cells; bar graphs showing total CD138+ PB and Fas+ PNA+ GC cell counts. c Pseudocolor plots of NP-specific extra-follicular (EF-PB) cells; bar graphs showing percentages (p = 0.0068) and total NP+ EF-PB cells (CXCR5low, p = 0.0006). d Bar graphs showing number of NP+(i.e., NP-binding) Fas+PNA+ GC B cells at day 7. e, f Bar graphs showing Ig isotype-positive cell numbers among NP+ CD138+ PB cells (p < 0.0001) e and GC B cells (p < 0.0001) f at day 7. Scatter dot plots showing serum NP-specific g IgG1(p < 0.0001) h IgM (p = 0.0008) and i IgG2b (p = 0.0006) antibodies measured at days 5 and 7 after immunization. ad: Cre+: N = 10; MafΔB: N = 13; ei Cre+: N = 4-10, MafΔB: N = 6–14. Data show mean ± SEM and Statistical analysis: unpaired two-tailed Mann–Whitney tests (ad) or ANOVA test using Tukey’s correction for multiple comparisons (ei). **p < 0.01, ***p < 0.001, ns not significant. Source data are provided as a Source Data file.
Fig. 4
Fig. 4. Maf regulates B cell proliferation in GC B cells and plasmablasts during T-dependent responses.
a Scheme of experiment. After immunization with NP-CGG-in alum, CD19Cre/+ (N = 4) and MafΔB mice (N = 5–7) were injected with EdU on day 3 and with BrdU on day 5 and were analyzed 1 h after the BrdU injection. b Countour plots illustrating NP-specific CD19+ B cells at day 5 post-immunization and bar graphs showing numbers of NP-specific activated, PB (p = 0.0088), and GC (p = 0.036) CD19+ B cells. c Pseudocolor plots of EdU and BrdU in B220+CD19+ B cells at day 5 post-immunization and bar graphs showing percentages of each EdU/BrdU subset in NP-binding activated, PB (Edu-BrdU-, p = 0.0107; Edu-BrdU+, p = 0.0123) and GC B cells. d Pseudocolor plots illustrating NP+ (i.e., NP-binding) Fas+PNA+ GC B cells at day 7 post-immunization. Bar graphs showing the ratio of the number of dark zone (DZ), and light zone (LZ, Cre+: N = 10; MafΔB: N = 14, p = 0.0005. e Bar graphs showing percentages of active caspase 3 positive cells in NP+ DZ cells and CD138+ PBs at day 7 post-immunization. Cre+: N = 5; MafΔB: N = 7. f CD19Cre/+ and MafΔB mice were immunized with NP-CGG in alum and, after 10 days, mice were injected with EdU and analyzed 1h thereafter. Pseudocolor plots illustrating CD19+NP+ GC DZ B cells and bar graphs showing cells in G0/G1 (EdU7AAD, NP+LZ, p = 0.016), early S phase (EdU+7AAD, NP+DZ, p = 0.038; NP+LZ, p = 0.032), late S phase (EdU+7AAD+), NP+DZ, p = 0.0082), and G2/M (EdU7AAD+, NP+LZ, p = 0.02) among NP-specific DZ and LZ B cells. Cre+: N = 5; MafΔB: N = 5. g Dot plots of NP+ GC B cells (gated as CD19+ B220+CD38lowGL7+) at day 12 post-immunization with NP-CGG in alum and bar graphs showing percentages of IRF4+BCL6low PB precursor cells among NP-specific GC B cells. Cre+: N = 8; MafΔB: N = 12, p = 0.0003. Bar graphs represent mean ± SEM (b, dg) and box plots indicate median (middle line), 25th, 75th percentile (box) and min/max (whiskers). Statistical analysis: unpaired two-tailed Mann–Whitney tests and ANOVA using Fisher’s Least Significant Difference (LSD) test for multiple comparisons. *p < 0.05, **p < 0.01, ***p < 0.001, ns not significant. Source data are provided as a Source Data file.
Fig. 5
Fig. 5. Maf does not contribute to B cell memory formation.
Analysis of memory B cell response to NP-CGG in CD19Cre/+ and MafΔB at day 12 (ac, Cre+: N = 5; MafΔB: N = 5) and day 28 post-immunization (df, Cre+: N = 6; MafΔB: N = 6). a Mice were immunized i.p with NP-CGG in alum. On day 10 after immunization, mice were injected i.p with EdU and then analyzed on days 12 and 28 after immunization. b Box plots showing percentages of EdU+ cells among NP-binding CD138+lambda+ cells (p = 0.039) c Pseudocolor plots illustrating CD38+ non-GC B cells and bar graphs showing percentages of EdU+ cells in CD38+IgG- B cells (p = 0.031) and CD38+IgG+ (including IgG1 and IgG2a/b, p = 0.73) B cells. d Box plots showing percentages of IgG+ cells (including IgG1 and IgG2a/b, p = 0.48) in CD38+lambda+ B cells and IgG+CD38+lambda+ B cell numbers (p = 0.48). e Dot/countour plots illustrating CD38+lambda+IgG- B cells and bar graphs showing percentages of single-positive (SP, CD80PDL2+, p = 0.04) and double-positive (DP, CD80+PDL2+, p = 0.36) subsets in CD38+lambda+IgM+ B cells. f Countour plots of CD38+lambda+IgG+ (IgG1 and IgG2a/b) B cells and bar graphs showing percentages of CD80/PDL2 SP (p = 0.01) and DP subsets (p = 0.56) in CD38+lambda+IgG+ B cells. Bar graphs represent mean ± SEM (cf) and box plots indicate median (middle line), 25th, 75th percentile (box) and min/max (whiskers). Statistical analysis: unpaired two-tailed Mann–Whitney tests. *p < 0.05, **p < 0.01, ***p < 0.001, ns not significant. Source data are provided as a Source Data file.
Fig. 6
Fig. 6. MafΔB mice generate reduced numbers of long-lived plasma cells.
Analysis of plasma cells in response to NP-CGG immunization. CD19Cre/+ (N = 6) and MafΔB (N = 6) mice were immunized i.p with NP-CGG in alum and analyzed 28 days after immunization. a Bar graphs showing total number of NP-specific lambda+CD138+ cells in spleen (p = 0.3). b Dot plots illustrating kappaCD138+ ASCs in spleen according to surface (S) and intracellular (IC) lambda expression and bar graphs showing percentage of Slambda+ IClambda+ cells (p = 0.015) and of surface SlambdaIClambda+ (p = 0.041) cells among kappaCD138+ cells of spleen. c Pseudocolor plots illustrating CD138+ bone marrow (BM) cells and bar graphs showing total cell numbers in BM (p = 0.5). d Bar graphs showing percentage of lambda+ cells in the CD138+ compartment of BM (p = 0.9). e Countour plots illustrating kappaCD138+ cells in BM bar graphs showing percentages of SlambdaIClambda+ cells (p = 0.017) among kappaCD138+ cells in BM. f Distribution of serum NP-specific IgG1 antibodies (p = 0.3). Data show mean ± SEM (af). Statistical analysis: unpaired two-tailed Mann–Whitney tests. *p < 0.05, **p < 0.01, ns not significant. Source data are provided as a Source Data file.
Fig. 7
Fig. 7. Single cell RNAseq analysis of B cells responding to NP-CGG immunization.
CD19Cre/+ and MafΔB mice were immunized i.p with NP-CGG in alum. Seven days after immunization, splenic B cells were isolated using negative selection. ScRNAseq was performed on B cells pooled from two individual mice of each strain. a UMAP projections of scRNA-seq profiles of 16,904 B cells from the two groups of mice. Clusters in the UMAP plots are color coded according to different cell populations. b Mean expression of selected marker genes in each B cell cluster. Color intensity denotes average gene expression, whereas dot size represents the percentage of cells expressing the gene. c Violin plots of Maf gene expression in cells of each cluster in integrated data. d Violin plot of Maf expression in cluster 7 (LZ1) of CD19Cre/+ and MafΔB mice. e Pseudotime analysis of GC B cell clusters trajectories analyzed using Slingshot R package. Analysis was performed on B cells in clusters C7, C10, C12 and C16. f Violin plots of the distribution of dark zone (DZ) and light zone (LZ) gene signature scores (based on ref. , Supplementary Data 1) in clusters 7, 10, 12 and 16. Statistical analysis: ANOVA test using Tukey’s correction for multiple comparisons.
Fig. 8
Fig. 8. Pathway analysis uncovers distinct expression dynamics of OXPHOS metabolism in Maf-deficient GC and PB clusters.
a, b Volcano plot of upregulated or downregulated genes in MafΔB B cells relative to control B cells in indicated clusters. The red color identifies genes with a fold change >1.2 and a p.value < 0.05. c, d GSEA analysis using ranked genes list of Differential expressed genes (DEG) from the dark zone (DZ; Clusters 16, DZ1 and 12, DZ2) and light zone (LZ; Clusters 7, LZ1 and 10, LZ2). e Violin plots of the distribution of Myc expression in cluster 7 (LZ1) of CD19Cre/+ (Control, red, N = 2) and MafΔB (KO, green, N = 2) B cells. f Percentages (left, p = 0.02) and MFI (right, p = 0.03) of Myc expressing cells among LZ antigen-specific GC B cells of indicated mice (gated as NP+CD86+CXCR4lowCD38lowFas+) assessed by flow cytometry. g Violin plots of the distribution of OXPHOS, glycolysis and Fatty acid Beta oxidation signature scores in GC clusters (C7: LZ1, C10: LZ2, C12: DZ2 and C16: DZ1) of CD19Cre/+ (Control) and MafΔB (KO) B cells. f Statistical analysis: unpaired two-tailed Mann–Whitney tests. *p < 0.05, ns not significant or ANOVA test using Tukey’s correction for multiple comparisons. DEG were calculated using Wilcoxon Rank Sum Test with Benjamini-Hochberg (BH) procedure to adjust p-values. Source data are provided as a Source Data file.

References

    1. Blank, V. & Andrews, N. C. The Maf transcription factors: regulators of differentiation. Trends Biochem. Sci.22, 437–441 (1997). 10.1016/S0968-0004(97)01105-5 - DOI - PubMed
    1. Ring, B. Z. et al. Regulation of mouse lens fiber cell development and differentiation by the Maf gene. Development127, 307–317 (2000). 10.1242/dev.127.2.307 - DOI - PubMed
    1. Kim, J. I. et al. The transcription factor c-Maf controls the production of interleukin-4 but not other Th2 cytokines. Immunity10, 745–751 (1999). 10.1016/S1074-7613(00)80073-4 - DOI - PubMed
    1. Chihara, N. et al. Induction and transcriptional regulation of the co-inhibitory gene module in T cells. Nature558, 454–459 (2018). 10.1038/s41586-018-0206-z - DOI - PMC - PubMed
    1. Liu, M. et al. Transcription factor c-Maf is a checkpoint that programs macrophages in lung cancer. J. Clin. Invest130, 2081–2096 (2020). 10.1172/JCI131335 - DOI - PMC - PubMed

Publication types

MeSH terms

LinkOut - more resources