. 2024 Sep 12;15(1):7940.
doi: 10.1038/s41467-024-51827-3.

A metabolic crosstalk between liposarcoma and muscle sustains tumor growth

Affiliations

A metabolic crosstalk between liposarcoma and muscle sustains tumor growth

Gabrielle Manteaux et al. Nat Commun. .

Abstract

Dedifferentiated and Well-differentiated liposarcoma are characterized by a systematic amplification of the Murine Double Minute 2 (MDM2) oncogene. We demonstrate that p53-independent metabolic functions of chromatin-bound MDM2 are exacerbated in liposarcoma and mediate an addiction to serine metabolism to sustain tumor growth. However, the origin of exogenous serine remains unclear. Here, we show that elevated serine levels in mice harboring liposarcoma-patient derived xenograft, released by distant muscle is essential for liposarcoma cell survival. Repressing interleukine-6 expression, or treating liposarcoma cells with Food and Drugs Administration (FDA) approved anti-interleukine-6 monoclonal antibody, decreases de novo serine synthesis in muscle, impairs proliferation, and increases cell death in vitro and in vivo. This work reveals a metabolic crosstalk between muscle and liposarcoma tumor and identifies anti-interleukine-6 as a plausible treatment for liposarcoma patients.


Conflict of interest statement

L.K.L., N.F., and G.M. are inventors on patent application no. 21 306099.9 submitted by ICM that covers “methods for the treatment of cancer”. All other authors declare that they have no competing interests.

Figures

Fig. 1
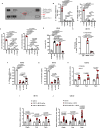
Fig. 1. Liposarcoma reprogram serine synthesis pathway in muscles.
A Normalized RNASeq reads of MDM2. (n = 5 normal fat tissues, 5 lipoma and 38 liposarcoma tumors). B Serine and C Glycine levels (μM) measured by HPLC, in nude mice before and 28 days post-engraftment of liposarcoma cells (IB115). Mice were treated daily with placebo or SP141 (40 mg/ml). (n = 3 experimental replicates). D Serine levels (μM) measured by HPLC. Control mice were compared to liposarcoma PDX Mice (LPS-PDX). Mice were treated daily with placebo or SP141 (40 mg/ml). (n = 5 animals/group). E Stable isotope tracing experiments in IB115 cells treated cultured for 48 h in the presence of uniformly labeled [U-13C]Glu and [U-13C]Ser in -Ser/Gly medium. LC-MS was used to detect the relative amount of the 13C-labeled m + 3 isotopolog of intracellular serine. (n = 3 experimental replicates). F Real-time qPCR analysis performed on LPS-PDX and control mice muscle, evaluating expression of serine synthesis pathway genes: Phgdh, Psat1 and Psph. Mice were treated daily with placebo or SP141 (40 mg/ml). (n= 6 animals/group). G Real-time qPCR analysis performed on LPS-PDX and control mice liver, evaluating expression of serine synthesis pathway genes: Phgdh, Psat1 and Psph. Mice were treated daily with placebo or SP141 (40 mg/ml). (n = 5 animals/group). H Real-time qPCR analysis performed control mice liver, evaluating expression of serine synthesis pathway genes: Phgdh, Psat1 and Psph. Mice were fed with normal or -Ser/Gly diet. (n = 3 experimental replicates). I Real-time qPCR analysis performed on control mice muscle, evaluating expression of serine synthesis pathway genes: Phgdh, Psat1 and Psph. Mice were fed with normal or -Ser/Gly diet. (n = 3 experimental replicates). J Real-time qPCR analysis performed on LPS-, Leiomyosarcoma- and Breast cancer-PDXs compared to control mice muscle, evaluating expression of serine synthesis pathway genes: Phgdh, Psat1 and Psph. (n = 5 animals/group). Data are shown as means ± SEM and three or more independent experiments were performed. Statistical tests were all adjusted for multiple comparisons and included two-tailed unpaired t-test for (e, h, i), one-way analysis of variance (ANOVA) for a, b, c, d, f, g and j. *P < 0.05, **P < 0.01, ***<0.001, n.s = non-significant. Source data are provided as a Source Data file.
Fig. 2
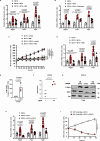
Fig. 2. Liposarcoma needs muscle reprogramming to sustain proliferation.
A Real-time qPCR analysis performed on C2C12 cocultured with IB115 cells (ratio 1:2), evaluating expression of serine synthesis pathway genes: Phgdh, Psat1, and Psph. (n = 3 experimental replicates). B Real-time qPCR analysis performed on C2C12 or BMEL murine cells cocultured with IB115 cells (ratio 1:2), evaluating expression of serine synthesis pathway genes: Phgdh, Psat1, and Psph. (n = 3 experimental replicates). C Real-time qPCR analysis performed on C2C12 cells incubated 16 h with IB115 conditioned media, evaluating the expression of serine synthesis pathway genes: Phgdh, Psat1 and Psph. (n = 9 experimental replicates). D Luciferase assay performed on C2C12 cells incubated 16 h with IB115 conditioned media, evaluating relative luciferase activity of Phgdh and Psat1 reporter. (n =  4 experimental replicates). E Real-time qPCR analysis performed on C2C12 cells after shScr or shMdm2 cocultured with IB115 cells (ratio 1:2), evaluating the expression of serine synthesis pathway genes: Phgdh, Psat1 and Psph. (n = 8 experimental replicates). F Real-time qPCR analysis performed on C2C12 cells after shScr or shAtf4 cocultured with IB115 cells (ratio 1:2), evaluating the expression of serine synthesis pathway genes: Phgdh, Psat1, and Psph. (n = 6 experimental replicates). G Serine levels (μM) measured by HPLC in C2C12 grown in Complete DMEM alone or incubated with IB115 or HPAC CM. (n = 3 experimental replicates). H Stable isotope tracing experiments performed in C2C12 cells cocultured with IB111 for 36 hours. Then, cells were cultured for the last 12 or 24 hours in the presence of uniformly labeled [U-13C]Glu. LC-MS was used to detect the mean enrichments of 13C-labeled (m + 3) isotopologs detected in intracellular serine that derive from 13C-labeled glucose. (n = 3 experimental replicates). I Stable isotope tracing experiments performed in C2C12 cells cocultured with IB111 for 36 hours. Then, cells were cultured for the last 12 or 24 hours in the presence of uniformly labeled [U-13C]Glu. LC-MS was used to detect the mean enrichments of 13C-labeled (m + 3) isotopologs detected in extracellular serine that derive from 13C-labeled glucose. (n = 3 experimental replicates). J Proliferation assay was performed on IB115 cells grown in media supplemented with or without Serine and Glycine and cocultured with C2C12 cells. (n = 3 experimental replicates). K Crystal violet quantification and representative photographs of IB111 cells grown in media without Serine and Glycine and supplemented with C2C12 or HPAC CM for 5 days. (n = 6 experimental replicates). L Psat1 and Psph protein expression assessed by immunoblot in C2C12 supplemented or not with IB115 or HPAC CM. Tubulin was used as the loading control. M End point of proliferation assay performed on IB115 cells grown in media without Serine and Glycine and cocultured with C2C12 cells after shScr, shPhgdh, or shPsat1 knockdown. (n = 3 experimental replicates). Data are shown as means ± SEM and three or more independent experiments were performed. Statistical tests were all adjusted for multiple comparisons and included two-tailed unpaired t-test for (a, c, d), one-way (b, e, f, g, k, m), and two-way analysis of variance (ANOVA) for h, i and j. *P < 0.05, **P < 0.01, ***<0.001, n.s = non-significant. Source data are provided as a Source Data file.
Fig. 3
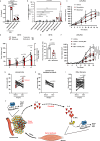
Fig. 3. Liposarcoma-released IL-6 reprograms distant muscles.
A Proteome Profiler Human Cytokine Array. B Real-time qPCR analysis of IL-6 mRNA level of different cancer cell lines, SKOV3, HPAC, ZR-75.1, CFPAC-1, including LPS cell lines, IB115 and IB111. (n = 3 experimental replicates). C IL6 concentration (ng/ml), measured by ELISA, of different cancer cell lines, SKOV3, HPAC, ZR-75.1, CFPAC-1, including LPS cell lines, IB115 and IB111. (n = 3 experimental replicates). D End point of proliferation assay performed on XG-6 cells grown in media supplemented with the vehicle, recombinant IL-6, IB115, IB111, or MCF7 conditioned media. (n = 3 experimental replicates). E qChIP experiments showing the relative amounts of MDM2 and ATF4 on the IL-6 promoter in IB115 cells. Results were represented as the relative ratio between the mean value of immunoprecipitated chromatin (calculated as a percentage of the input) with the indicated antibodies and one control irrelevant antibody. (n = 3 experimental replicates). F Real-time qPCR analysis of IL-6 mRNA level in IB115 cells after shScr, shMdm2, shAtf4 or shIL-6 lentiviral infection, puromycin selection (48 h, 2μg/mL). (n = 3 experimental replicates). G IL6 concentration (ng/ml), measured by ELISA, of IB115 cells after shScr, shMdm2, shAtf4 or shIL-6 lentiviral infection, puromycin selection (48 h, 2μg/mL). (n = 3 experimental replicates). H Real-time qPCR analysis performed on C2C12 cells grown in media supplemented with vehicle or recombinant IL6 (50 pg/mL), evaluating the expression of serine synthesis pathway genes: Phgdh, Psat1, and Psph. (n = 8 experimental replicates). I, Real-time qPCR analysis performed on IB115 cells after shScr or shIL-6 cocultured with C2C12 cells (ratio 1:2), evaluating the expression of serine synthesis pathway genes: Phgdh, Psat1, and Psph. (n = 3 experimental replicates). J, Real-time qPCR analysis performed on C2C12 cells after shScr or shIL-6Rα cocultured with IB115 cells (ratio 1:2), evaluating the expression of serine synthesis pathway genes: Phgdh, Psat1, and Psph. (n = 13 experimental replicates). Data are shown as means ± SEM and three or more independent experiments were performed. Statistical tests were all adjusted for multiple comparisons and included two-tailed unpaired t-test for (h), one-way analysis of variance (ANOVA) for b, c, d, e, f, g, I, and j. *P < 0.05, **P < 0.01, ***<0.001, n.s non-significant. Source data are provided as a Source Data file.
Fig. 4
Fig. 4. Targeting IL-6/STAT3 pathway impairs liposarcoma proliferation.
Real-time qPCR analysis performed on C2C12 cells alone or cocultured with IB115 cells supplemented with vehicle, anti IL-6 (BE8) A, or Siltuximab B, evaluating expression of serine synthesis pathway genes: Phgdh, Psat1 and Psph. (A n = 15, B n = 6, experimental replicates). C, Proliferation assay performed on IB115 cells alone or cocultured with C2C12 cells grown in media without Serine and Glycine and supplemented with vehicle or anti IL-6 (BE8). (n = 3 experimental replicates). D, Real-time qPCR analysis performed on C2C12 cells alone or cocultured with IB115 cells supplemented with vehicle or GP130 inhibitor (BZA), evaluating expression of serine synthesis pathway genes: Phgdh, Psat1 and Psph. (n = 15 experimental replicates). E qChIP experiments showing the relative amounts of mono-methylation of lysine 9 of histone H3 (H3K9Me1) on the Psat1 promoter in C2C12 treated or not with recombinant IL-6. Results were represented as the relative ratio between the mean value of immunoprecipitated chromatin (calculated as a percentage of the input) with the indicated antibodies and a control irrelevant antibody. (n = 3 experimental replicates). F NAD+/NADH ratio in C2C12 treated or not with recombinant IL-6. (n = 3 experimental replicates). G STAT3, and P-STAT3 protein expression assessed by immunoblot in C2C12 cells incubated 16 h with recombinant IL-6, IB115, or HPAC conditioned media. Tubulin was used as the loading control. H Real-time qPCR analysis performed on C2C12 cells alone or cocultured with IB115 cells (ratio 1:2) supplemented with vehicle or STAT3 inhibitor, evaluating expression of serine synthesis pathway genes: Phgdh, Psat1, and Psph. (n = 15 experimental replicates). I Proliferation assay performed on IB115 cells grown in media without Serine and Glycine and cocultured with C2C12 cells treated or not with STAT3 inhibitor. (n = 3 experimental replicates). Data are shown as means ± SEM and three or more independent experiments were performed. Statistical tests were all adjusted for multiple comparisons and included two-tailed unpaired t-test for (e, f), one-way (a, b, d, h) and two-way analysis of variance (ANOVA) for c and i. *P < 0.05, **P < 0.01, ***<0.001, n.s. non-significant. Source data are provided as a Source Data file.
Fig. 5
Fig. 5. IL-6 inhibition as a new therapy in liposarcoma.
A IL6 concentration (ng/ml), measured by ELISA. Control mice were compared to Liposarcoma, Leiomyosarcoma and Breast cancer PDX Mice. (n = 3 independent experiments). B Real-time qPCR analysis of IL-6 mRNA level in frozen patient samples from different sarcoma subtypes (Adenocarcinoma n = 2, angiosarcoma n = 1, carcinosarcoma n = 3, leiomyosarcoma n = 10, myxoid-liposarcoma n = 7, myxofibrosarcoma n = 7, WDLPS n = 9, DD-LPS n = 3). C Tumor growth curves from patient liposarcoma subcutaneously implanted in nude mice treated or not with Siltuximab (10 mg/kg) or doxorubicine (2 mg/kg) by IP twice weekly. Tumor volume was assessed at the indicated timepoints using caliper measurements. (n  = 6 animals/group). D Tumor growth curves from IB115 LPS cell lines subcutaneously implanted in nude mice treated or not with Siltuximab (10 mg/kg) by IV daily. Tumor volume was assessed at the indicated timepoints using caliper measurements (n = 3 animals/group). E, IL-6 expression assessed by immunofluorescence performed from IB115 LPS tumors treated or not with Siltuximab (10 mg/kg) by IP twice weekly. (n = 6 samples/group). F, Tumor growth curves from patient liposarcoma tumor subcutaneously implanted in nude mice, fed a normal or a no Serine/Glycine diet and treated or not with anti-IL-6, BE8 (10 mg/kg) by IP twice weekly after tumor volume reached approximately 150mm3. Tumor volume was assessed at the indicated timepoints using caliper measurements (n = 3 experimental replicates with 6 animals/group). Quantification of serum Serine levels (mM) from Liposarcoma patients (n = 21 samples/group) G, from Liposarcoma patients (relapsed patients excluded); (n = 15 samples/group) H before and 30 days after surgery, using liquid chromatography-high resolution mass spectrometry (LC/HRMS). Relapsed patients were highlighted in red. I Quantification of serum Serine levels (mM) from Sarcoma patients before and 30 days after surgery, using liquid chromatography-high resolution mass spectrometry (LC/HRMS). (n = 38 samples/group). J Schematic representing the crosstalk between liposarcoma and muscle initiated through IL-6/STAT3 pathway activation. Data are shown as means ± SEM and three or more independent experiments were performed. Statistical tests were all adjusted for multiple comparisons and included two-tailed unpaired t-test for (e), one-way (a, b), two-way analysis of variance (ANOVA) (c, d, f) and two-tailed paired and non-parametric Wilcoxon test for g, h and i. *P < 0.05, **P < 0.01, ***<0.001, n.s non-significant. Source data are provided as a Source Data file.

References

    1. Mastrangelo, G. et al. Incidence of soft tissue sarcoma and beyond: a population-based prospective study in 3 European regions. Cancer118, 5339–5348 (2012). 10.1002/cncr.27555 - DOI - PubMed
    1. Verweij, J. & Baker, L. H. Future treatment of soft tissue sarcomas will be driven by histological subtype and molecular aberrations. Eur. J. Cancer Oxf. Engl. 199046, 863–868 (2010). - PubMed
    1. Ducimetière, F. et al. Incidence of sarcoma histotypes and molecular subtypes in a prospective epidemiological study with central pathology review and molecular testing. PloS One6, e20294 (2011). 10.1371/journal.pone.0020294 - DOI - PMC - PubMed
    1. ESMO/European Sarcoma Network Working Group Soft tissue and visceral sarcomas: ESMO Clinical Practice Guidelines for diagnosis, treatment and follow-up. Ann. Oncol. J. Eur. Soc. Med. Oncol.25, iii102–iii112 (2014). 10.1093/annonc/mdu254 - DOI - PubMed
    1. Singer, S., Antonescu, C. R., Riedel, E. & Brennan, M. F. Histologic subtype and margin of resection predict pattern of recurrence and survival for Retroperitoneal Liposarcoma. Ann. Surg.238, 358–371 (2003). 10.1097/01.sla.0000086542.11899.38 - DOI - PMC - PubMed

Publication types

Associated data