. 2024 Sep 12;15(1):7991.
doi: 10.1038/s41467-024-52258-w.

Adipocyte inflammation is the primary driver of hepatic insulin resistance in a human iPSC-based microphysiological system

Affiliations

Adipocyte inflammation is the primary driver of hepatic insulin resistance in a human iPSC-based microphysiological system

Lin Qi et al. Nat Commun. .

Abstract

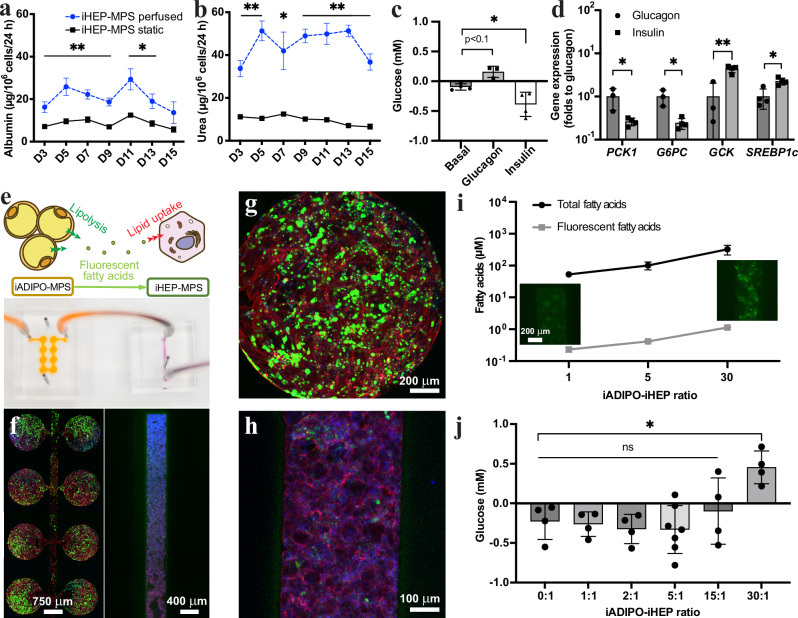
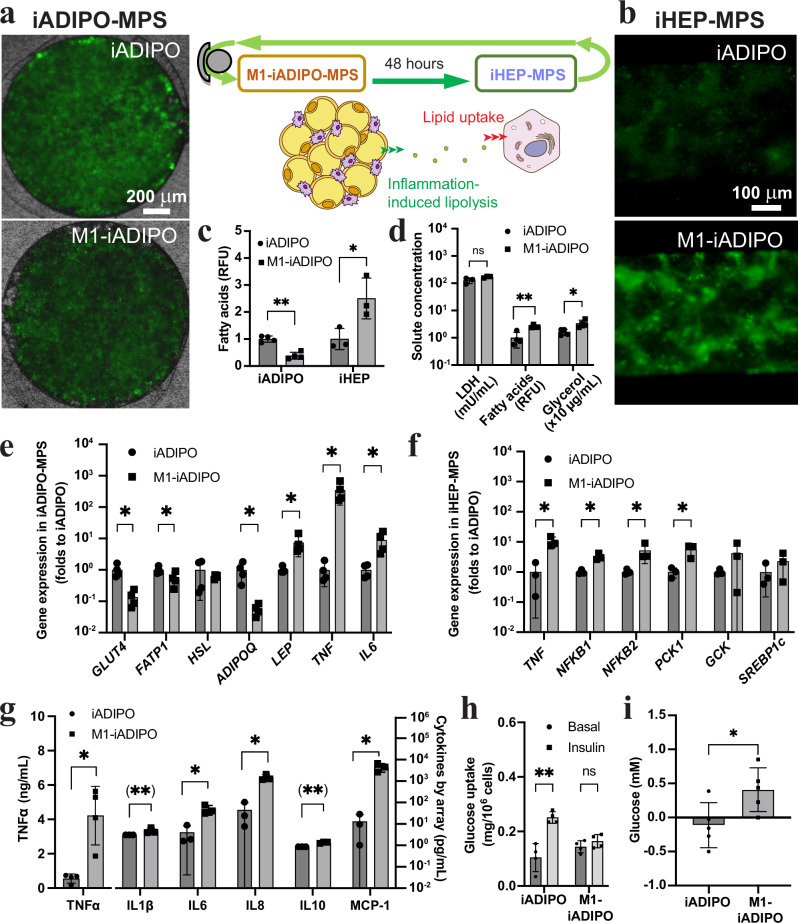
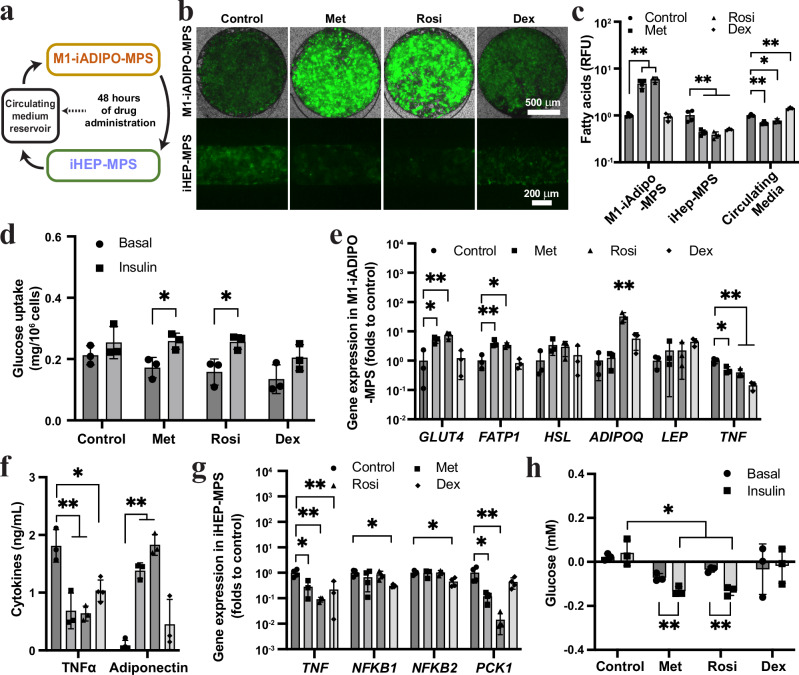
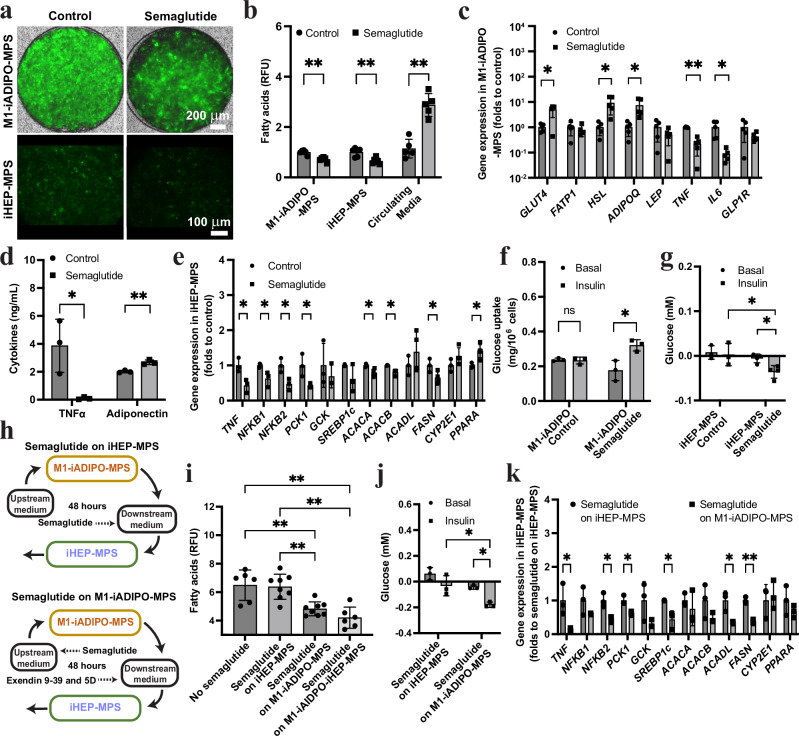
Interactions between adipose tissue, liver and immune system are at the center of metabolic dysfunction-associated steatotic liver disease and type 2 diabetes. To address the need for an accurate in vitro model, we establish an interconnected microphysiological system (MPS) containing white adipocytes, hepatocytes and proinflammatory macrophages derived from isogenic human induced pluripotent stem cells. Using this MPS, we find that increasing the adipocyte-to-hepatocyte ratio moderately affects hepatocyte function, whereas macrophage-induced adipocyte inflammation causes lipid accumulation in hepatocytes and MPS-wide insulin resistance, corresponding to initiation of metabolic dysfunction-associated steatotic liver disease. We also use our MPS to identify and characterize pharmacological intervention strategies for hepatic steatosis and systemic insulin resistance and find that the glucagon-like peptide-1 receptor agonist semaglutide improves hepatocyte function by acting specifically on adipocytes. These results establish our MPS modeling the adipose tissue-liver axis as an alternative to animal models for mechanistic studies or drug discovery in metabolic diseases.


Conflict of interest statement

The authors declare no competing interests.

Figures

Fig. 1
Fig. 1. Interconnection and scaling of iHEP-MPS and iADIPO-MPS.
a, b Albumin (a) and urea (b) in media of iHEP-MPS under perfused (blue dashed line) and static (black solid line) conditions for 15 days. n = 14, 12, 12, 14, 5, 10, 5 in the perfused conditions and n = 13, 14, 14, 11, 5, 11, 7 in the static conditions for D3-D15 in (a). n = 3 in all conditions in (b). n referring to media collected from both conditions. p-values were calculated by unpaired two-tailed t-tests for the comparison of perfused vs static each day. c, d Glucose in media (c) (n = 4 for Basal, Insulin; n = 3 for Glucagon) and metabolic gene expression in iHEPs (d) (n = 4 except n = 3 for Glucagon PCK1, G6PC, GCK) of iHEP-MPS after 1 h hormonal stimulation. n referring to media in (c) and MPS in (d). p-values were calculated by one-way ANOVA followed by Tukey’s test in (c) and by unpaired two-tailed t-tests in (d). e Schematic and photo of interconnected iADIPO-MPS and iHEP-MPS. fh Representative fluorescent images of iADIPO-MPS (left image in f, g) and iHEP-MPS (right image in f, h). Blue, nuclei; red, F-actin; green, fatty acids. i Total non-esterified fatty acid and fluorescent fatty acid concentrations in media at different iADIPO-iHEP ratios. Insets show representative fluorescent images of iHEP-MPS at 1:1 and 30:1 ratios. n = 3 except n = 4 for Total fatty acids 1,5. n referring to media. Two-tailed correlation test shows Pearson r = 0.9996 and p = 0.0173 between total and fluorescent fatty acids. j Glucose levels in media of 1 h insulin-stimulated iHEP-MPS 48 h after interconnection with iADIPO-MPS at different cell ratios. n = 4 except n = 7 for 5:1. n referring to media. p-values were calculated by one-way ANOVA then Dunnett’s test. All data are mean ± SD. *p < 0.05; **p < 0.005; ns, p > 0.05. Statistical methods and exact p-values are shown in Supplementary Data 1. Source data are provided as Source Data file.
Fig. 2
Fig. 2. Modeling the link between WAT inflammation and MASLD in iADIPO-iHEP-MPS.
ac Schematic of iADIPO-MPS and iHEP-MPS interconnection and representative images and quantification of fatty acids in iADIPO-MPS (ac) and iHEP-MPS (b, c). M1-iADIPO, iADIPO-MPS containing M1-iMACs; iADIPO, iADIPO-MPS without iMACs. n = 4 in iADIPO and n = 3 in iHEP. n referring to media. d LDH and lipolysis products in circulating media. n = 4 except n = 3 for LDH. n referring to media. e, f Gene expression in iADIPO-MPS (e) (n = 4) and iHEP-MPS (f) (n = 3 except n = 4 for iADIPO NFKB2). n referring to MPS. g Cytokine levels in circulating media. n = 3 except n = 4 for TNFα. n referring to media. (**) indicates values that were set to detection limit of the assay. h Glucose uptake in iADIPO-MPS measured by the clearance of glucose in the assay media. n = 4 referring to media. i Glucose levels in media of 1 h insulin-stimulated iHEP-MPS. n = 5 referring to media. All data are mean ± SD. p-values were determined by paired two-tailed t-test in (h) and unpaired two-tailed t-test elsewhere. *p < 0.05; **p < 0.005; ns, p > 0.05. Statistical methods and exact p-values are shown in Supplementary Data 1. Source data are provided as Source Data file.
Fig. 3
Fig. 3. Drugs normalizing inflammation and glucose and lipid metabolism in M1-iADIPO-iHEP-MPS.
a Schematic of MPS interconnection and drug administration. b, c Representative images (b) and quantification (c) of fluorescent fatty acids (green) in M1-iADIPO-MPS and iHEP-MPS. Met, metformin; Rosi, rosiglitazone; Dex, dexamethasone. n = 4 for M1-iADIPO-MPS except n = 3 for Rosi. n = 4 for iHEP-MPS except n = 3 for Dex. n = 3 for circulating media. n referring to MPS. d Glucose uptake in M1-iADIPO-MPS measured by the clearance of glucose in the assay media. n = 3 referring to media. e Gene expression in iMAC-iADIPO-MPS. n = 3 referring to MPS. f TNFα and adiponectin levels in circulating media. n = 3 except n = 4 for TNFα-Dex and Adiponectin-Control. n referring to media. g Gene expression in iHEP-MPS. n = 4 except n = 3 for Met, Rosi, Dex TNF and Met, Rosi NFKB2. n referring to MPS. h Glucose levels in media of iHEP-MPS without and with 1 h insulin-stimulation. n = 3 referring to media. All data are mean ± SD. p-values were determined by paired two-tailed t-tests in Basal vs Insulin comparison for each drug in (d) and (h), by one-way ANOVA followed by Tukey’s test in multiple comparisons for each group in (cg) and two-way ANOVA followed by Tukey’s test for cross-group comparison in (h). *p < 0.05; **p < 0.005. Statistical methods and exact p-values are shown in Supplementary Data 1. Source data are provided as Source Data file.
Fig. 4
Fig. 4. Identification of the effects of semaglutide on WAT inflammation-induced MASLD in M1-iADIPO-iHEP-MPS.
a, b Representative images (a) and quantification (b) of fluorescent fatty acids in M1-iADIPO-MPS and iHEP-MPS. n = 6 except n = 5 for circulating media. n referring to MPS. c Gene expression in iMAC-iADIPO-MPS. n = 5 referring to MPS. d TNFα and adiponectin levels in circulating media. n = 3 referring to media. e Gene expression in iHEP-MPS. n = 3 except n = 4 for ACACA to CYP2E1 and n = 5 for Semaglutide PPARA. n referring to MPS. f Glucose uptake in M1-iADIPO-MPS in response to insulin. n = 3 referring to media. g Glucose levels in media of iHEP-MPS without and with 1 h insulin-stimulation. n = 3 for Control and n = 4 for Semaglutide. n referring to MPS. h Schematic of selective semaglutide treatment of iHEP-MPS (top) or M1-iADIPO-MPS, the latter including semaglutide antagonism with exendin 9–39 and compound 5D in iHEP-MPS (bottom). i, j Quantification of fatty acids (i) (n = 8 except n = 6 for No semaglutide and Semaglutide on M1-iADIPO-iHEP-MPS. n referring to MPS) and glucose without and with 1 h insulin-stimulation in media of iHEP-MPS (j) (n = 3 referring to media). k Gene expression in iHEP-MPS. n = 3 referring to MPS. All data are mean ± SD. p-values were determined by paired two-tailed t-test in Basal vs Insulin comparison in (f, gj), one-way ANOVA followed by Tukey’s test in (i), two-way ANOVA followed by Tukey’s test in cross-group comparison in (g, j) and by unpaired two-tailed t-test elsewhere. *p < 0.05; **p < 0.005; ns, p > 0.05. Statistical methods and exact p-values are shown in Supplementary Data 1. Source data are provided as Source Data file.

References

    1. Ogden, C. L. et al. Trends in obesity prevalence by race and hispanic origin—1999-2000 to 2017-2018. JAMA324, 1208–1210 (2020). 10.1001/jama.2020.14590 - DOI - PMC - PubMed
    1. Rosen, E. D. & Spiegelman, B. M. What we talk about when we talk about fat. Cell156, 20–44 (2014). 10.1016/j.cell.2013.12.012 - DOI - PMC - PubMed
    1. Haffner, S. M. Pre-diabetes, insulin resistance, inflammation and CVD risk. Diabetes Res. Clin. Pract.61, S9–S18 (2003). 10.1016/S0168-8227(03)00122-0 - DOI - PubMed
    1. Santoro, A., McGraw, T. E. & Kahn, B. B. Insulin action in adipocytes, adipose remodeling, and systemic effects. Cell Metab.33, 748–757 (2021). 10.1016/j.cmet.2021.03.019 - DOI - PMC - PubMed
    1. Birkenfeld, A. L. & Shulman, G. I. Nonalcoholic fatty liver disease, hepatic insulin resistance, and type 2 diabetes. Hepatology59, 713–723 (2014). 10.1002/hep.26672 - DOI - PMC - PubMed

Publication types

MeSH terms

Substances