. 2024 Sep 12;15(1):7977.
doi: 10.1038/s41467-024-52363-w.

Transiently formed nucleus-to-cilium microtubule arrays mediate senescence initiation in a KIFC3-dependent manner

Affiliations

Transiently formed nucleus-to-cilium microtubule arrays mediate senescence initiation in a KIFC3-dependent manner

Jielu Hao Robichaud et al. Nat Commun. .

Erratum in

Abstract

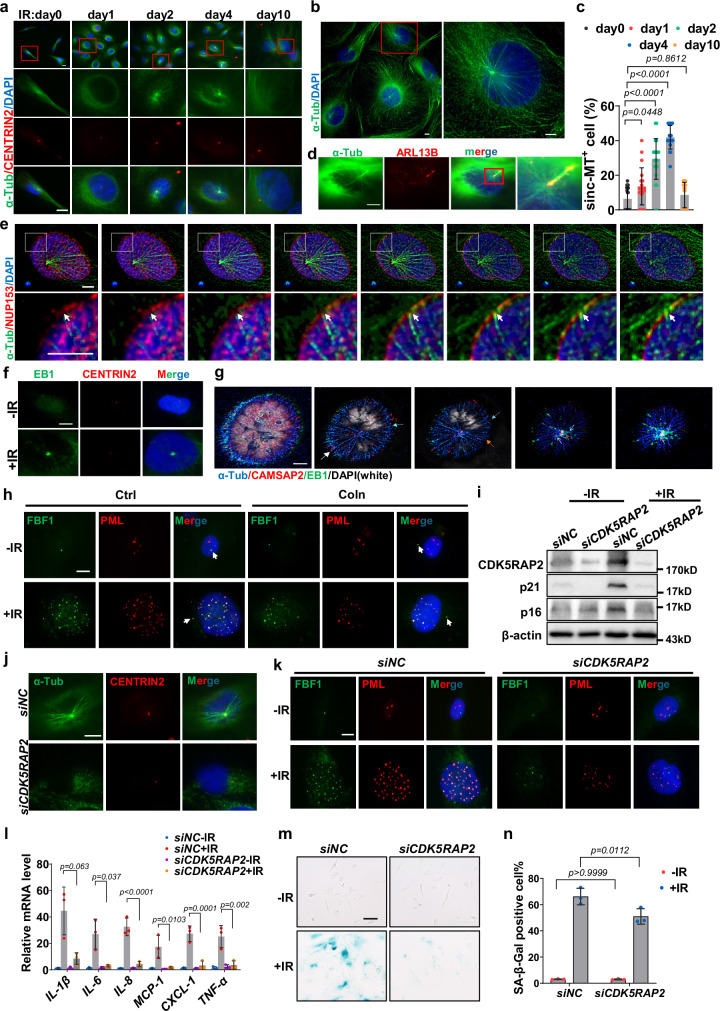
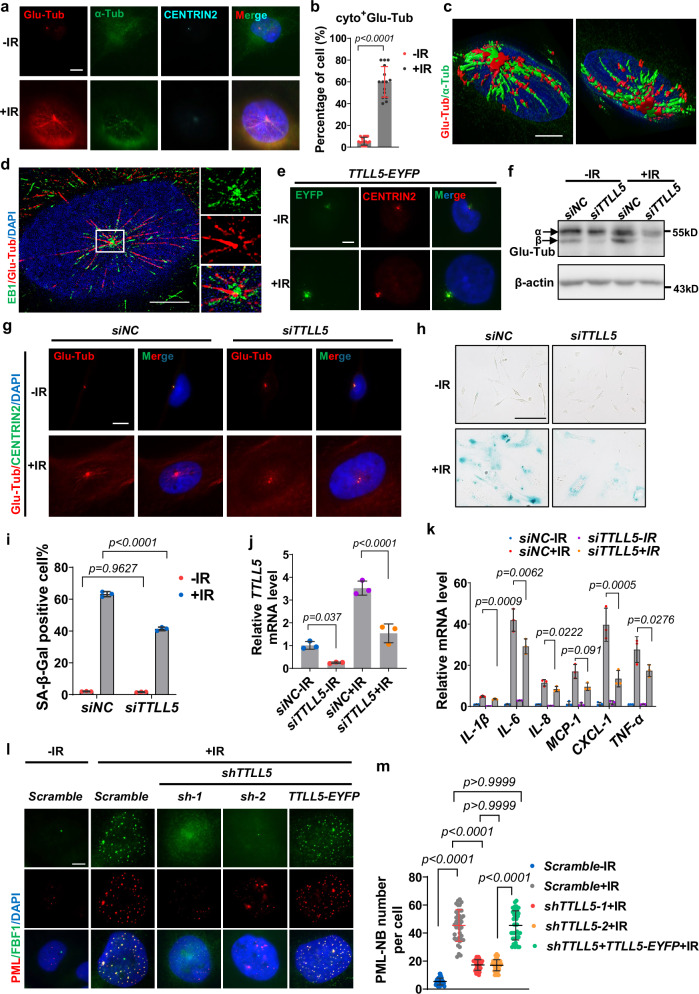
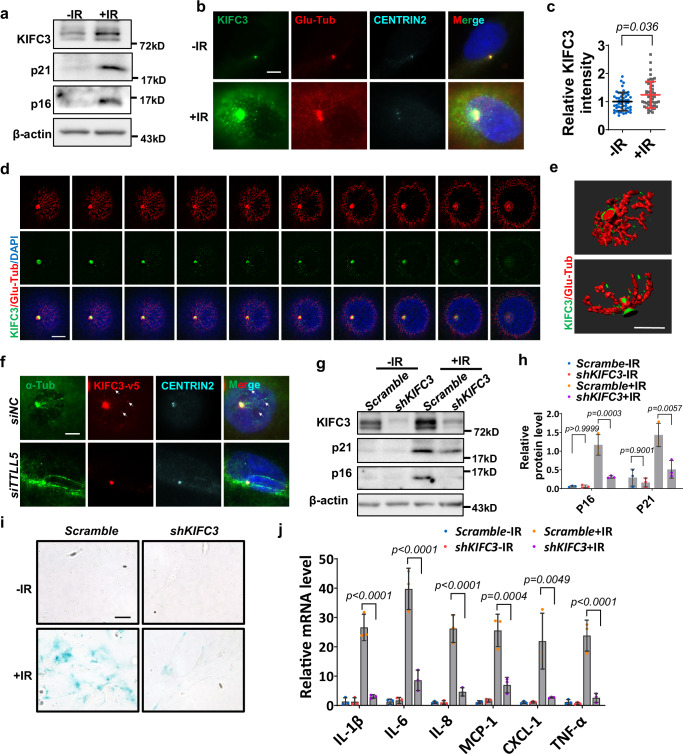
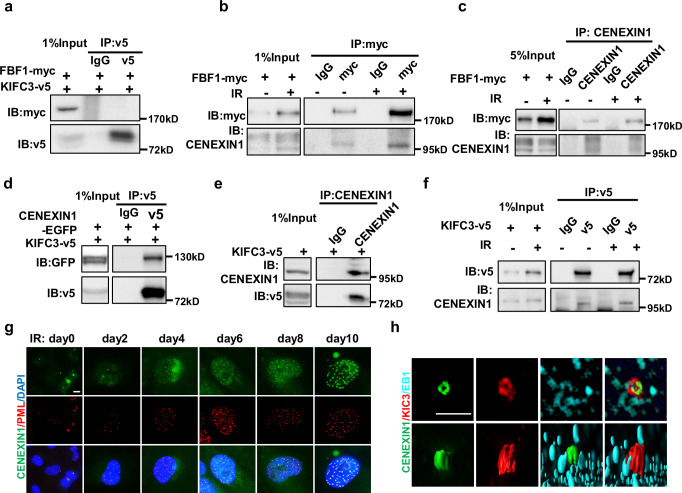
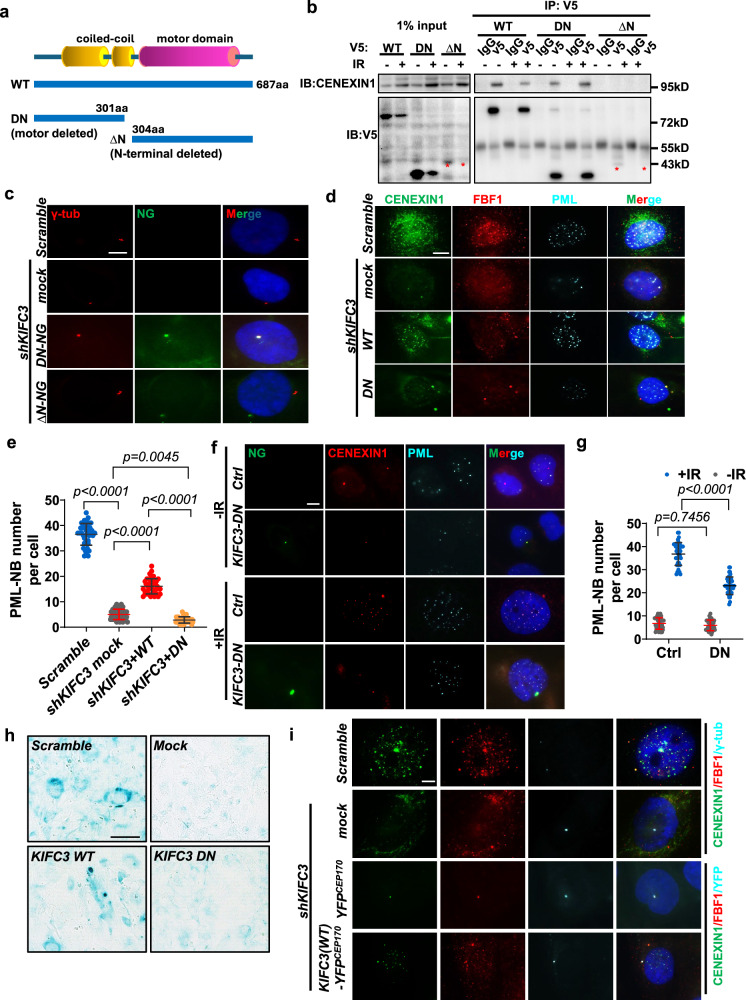
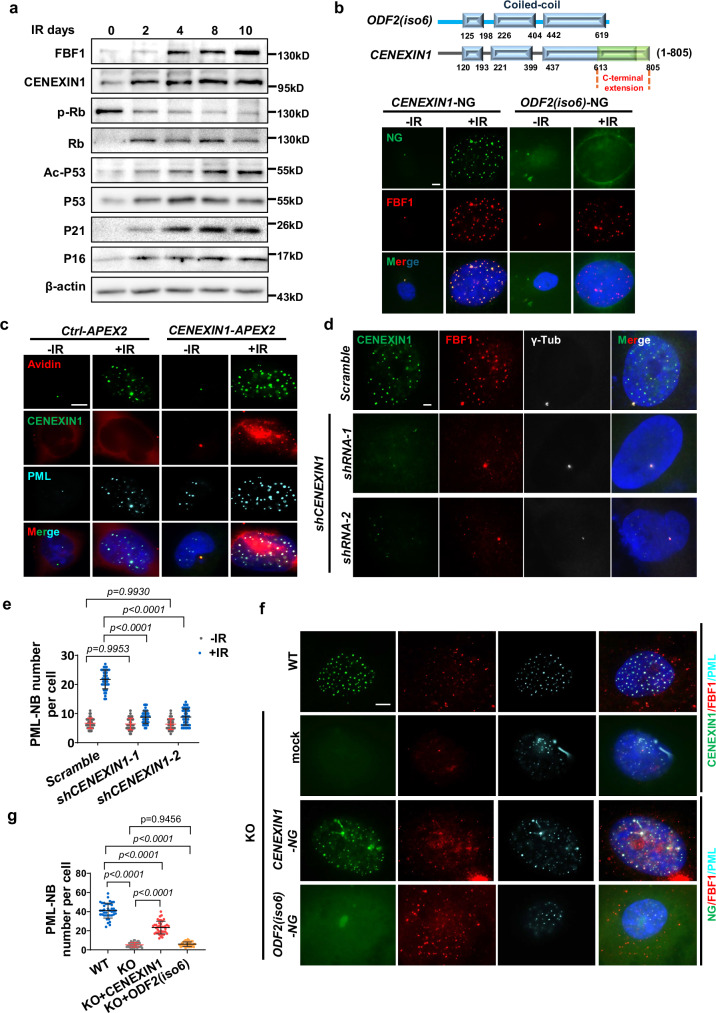
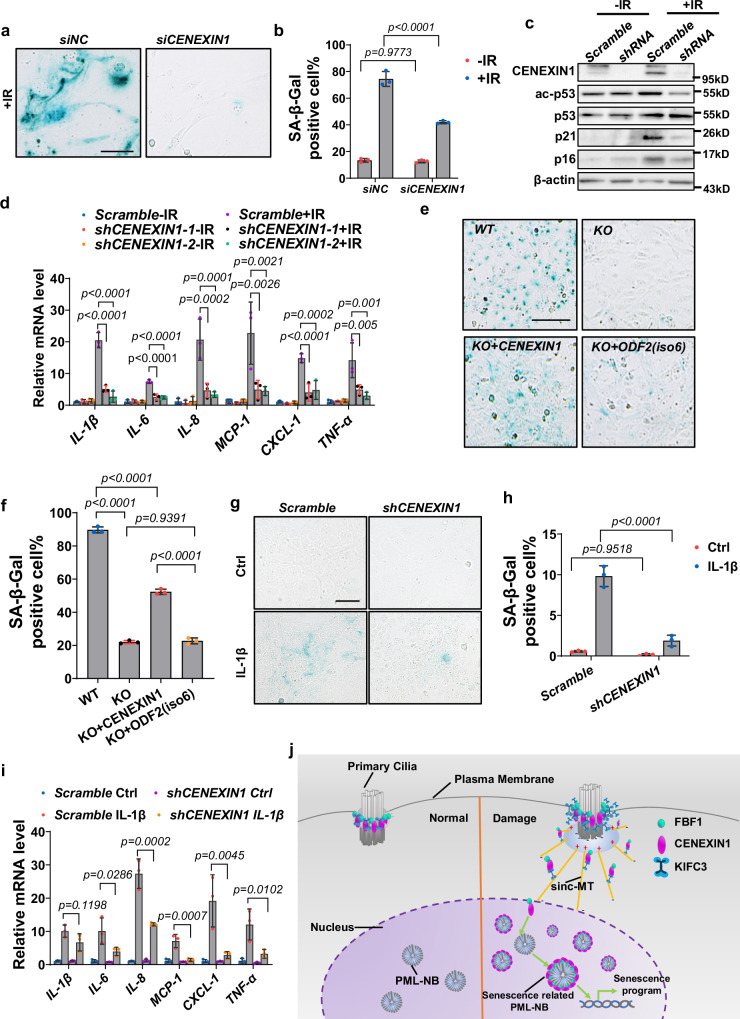
Despite the importance of cellular senescence in human health, how damaged cells undergo senescence remains elusive. We have previously shown that promyelocytic leukemia nuclear body (PML-NBs) translocation of the ciliary FBF1 is essential for senescence induction in stressed cells. Here we discover that an early cellular event occurring in stressed cells is the transient assembly of stress-induced nucleus-to-cilium microtubule arrays (sinc-MTs). The sinc-MTs are distinguished by unusual polyglutamylation and unique polarity, with minus-ends nucleating near the nuclear envelope and plus-ends near the ciliary base. KIFC3, a minus-end-directed kinesin, is recruited to plus-ends of sinc-MTs and interacts with the centrosomal protein CENEXIN1. In damaged cells, CENEXIN1 co-translocates with FBF1 to PML-NBs. Deficiency of KIFC3 abolishes PML-NB translocation of FBF1 and CENEXIN1, as well as senescence initiation in damaged cells. Our study reveals that KIFC3-mediated nuclear transport of FBF1 along polyglutamylated sinc-MTs is a prerequisite for senescence induction in mammalian cells.


Conflict of interest statement

The authors declare no competing interests.

Figures

Fig. 1
Fig. 1. Irreparable stress induces transient assembly of sinc-MTs that promote cellular senescence in human cells.
a Immunofluorescent images of sinc-MTs in IR-treated RCTE cells. α-tubulin (green) labels MTs. CENTRIN2 (red) labels the ciliary base. Scale bar, 10 μm. b Stacked z-steps deconvolution image of RCTE cells exposed to IR on day2 using α-tubulin (green) labeling MTs. Scale bar, 10 μm. c Quantification of sinc-MTs-positive cells, calculated as the ratio of positive cells to the total number of cells (n = 20 fields, 10–20 cells per field). d Immunofluorescence showing sinc-MTs and the cilium in IR-treated RCTE cells. α-tubulin (green) labels MTs. ARL13B (red) labels primary cilium. Scale bar, 10 μm. e Confocal z-stack of IR-treated RCTE cells, with arrows pointing at sinc-MTs (α-tubulin, green) near the nuclear envelope (NUP153, red). Scale bar, 5 μm. f Immunofluorescence of sinc-MTs plus-end binding protein EB1 (green) near the ciliary base (CENTRIN2, red) in IR-treated RCTE cells. Scale bar, 10 μm. g Confocal z-stack images in IR-treated RCTE cells using antibodies against α-tubulin (blue), CAMSAP2 (red), and EB1 (green). Arrows indicate the minus- and plus-ends of sinc-MT filaments. Scale bar, 5 μm. h Localization PML (red) and FBF1 (green) in IR-treated RCTE cells with or without colchicine treatment. Arrows indicate the ciliary base. Scale bar, 10 μm. i Western blot of CDK5RAP2 and senescence markers in control or siCDK5RAP2 RCTE cells 10 days post-IR. j Immunofluorescence of sinc-MTs (α-tubulin, green) in IR-treated control or siCDK5RAP2 RCTE cells. CENTRIN2 (red) labels the ciliary base. Scale bar, 10 μm. k Immunostaining of PML-NBs (red) and FBF1 (green) in IR-treated control or siCDK5RAP2 RCTE cells. Scale bar, 10 μm. Relative mRNA level of SASP genes (l), SA-β-gal staining (m), quantitation of the percentage of SA-β-gal-positive cells (n = 3 independent experiments, 6-8fields per experiment, 100–200 cells per field) (n) in control or siCDK5RAP2 RCTE cells 10 days post-IR. Scale bar, 50 μm. All results from n = 3 independent experiments. Data are the mean ± SEM. One-way ANOVA was used analyzing (c, l, n). Three experiments were repeated independently with similar results (a, b, dk). Source data are provided as a Source Data file.
Fig. 2
Fig. 2. Polyglutamylation of sinc-MTs is required for DNA damage-induced senescence.
Immunofluorescence images showing the polyglutamylation (labeled with GT335 antibody, red) of sinc-MTs (a) and quantitation of sinc-MT-positive cells (n = 15 fields, 10–25 cells per field) (b) in RCTE cells with or without IR exposure. MTs labeled with α-tubulin (green), and the ciliary base labeled with CENTRIN2 (cyan). Scale bar, 10 μm. c 3D surface-rendering reconstruction of serial sections of SIM images showing the polyglutamylated sinc-MTs between the nuclear envelope and the ciliary base in IR-treated RCTE cells. Glutamylated tubulin (red) and α-tubulin (green) were immunostained by antibodies, respectively. Scale bar, 10 μm. d Super-resolution SIM images of polyglutamylated sinc-MTs (red) with plus-end labeled with EB1 (green) in IR-treated RCTE cells. Scale bar, 10 μm. e Localization of EYFP-tagged TTLL5 (green) in RCTE cells with or without IR exposure. CENTRIN2 (red) labels the ciliary base. Scale bar, 10 μm. f Western blot of glutamylated tubulins in control or siTTLL5 RCTE cells with or without IR exposure. g Immunofluorescence images of polyglutamylated sinc-MTs (red) in control or siTTLL5 RCTE cells with or without IR exposure. CENTRIN2 (green) labels the ciliary base. Scale bar, 10 μm. SA-β-gal staining (h), quantitation of the percentage of SA-β-gal-positive cells (n = 3 independent experiments, 6–8 fields per experiment with 100–200 cells per field) (i), relative mRNA levels of TTLL5 (j), and expression of SASP genes (k) in control or siTTLL5 RCTE cells at day 10 after IR exposure. Scale bar, 50 μm. Results from n = 3 independent experiments. Immunofluorescence images of PML-NBs (red) translocation of FBF1 (green) (l) and quantitation of PML-NBs numbers per cell (n = 40 cells) (m) in control or shTTLL5 IR-treated RCTE cells re-expressing EYFP-TTLL5. Scale bar, 10 μm. Data are the mean ± SEM. Two-tailed Unpaired Student’s t test was used for analysis in (b). One-way ANOVA analysis was employed for (ik, m). Three experiments were repeated independently with similar results (dg). Source data are provided as a Source Data file.
Fig. 3
Fig. 3. Minus-end-directed kinesin KIFC3 associates with sinc-MTs to mediate senescence induction.
a Western blot detecting KIFC3 and senescence markers in RCTE cells with or without IR exposure. Three experiments were repeated independently with similar results. Immunofluorescent images showing KIFC3 (green) and polyglutamylated sinc-MTs (labeled with GT335 antibody, red) (b) and relative intensity of KIFC3 (c) in RCTE cells with or without IR exposure. CENTRIN2 (cyan) labels the ciliary base. n = 50 cells. Scale bar, 10 μm. SIM series section (d) and 3D surface-rendering reconstruction (e). Scale bar, 10 μm. Localization of KIFC3 (green) along polyglutamylated sinc-MTs (red) in RCTE cells exposed to IR. f Immunofluorescence images showing KIFC3 and sinc-MTs (labeled with α-tubulin) in control or siTTLL5 RCTE cells after IR exposure. CENTRIN2 labels the ciliary base. Scale bar, 10 μm. Western blot of senescence markers (g), quantitation of relative protein levels of senescence markers (h), SA-β-gal staining (i), relative mRNA level of SASP genes (j) in control or shKIFC3 RCTE cells at day 10 after IR exposure. Scale bar, 50 μm. All results from n = 3 independent experiments. Data are the mean ± SEM. Statistical significance was determined using one-way ANOVA. Three experiments were repeated independently with similar results (df). Source data are provided as a Source Data file.
Fig. 4
Fig. 4. Centrosomal protein CENEXIN1 interacts with KIFC3 and co-translocates with FBF1 to PML-NBs in IR-treated cells.
a Immunoprecipitation showing no interaction between V5-tagged KIFC3 and Myc-tagged FBF1 when overexpressed in 293 T cells. b, c Immunoprecipitation of endogenous CENEXIN1 with Myc-tagged FBF1 in IR-treated RCTE cells. d V5-tagged KIFC3 immunoprecipitates with EGFP-tagged CENEXIN1 when overexpressed in 293 T cells. e, f Endogenous CENEXIN1 immunoprecipitates with V5-tagged KIFC3 in control or IR-treated RCTE cells. g Immunofluorescence images showing PML-NBs translocation of CENEXIN1 (green) in IR-treated RCTE cells. PML (red) labels the PML-NBs. Scale bar, 10 μm. h 3D surface-rendering reconstruction of SIM section images showing the spatial relationship among CENEXIN1 (green), KIFC3 (red), and EB1 (cyan) labeled plus-ends of sinc-MTs at ciliary base in IR-treated RCTE cells. Scale bar, 10 μm. Three experiments were repeated independently with similar results (ah). Source data are provided as a Source Data file.
Fig. 5
Fig. 5. The PML-NBs translocation of the CENEXIN1-FBF1 complex requires KIFC3 motor activity.
a Diagram of WT and KIFC3 variants used in experiments. b Endogenous CENEXIN1 immunoprecipitates with V5-tagged WT or KIFC3DN in RCTE cells, asterisk labels KIFC3∆N. c Immunofluorescent images showing localization of NeonGreen(NG)-tagged KIFC3 truncation variants (green) in RCTE cells. γ-tubulin (red) labels the ciliary base. Scale bar, 10 μm. Immunofluorescence images showing the effect of re-expression of KIFC3 or KIFC3DN on CENEXIN1 and FBF1 translocation. CENEXIN1 (green), FBF1 (red) and PML (cyan) were immunostained by antibodies, respectively (d) and quantitation of PML-NBs (e) in shKIFC3 RCTE cells with or without IR exposure (n = 40 cells). Scale bar, 10 μm. Immunofluorescence images showing the changes of CENEXIN1 (red) and PML (cyan) in control or over-expression NG-tagged KIFC3DN RCTE cells with or without IR treatment (f) and quantitation of PML-NBs numbers per cell (n = 40 cells) (g). Localization of KIFC3DN was shown by NG direct fluorescence (green). Scale bar, 10 μm. h SA-β-gal staining of IR-treated shKIFC3 RCTE cells re-expressing KIFC3 or KIFC3DN. Scale bar, 100 μm. i Immunofluorescence images showing the impact on the PML-NBs translocation of CENEXIN1 (green) and FBF1 (red) after re-expressing CEP170C-tagged KIFC3 in IR-treated shKIFC3 RCTE cells. γ-tubulin (cyan) labels the ciliary base. YFP direct fluorescence shown CEP170C-tagged KIFC3. Scale bar, 10 μm. All results from n = 3 independent experiments. Data are the mean ± SEM. Statistical significance was determined using one-way ANOVA. Three experiments were repeated independently with similar results (b, c, h, i). Source data are provided as a Source Data file.
Fig. 6
Fig. 6. CENEXIN1 but not the shorter ODF2(iso6) isoform regulates the PML-NBs translocation of FBF1.
a Western blot showing changes of CENEXIN1, FBF1, and senescence markers in IR-treated RCTE cells. b Immunofluorescence images of RCTE cells expressing NG tagged-CENEXIN1 or short isoform ODF2 (iso6) with or without IR treatment. FBF1 (red) was immunostained by antibody. CENEXIN1 or ODF2 (iso6) was shown by NG direct fluorescence (green). Scale bar, 10 μm. c Nuclear PML-NBs translocation of CENEXIN1 and biotinylated proteins in control or APEX2-tagged CENEXIN1 over-expression RCTE cells with or without IR treatment. Endogenous CENEXIN1 (green) and PML (cyan) were labeled with antibody, respectively. Biotinylated proteins were labeled with streptavidin (red). Scale bar, 10 μm. Immunofluorescence images showing nuclear translocation of FBF1 (d) and quantitation of PML-NBs number (e) in IR-treated control or shCENEXIN1 RCTE cells (n = 40 cells). γ-tubulin (white) labels ciliary base. Scale bar, 10 μm. Immunofluorescence images showing the rescuing effect of re-expressing NG-tagged CENEXIN1 or ODF2 (iso6) (f) and quantitation of PML-NBs number (g) in IR-treated control or CENEXIN1−/− RCTE cells (n = 40 cells). CENEXIN1 or ODF2 (iso6) was shown by NG direct fluorescence. Endogenous CENEXIN1 (green), FBF1 (red) and PML (cyan) were labeled with antibody, respectively. Scale bar, 10 μm. All results from n = 3 independent experiments. Data are the mean ± SEM. Statistical significance was determined using one-way ANOVA. Three experiments were repeated independently with similar results (ac). Source data are provided as a Source Data file.
Fig. 7
Fig. 7. CENEXIN1 deficiency suppresses senescence induction.
ad SA-β-gal staining (a), quantitation of SA-β-gal-positive cells (n = 3 independent experiments, 6-8fields per experiment, 200 cells per field) (b) in control or siCENEXIN1 RCTE cells with or without IR exposure. Western blot of senescence markers (c), and relative mRNA level of SASP genes (d) in control or shCENEXIN1 RCTE cells with or without IR exposure. For IR treatment, cells were collected at day 10 after irradiation. Scale bar, 100 μm. SA-β-gal staining (e) and quantitation of SA-β-gal-positive cells (n = 3 independent experiments, 6-8fields per experiment, 200–300 cells per field) (f), in control or CENEXIN1-/-RCTE cells re-expressing CENEXIN1 or ODF2 (iso6) at day 10 after IR exposure. Scale bar, 100 μm. SA-β-gal staining (g), quantitation of SA-β-gal-positive cells (n = 3 independent experiments, 3-4fields per experiment, 200–500 cells per field) (h), and relative mRNA level of SASP genes (i) in IL-1β-treated (3 ng/ml for 5 days) control or shCENEXIN1 RCTE cells. Scale bar, 50 μm. j Proposed working model: Exposure to irreparable stresses triggers the reorganization of microtubules (MTs), leading to the nucleation of sinc-MTs in the proximity of the nuclear envelop towards the ciliary base. Concurrently, the minus-end-directed kinesin KIFC3 is recruited to the ciliary base. It subsequently facilitates the transportation of the CENEXIN1-FBF1 cargo complex along the sinc-MTs, directing it towards the nucleus. This process initiates cellular senescence in stressed human cells. All results from n = 3 independent experiments. Data are the mean ± SEM. Statistical significance was determined using one-way ANOVA. Three experiments were repeated independently with similar results (c). Source data are provided as a Source Data file.

References

    1. Kirkland, J. L. & Tchkonia, T. Cellular senescence: a translational perspective. EBioMedicine21, 21–28 (2017). - PMC - PubMed
    1. Campisi, J. & d’Adda di Fagagna, F. Cellular senescence: when bad things happen to good cells. Nat. Rev. Mol. Cell Biol.8, 729–740 (2007). - PubMed
    1. Faget, D. V., Ren, Q. & Stewart, S. A. Unmasking senescence: context-dependent effects of SASP in cancer. Nat. Rev. Cancer19, 439–453 (2019). - PubMed
    1. Xu, M. et al. Targeting senescent cells enhances adipogenesis and metabolic function in old age. Elife4, e12997 (2015). - PMC - PubMed
    1. Baker, D. J. et al. Clearance of p16Ink4a-positive senescent cells delays ageing-associated disorders. Nature479, 232–236 (2011). - PMC - PubMed

Publication types

LinkOut - more resources