. 2024 Sep 12;14(1):21331.
doi: 10.1038/s41598-024-72392-1.

Engineering potent chimeric antigen receptor T cells by programming signaling during T-cell activation

Affiliations

Engineering potent chimeric antigen receptor T cells by programming signaling during T-cell activation

Aileen W Li et al. Sci Rep. .

Abstract

Programming cell signaling during T-cell activation represents a simple strategy for improving the potency of therapeutic T-cell products. Stim-R technology (Lyell Immunopharma) is a customizable, degradable synthetic cell biomimetic that emulates physiologic, cell-like presentation of signal molecules to control T-cell activation. A breadth of Stim-R formulations with different anti-CD3/anti-CD28 (αCD3/αCD28) antibody densities and stoichiometries were screened for their effects on multiple metrics of T-cell function. We identified an optimized formulation that produced receptor tyrosine kinase-like orphan receptor 1 (ROR1)-targeted chimeric antigen receptor (CAR) T cells with enhanced persistence and polyfunctionality in vitro, as assessed in repeat-stimulation assays, compared with a benchmark product generated using a conventional T-cell-activating reagent. In transcriptomic analyses, CAR T cells activated with Stim-R technology showed downregulation of exhaustion-associated gene sets and retained a unique subset of stem-like cells with effector-associated gene signatures following repeated exposure to tumor cells. Compared with the benchmark product, CAR T cells activated using the optimized Stim-R technology formulation exhibited higher peak expansion, prolonged persistence, and improved tumor control in a solid tumor xenograft model. Enhancing T-cell products with Stim-R technology during T-cell activation may help improve therapeutic efficacy against solid tumors.


Conflict of interest statement

A.S.C. is an inventor on a patent application related to the Stim-R technology (US patent 11555177B2). All authors were employees of Lyell Immunopharma at the time of study execution, and may additionally hold stock in Lyell Immunopharma, which has licensed intellectual property related to the Stim-R technology.

Figures

Fig. 1
Fig. 1
Stim-R technology is a customizable, degradable, synthetic cell biomimetic that enables the physiologic presentation of signal molecules to control T-cell properties. (A) Stim-R technology is composed of lipid-coated silica micro-rods. (B) Surface-bound signals, such as agonist antibodies targeting CD3 (αCD3; signal 1) and CD28 (αCD28; signal 2), can be attached to the synthetic lipid membrane surface to emulate natural antigen presentation. (C) The lipid-coated silica micro-rods can be loaded with soluble signals (e.g., IL-2, IL-7, and IL-15), which are subject to controlled release over time to mimic paracrine cytokine signaling (signal 3). (D) The fabricated Stim-R material is used for ex vivo activation of T cells during T cell therapy production. (E) Stim-R technology facilitates the physiologic presentation of both surface and soluble signals and supports precise tuning of T-cell signal presentation parameters, such as signal combinations, densities, and stoichiometries, to generate T-cell products with desirable phenotypic and functional properties.
Fig. 2
Fig. 2
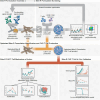
An optimized Stim-R formulation was identified using a suite of in vitro assessments, and subsequently mechanistically interrogated and validated in vivo using a solid tumor xenograft model. Stim-R technology was leveraged to fabricate an array of formulation variants in which signal stoichiometry and cumulative signal intensity were precisely and independently varied. Test variants were used to produce a corresponding array of ROR1-targeted CAR T-cell products, which were then functionally characterized in non-normalized repeat-stimulation assays in combination with ICS to assess polyfunctionality. Based on the trends observed, new arrays of Stim-R formulations were designed and prepared for further optimization in an iterated process. This iterated screening approach identified an optimized Stim-R formulation that generated CAR T-cell products with enhanced function. For benchmarking, ROR1-targeted CAR T cells were also activated in an analogous process using a conventional T-cell–activating reagent. To compare the functionality of these products on a per-cell basis, normalized repeat-stimulation assays were conducted to assess tumor cell killing, T-cell proliferation, and cytokine production. In addition, bulk and single-cell transcriptomic analyses were performed to probe the mechanisms underlying improved CAR T-cell potency following activation using Stim-R technology. The improved function of the CAR T-cell product generated using the optimized Stim-R formulation was validated in vivo in a xenograft solid tumor (lung cancer) model assessing antitumor activity, PK, and survival.
Fig. 3
Fig. 3
Using Stim-R technology to optimize αCD3 and αCD28 signaling during T-cell activation generates CAR T-cell products with enhanced polyfunctionality and cytotoxicity. (A) Signal stoichiometry is the relative density of the αCD28 (costimulation) signal to the αCD3 (TCR) signal on the Stim-R technology lipid coating. (B) Cumulative signal intensity is the total density (mol %) of both the αCD3 and αCD28 signals on the Stim-R technology lipid coating. (C) Cytotoxicity in the non-normalized repeat-stimulation assay (left) and polyfunctionality (right) of CAR T cells activated with Stim-R variants with signal stoichiometry (αCD28:αCD3) ranging between 0.1 and 5.0 at a constant αCD3 intensity of 0.25%. Data represent the mean (± SEM) of products from 1 to 7 independent donors. (D) Cytotoxicity in the non-normalized repeat-stimulation assay (left) and polyfunctionality (right) of CAR T cells activated with Stim-R variants with cumulative signal intensity ranging between 0.1 and 1.0 at a constant αCD28:αCD3 ratio of 1.0. Data represent the mean (± SEM) of products from 3 to 6 independent donors. (E) CAR T-cell products activated using the optimized Stim-R formulation or the benchmark reagent were assessed using a non-normalized repeat-stimulation assay to measure persistent tumor cell clearance. Each panel shows the mean (± SD) of two technical replicates using products from an independent donor. (F) ICS to measure the percentage of polyfunctional (IL-2 + IFN-γ + ; left) and nonresponsive (IL-2–IFN-γ–; right) T cells. Data are shown for individual donors (n = 5), with black lines connecting data for products derived from the same donor. Paired two-tailed t-test, *p = 0.0187 (t = 3.822; df = 4), **p = 0.0095 (t = 4.667; df = 4).
Fig. 4
Fig. 4
CAR T cells activated using Stim-R technology exhibit enhanced in vitro function in normalized repeat-stimulation assays. (A) In the normalized repeat-stimulation assay, CAR T cells were exposed to repeated stimulations with ROR1 + H1975 cancer cells. The E:T ratio was reset to 1:5 at each restimulation to enable comparison of CAR T-cell product functionality on a per-cell basis. (B) Target clearance with CAR T cells activated using the optimized Stim-R formulation or the benchmark reagent in the normalized repeat-stimulation assay. Each panel shows the mean (± SD) of two technical replicates using products from an independent donor. (C) Expansion of CAR T cells activated using the optimized Stim-R formulation or the benchmark reagent before each restimulation in the normalized repeat-stimulation assay. Data are shown for individual donors (n = 3), with solid lines connecting the mean expansion at each stimulation. Stimulation 1 is shown in the graph to highlight the trend. Two-way ANOVA was performed using only data from stimulations 2–4 (p = 0.0031; F(2, 8) = 12.98 for interaction) with Šidák’s multiple comparisons test, *p = 0.0225 (t = 9.093; df = 2.296). (D) Concentration of IL-2 (left) and IFN-γ (right) in the culture supernatant 24 h after each stimulation. Data are shown for individual donors (n = 3) with black lines connecting data for products derived from the same donor.
Fig. 5
Fig. 5
CD8 + CAR T cells activated with Stim-R technology retained a unique subset of stem-like cells with effector-associated gene signatures and displayed downregulation of exhaustion-associated gene sets. (A) Bulk RNA-Seq GSEA comparing gene set enrichment in CD8 + CAR T cells activated using Stim-R technology versus the benchmark reagent. The bar chart shows the negative loge of the FDR-adjusted p values, color-coded according to NES. (B) UMAP visualization of single-cell RNA-Seq data from CD8 + T cells activated using Stim-R technology (left, red plot) or the benchmark reagent (left, blue plot), and the composite (right). Putative stem-like clusters for cells activated using Stim-R technology (Cluster 1) or the benchmark reagent (Cluster 4) are indicated along with the range of proportion of cells within each cluster across three independent donors. (C) Single-cell RNA-Seq data showing expression of stemness- and effector-associated markers in CD8 + CAR T cells. The left and middle plots show expression level for stemness-associated markers (TCF7 RNA and CD27 protein) and effector-associated genes (GNLY and CCL5 RNA) on the composite UMAP visualization, with Cluster 1 indicated. The right graphs depict the distribution of TCF7 RNA and CD27 protein expression level in Clusters 1 and 4. Wilcoxon test, ****p < 0.0001. (D) Single-cell RNA-Seq data showing expression of exhaustion-associated genes in CD8 + CAR T cells. The left and middle plots show the TTE gene set module score (left) and TIGIT protein expression (middle) on the composite UMAP visualization. The right graph indicates the proportions of Stim-R technology- or benchmark-activated CD8 + cells within exhaustion-associated Clusters 8 and 14 in three individual donors, with black lines connecting data for the same donor. One-sided t-test, p = 0.067 (t = − 2.46; df = 2). (E) Bulk RNA-Seq GSEA plot for the TTE gene set. The green line indicates the running enrichment score as the algorithm walks through the gene list ranked according to differential expression in CD8 + T cells of the two products. Black lines indicate the positions of TTE genes within the ranking.
Fig. 6
Fig. 6
CAR T cells activated using Stim-R technology showed improved expansion, persistence, and antitumor activity in a solid tumor xenograft model. (A) 5 × 106 ROR1 + H1975 cells were inoculated subcutaneously in NSG MHC I/II dKO mice. After 14 days, mice were infused with 2 × 106 CAR T cells (assessed as CD3 + EGFRopt + T cells) activated using Stim-R technology, the benchmark reagent, or an equivalent total number of mock T cells activated using Stim-R technology. Tumor volume was measured at least twice weekly for up to 60 days. Peripheral blood was collected for PK analysis once per week for up to five weeks. (B) Tumor volume over time in mice bearing ROR1 + H1975 xenografts after infusion of CAR T cells activated using Stim-R technology (left), Stim-R technology with mock transduction (middle), or the benchmark reagent (right) (n = 10 per group). (C) Kaplan–Meier curves showing overall survival in mice bearing ROR1 + H1975 xenografts after infusion of CAR T cells activated using Stim-R technology, Stim-R technology with mock transduction, or the benchmark reagent (n = 10 per group). Mantel–Cox test, ****p < 0.0001. (D) PK analyses showing the blood concentration of CAR T cells (assessed as CD3 + EGFRopt + cells) over time (left) and blood concentration 24 h after infusion, at peak, and cumulative levels calculated as area under the curve (AUC; right) (n = 10 per group). AUC was calculated using PK data up to day 28. Only mice for which PK data could be collected for all timepoints were included in the analysis (n = 8 for the benchmark group, n = 10 for the Stim-R group). Data represent the mean (± SEM) of log-transformed data. Data points from individual mice are overlaid. Data in right graph of d, left were analyzed using a two-tailed Mann–Whitney test ns, not significant (p = 0.0730). Data in right graph of d, middle and right were analyzed using a two-tailed t-test; middle: ****p < 0.0001 (t = 14.68; df = 18); right: ****p < 0.0001 (t = 12.24; df = 16).

Similar articles

Cited by

References

    1. Sung, H. et al. Global Cancer Statistics 2020: GLOBOCAN estimates of incidence and mortality worldwide for 36 cancers in 185 countries. CA Cancer J. Clin.71, 209–249 (2021). 10.3322/caac.21660 - DOI - PubMed
    1. Neelapu, S. S. et al. Axicabtagene ciloleucel CAR T-cell therapy in refractory large B-Cell lymphoma. N. Engl. J. Med.377, 2531–2544 (2017). 10.1056/NEJMoa1707447 - DOI - PMC - PubMed
    1. Maude, S. L. et al. Tisagenlecleucel in children and young adults with B-cell lymphoblastic leukemia. N. Engl. J. Med.378, 439–448 (2018). 10.1056/NEJMoa1709866 - DOI - PMC - PubMed
    1. Berdeja, J. G. et al. Ciltacabtagene autoleucel, a B-cell maturation antigen-directed chimeric antigen receptor T-cell therapy in patients with relapsed or refractory multiple myeloma (CARTITUDE-1): A phase 1b/2 open-label study. Lancet398, 314–324 (2021). 10.1016/S0140-6736(21)00933-8 - DOI - PubMed
    1. Del Bufalo, F. et al. GD2-CART01 for relapsed or refractory high-risk neuroblastoma. N. Engl. J. Med.388, 1284–1295 (2023). 10.1056/NEJMoa2210859 - DOI - PubMed

MeSH terms

LinkOut - more resources