. 2024 Oct;25(10):1900-1912.
doi: 10.1038/s41590-024-01952-4. Epub 2024 Sep 12.

Dual blockade of IL-10 and PD-1 leads to control of SIV viral rebound following analytical treatment interruption

Affiliations

Dual blockade of IL-10 and PD-1 leads to control of SIV viral rebound following analytical treatment interruption

Susan Pereira Ribeiro et al. Nat Immunol. 2024 Oct.

Erratum in

Abstract

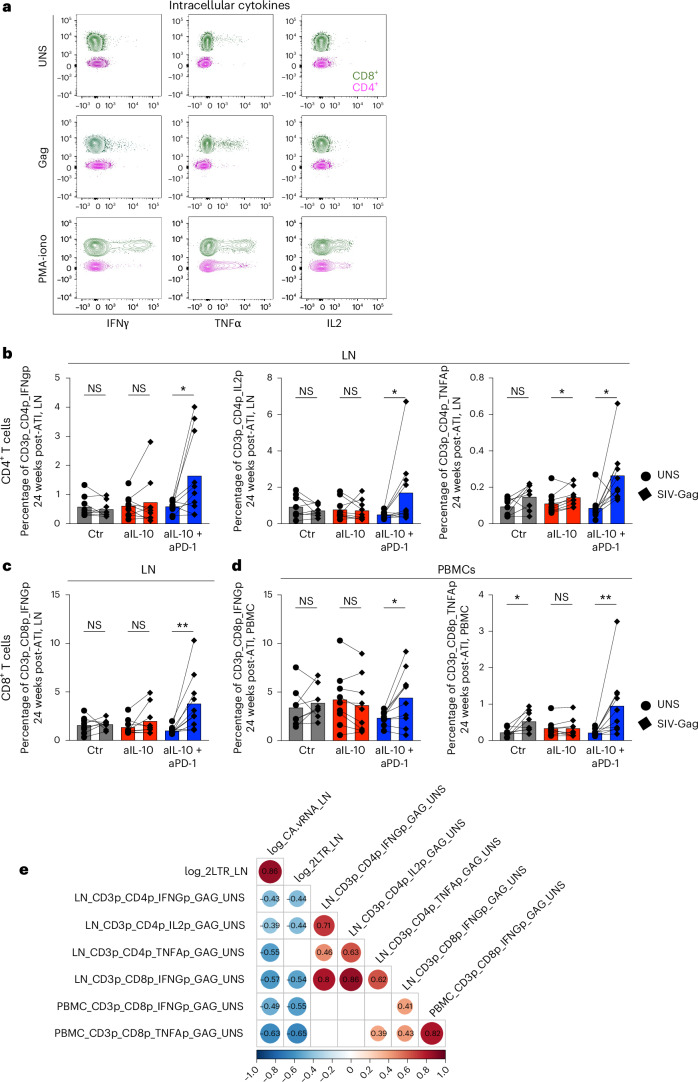
Human immunodeficiency virus (HIV) persistence during antiretroviral therapy (ART) is associated with heightened plasma interleukin-10 (IL-10) levels and PD-1 expression. We hypothesized that IL-10 and PD-1 blockade would lead to control of viral rebound following analytical treatment interruption (ATI). Twenty-eight ART-treated, simian immunodeficiency virus (SIV)mac239-infected rhesus macaques (RMs) were treated with anti-IL-10, anti-IL-10 plus anti-PD-1 (combo) or vehicle. ART was interrupted 12 weeks after introduction of immunotherapy. Durable control of viral rebound was observed in nine out of ten combo-treated RMs for >24 weeks post-ATI. Induction of inflammatory cytokines, proliferation of effector CD8+ T cells in lymph nodes and reduced expression of BCL-2 in CD4+ T cells pre-ATI predicted control of viral rebound. Twenty-four weeks post-ATI, lower viral load was associated with higher frequencies of memory T cells expressing TCF-1 and of SIV-specific CD4+ and CD8+ T cells in blood and lymph nodes of combo-treated RMs. These results map a path to achieve long-lasting control of HIV and/or SIV following discontinuation of ART.


Conflict of interest statement

G.R., Z.S., E.R., G.A., G.W., L.M., D.M.G., B.J.H. and D.J.H. are employed by and/or have financial interests in Merck & Co., Inc. A.-N.P. is a paid consultant, shareholder and board member of RPM Bioinfo Solutions. The other authors declare no competing interests.

Figures

Fig. 1
Fig. 1. Combo treatment leads to sustained VL control post-ATI.
a, Experimental design and dosing. Week 0, intravenous (i.v.) SIVMac239 infection (n = 28). Week 6 postinfection (p.i.), initiation of antiretroviral treatment. Week 66 p.i., i.v. administration of aIL-10 (10 mg kg−1). Week 8 posttreatment (PTX), i.v. administration of aPD-1 (10 mg kg−1). Doses were administered every 3–4 weeks, as illustrated by solid arrows. Week 12 PTX, Week 0 post-ATI. aIL-10 administration (n = 10; red arrows); combo-treatment administration (n = 10; blue arrows); ART control group (n = 8). Collection of blood and LN biopsies for immunological assays are indicated by vertical dotted lines (weeks 1, 7, 12, 21 and 36 PTX). b, SIVmac239 plasma VL was followed at intervals allowed by Institutional Animal Care and Use Committee. Plasma viremia (copies per milliliter of plasma) was measured longitudinally for each animal. Groups: control (black, top panel); aIL-10 (red, middle panel); combo (aIL-10+ aPD-1− blue, bottom panel). Timelines for ART, ATI and redosing (bottom panel) are indicated by vertical dotted lines. Solid lines represent median values for each group over time. RKq17 was withdrawn from the study 20 weeks post-ATI. Thin lines show individual RMs; the thick line shows the median of all RMs from each group. Each animal is identified on the right side of the graph. The y axis shows the log10 SIV RNA copies per milliliter of plasma; the x axis shows weeks p.i. c, VL AUC from week 80–101 post-ATI, Ordinary one-way analysis of variance, Tukey’s multiple comparisons test, P = 0.04. Data are presented as mean values ± s.e.m. d, Cumulative frequencies of RMs presenting with VL < 1,000 copies per milliliter of plasma in each group at least once per time point. The bottom table indicates the number of RMs per time point with VL < 1,000 copies per milliliter of plasma (black, control; red, aIL-10; blue, combo treatment). P values for AUC across groups. e, Absolute CD4+ T cell counts 24 weeks post-ATI as computed based on CBC. Sample size: control n = 8, aIL-10 n = 9, aIL-10 + aPD-1 n = 9. Two-sided Wilcoxon rank sum test control versus aIL-10 + aPD-1 P = 0.027; aIL-10 versus aIL-10 + aPD-1 P = 0.014. f, CA-vRNA levels in LNs 24 weeks post-ATI normalized according to absolute numbers of live CD4+ T cells in LNs. Sample size: control n = 8, aIL-10 n = 9, aIL-10 + aPD-1 n = 10. Two-sided Wilcoxon rank sum test control versus aIL-10 + aPD-1 P = 0.0085; aIL-10 versus aIL-10 + aPD-1 P = 0.0041. g, log10 of numbers of integrated proviruses (IPDA) in LNs over time. Black lines, P values between the indicated time points in the control group; red lines show P values between the indicated time points in the aIL-10 group; AUC between combo-treated versus control or aIL-10 treated RMs (P = 0.008). h, log10 of 2LTR in LNs over time: AUC combo-treated versus aIL-10 (P = 0.07); AUC of combo-treated versus aIL-10 or controls (P = 0.03); combo-treated (blue asterisk) week −13 versus week 9 post-ATI (P = 0.003); combo-treated versus control 9 weeks post-ATI (P = 0.030); combo-treated versus IL-10 (P = 0.07); control group pre-ATI versus 24 weeks post-ATI (P = 0.054, black line). g,h, Data are presented as mean values ± s.e.m. i, CA-vDNA in LNs pre-ATI (circles) and 24 weeks post-ATI (squares). Combo-treated versus aIL-10 alone 24 weeks post-ATI (P = 0.051). Four combo-treated RMs versus all other RMs (n = 23) at 24 weeks post-ATI (P = 0.0002). Comparison of means between groups for ei was performed with two-sided Wilcoxon rank sum test. Central line in boxplots marks the median, and the lower and upper hinges represent the first and third quartiles. Whiskers extend to the smallest and largest values within 1.5× IQR (interquartile range) from the hinges. ART, antiretroviral treatment; DTG, dolutegravir; FTC, emtricitabine; NS, not significant; PTX, postimmune treatment; TDF, tenofovir disoproxil fumarate. Source data
Fig. 2
Fig. 2. BCL-2 expression is reduced by combo-treatment.
a,b, Quantification of BCL-2 MFI in total CD4+ T cells (a) and TCM (b) in LNs pre-ATI. c,d, Modulation of BCL-2 expression over time in total CD4+ T cells (c) and CD4+ TCM cells (d). Continuous lines represent the natural cubic spline interpolation of medians across weeks. For ad, groups were compared with a linear regression model. The t-statistics for the regression coefficients were used to assess significance, and multiple test correction was performed with the Holm–Bonferroni method. e,f, Correlation between BCL-2 levels in total (e) and TCM (f) CD4+ T cells pre-ATI and CA-vRNA in LNs 24 weeks post-ATI, respectively. Black, control RMs. Red, RMs treated with aIL-10 alone. Blue, combo-treated RMs. Two-sided Spearman correlation P values and rho are shown in each plot. Missing values for some RMs are due to insufficient amounts of cells to perform flow cytometry or absence of viral readout. Sample size: control n = 7, aIL-10 n = 8, aIL-10 + aPD-1 n = 7. In boxplots, the central line marks the median, and the lower and upper hinges represent the first and third quartiles. Whiskers extend to the smallest and largest values within 1.5× IQR from the hinges. UNS, unstimulated. Source data
Fig. 3
Fig. 3. Combo treatment induces a distinct cytokine environment in plasma pre-ATI.
Longitudinal expression of 28 cytokines and chemokines was performed on plasma from all RMs. a, Principal component analysis (PCA) in plasma cytokines pre-ATI. Arrows indicate the contribution of each cytokine to data variability. PC1, 32.7%; PC2, 15,6%. Sig, significant. b, K-means and Gap statistics identified three cytokine and/or chemokine clusters over time. Cluster 3 is significantly modulated by combo-treatment pre-ATI and 9 weeks post-ATI. Cluster 3 components are shown in the table (left). Sample size: control n = 8, aIL-10 n = 9, aIL-10 + aPD-1 n = 10. Continuous lines represent the natural cubic spline interpolation of medians across weeks. The central line marks the median, and the lower and upper hinges represent the first and third quartiles. Whiskers extend to the smallest and largest values within 1.5× IQR from the hinges. Groups were compared with a linear regression model. The t-statistics for the regression coefficients were used to assess significance, and multiple test correction was performed with Holm–Bonferroni method *P-adjusted <0.05. MSD, meso scale discovery. c, Cluster 3 centroid scores pre-ATI are inversely correlated to CA-vRNA 24 weeks post-ATI in LNs. Two-sided Spearman correlation P values and rho are shown. Cluster 3, 9 weeks post-ATI, was not associated with LN CA-vRNA levels 24 weeks post-ATI (P = 0.56; rho, 0.12). d, Correlogram among pre-ATI cytokines and/or chemokines of cluster 3 and LN CA-vRNA 24 weeks post-ATI. Red circles show a positive correlation; blue circles show a negative correlation. Source data
Fig. 4
Fig. 4. Pseudotime analysis of activation, stemness and exhaustion markers in unstimulated CD4+ and CD8+ T cells from LNs.
Analysis was performed in unstimulated LN cell suspensions gated on CD4+ (af) and CD8+ (gl) T cells and included all time points used for immune monitoring (−13, −7, 0, 9 and 24 weeks post-ATI). a,g, Uniform manifold approximation and projection for dimension reduction (UMP) plot and PhenoGraph clustering. b,h, Pseudotime analysis starting from naive T cells (CD95CD28+), dark blue to yellow show less differentiated to more differentiated cells. c,i, Heatmap showing the expression of markers used for clustering (blue, low expression; red, high expression). Markers identity is shown on the left side. Dotted lines (ac) highlight Louvain cluster 9 (CD4+ T cells), which is significantly decreased in LNs from combo-treated RMs 24 weeks post-ATI. d, Back gating to validate markers that defined cluster 9. e, Frequencies of cells belonging to cluster 9 over time. Sample size: control n = 8, aIL-10 n = 9, aIL-10 + aPD-1 n = 9. f, Two-sided Spearman correlation between frequencies of cells belonging to cluster 9 and LN CA-vRNA levels at 24 weeks post-ATI. Dotted lines (gi) highlight Louvain cluster 2 (CD8+ T cells), which was significantly increased by combo treatment 24 weeks post-ATI. j, Back gating to validate markers that defined cluster 2. k, Frequencies of cells belonging to cluster 2 over time. Sample size: control n = 8, aIL-10 n = 9, aIL-10 + aPD-1 n = 9. For e and k, continuous lines represent the natural cubic spline interpolation of medians across weeks and groups were compared with a linear regression model. The t-statistics for the regression coefficients were used to assess significance, and multiple test correction was performed with Holm–Bonferroni method *P-adjusted <0.05. l, Two-sided Spearman correlation between frequencies of cells belonging to cluster 2 and LN CA-vRNA levels at 24 weeks post-ATI. In boxplots, the central line marks the median, and the lower and upper hinges represent the first and third quartiles. Whiskers extend to the smallest and largest values within 1.5× IQR from the hinges. Source data
Fig. 5
Fig. 5. Combo treatment significantly enhances SIV-specific immune responses post-ATI.
a, Gating strategy used on cell suspensions from LN (24 weeks post-ATI) for the evaluation of cytokine production by CD4+ (pink) and CD8+ (green) T cells. The same approach was applied to PBMCs. b, Frequencies of CD4+ T cells from LNs that produced IFNγ, IL-2 or TNFα spontaneously (unstimulated, UNS, shown as full circles) or in response to stimulation with a pool of SIV-Gag peptides (SIV-Gag, diamonds) 24 weeks post-ATI. c, Frequencies of CD8+ T cells from LNs that expressed IFNγ spontaneously (UNS, full circles) or in response to stimulation with a pool of SIV-Gag peptides (SIV-Gag, diamonds) 24 weeks post-ATI. d, Frequencies of CD8+ T cells from PBMCs that expressed IFNγ or TNFα spontaneously (UNS, full circles) or in response to stimulation with a pool of SIV-Gag peptides (SIV-Gag, diamonds) 24 weeks post-ATI. Pairwise comparison between UNS and SIV-gag-specific groups in ad was performed with two-sided paired t-test *P < 0.05; **P < 0.01. e, Correlogram between the levels of LN CA-vRNA and 2LTR and the fold change in the ratios of frequencies of SIV-Gag-specific T cells over unstimulated T cells 24 weeks post-ATI. Red circles, positive correlation; blue circles, negative correlation. The circle size and color shades represent rho values for the two-sided Spearman correlation. Black, control RMs; red, RMs treated with aIL-10 alone; blue, combo-treated RMs. Missing values are due to insufficient amounts of cells to perform flow cytometry or absence of viral readout. GAG, SIV-Gag-specific; PMA-Iono, phorbol myristate acetate-ionomycin. Sample size: control n = 8, aIL-10 n = 9, aIL-10 + aPD-1 n = 10. Source data
Fig. 6
Fig. 6. Feature selection.
Heatmap shows the minimal number of features that discriminate between groups and predict lower levels of LN CA-vRNA 24 weeks post-ATI. Correl, correlation; Wk, week. Source data
Extended Data Fig. 1
Extended Data Fig. 1. Antibodies, pharmacokinetics, and pharmacodynamics.
a) Representative dot plots for receptor occupancy (RO) as measured by flow cytometry using a competing anti-PD-1 antibody. LN cells were stained longitudinally for T cell markers (CD3, CD4, CD8) and with a competing anti-PD-1 antibody. Decay in frequencies of CD4+PD-1+ and CD8+PD-1+ cells were monitored over time. Blue arrows indicate first and last anti-PD-1 administration in vivo. Numbers on top of each plot represent weeks post-PTX/ATI, respectively; X axis: PD-1 staining; Y axis: CD4 staining; gated on CD3+ cells. b) Frequencies of PD-1 RO in all RMs of the combo-treated group. Dark blue lines represent median RO over time in CD4+ (left panel) and CD8+ T cells (right panel); Week 14 post-ATI: last anti-PD-1 dose. c) Longitudinal plasma IL-10 levels (pg/mL) as measured using the U-PLEX Assay Platform (Meso Scale Discovery). Sample size: Control n = 8, aIL10 n = 9, aIL10 + aPD1 n = 10. Continuous lines represent the natural cubic spline interpolation of medians across weeks. Groups were compared with a linear regression model. The t-statistics for the regression coefficients were used to assess significance, and multiple test correction was performed with Holm–Bonferroni method *p-adjusted < 0.05; **p-adjusted < 0.01; ***p-adjusted < 0.001 d) Longitudinal plasma IL-10 levels (pg/mL) as measured using Ultra-Sensitive Meso Scale assay (Merck & Co., Inc., Rahway, NJ). Sample size: aIL10 n = 10, aIL10 + aPD1 n = 10Comparison of groups means per week was performed with two-sided Wilcoxon rank sum test *p < 0.05; **p < 0.01. Continuous lines represent the polynomial spline interpolation of means across weeks. e) Loss of PD-1 RO in each combo-treated animal shown by red squares in the course of viremia post-ATI (log10 copies/mL plasma). ATI: analytical treatment interruption. LN: lymph nodes. PTX: post-immune intervention. RMs: rhesus macaques. RO: PD-1 receptor occupancy. f) Anti-drug antibody (ADA). Plasma samples from the combo-treated RMs were tested for the induction of ADA. anti-IL-10 and anti-PD-1 ADA at week 0, 8 and 34 PTX (weeks -13, -4 and 22 post-ATI, respectively); g) anti-IL-10 and anti-PD-1 ADA at week 34 PTX (22 post-ATI) for the individual RMs tested. In boxplots, the central line marks the median, and the lower and upper hinges represent the first and third quartiles. Whiskers extend to the smallest and largest values within 1.5 * IQR (inter-quartile range) from the hinges. Source data
Extended Data Fig. 2
Extended Data Fig. 2. Complete blood count (CBC) and blood chemistry over time.
WBC: white blood cells; RBC: red blood cells; HGB: hemoglobin; HCT: hematocrit; PLT: platelets; MCV: mean corpuscular volume; MCH: mean corpuscular hemoglobin; MCHC: mean corpuscular hemoglobin concentration; RDW-SD: red cell distribution width – standard deviation; RDW-CV: red cell distribution width – cell volume; MPV: mean platelet volume; T-Prot: total protein; ALB: albumin; Glob: globulin; A/G: albumin/globulin; AST: aspartate aminotransferase; ALT: alanine transaminase; ALP: alkaline phosphatase; GGT: gamma-glutamyl transferase; T-BIL: total bilirubin; BUN: blood urea nitrogen; CREAT: creatinine; Bun/Cr: blood urea nitrogen/creatinine; PHOS: phosphorus; GLUC: glucose; CAL: calcium; MAG: magnesium; Sodium: sodium; Potass: potassium; Chloride: chloride; CHOL: cholesterol, TRIG: triglycerides; AMY: amylase; CK: creatine kinase. Top lines represent the time of immune intervention. Grey area: ongoing antiretroviral therapy. Black line: control group; red line: aIL-10 group; blue line: combo treatment group. Sample size: Control n = 8, aIL10 n = 10, aIL10 + aPD1 n = 10. Data are presented as mean values +/− SEM. Source data
Extended Data Fig. 3
Extended Data Fig. 3. All viral readouts are correlated with one another.
a) Absolute CD4+ T cell counts vs log10 VL 24 weeks post-ATI in controls, RMs treated with aIL-10 alone, and combo-treated RMs (two-sided spearman correlation, rho = −0.6652, p = 0.0002). b) CD4/CD8 ratios in PBMCs 24 weeks post-ATI in controls and RMs treated with aIL-10 alone vs combo-treated RMs (two-sided t-test, p = 0.04). c) Log10 of IPDA in PBMCs over time normalized based on live absolute CD4+ T cell counts. Black lines: control RMs; red lines: RMs treated with aIL-10 alone; blue lines: combo-treated RMs; shaded area: AUC. AUC of control/anti-IL-10 treated RMs vs AUC of combo-treated RMs, two-sided t-test test p = 0.04. Data are presented as mean values +/− SEM d) Log10 2LTRs in PBMCs over time. Black lines: control RMs; red lines: RMs treated with aIL-10 alone; blue lines: combo-treated RMs; shaded area: AUC. AUC of control/aIL-10 treated RMs vs AUC of combo-treated RMs, two-sided t-test, p = 0.03; AUC of control RMs at week 9 post-ATI vs AUC of control RMs at week 24 post-ATI, p = 0.04; AUC of RMs treated with aIL-10 alone at week 0 vs AUC of RMs treated with aIL-10 alone at week 9 post-ATI, p = 0.09; AUC of RMs treated with aIL-10 alone at week 0 vs AUC of RMs treated with aIL-10 alone at week 24 post-ATI, p = 0.08; AUC of control RMs vs AUC of combo-treated RMs between week −13 and week 24 post-ATI, p = 0.07 - Anova mixed effect analysis Tukey’s test. Data are presented as mean values +/− SEM e) Two-sided spearman correlation between log10 VL and log10 CA-vRNA levels in LNs from all 3 groups of RMs 24 weeks post-ATI (rho = 0.8, p = 5.3 × 10⁻⁷). f) Two-sided spearman correlation between log10 CA-vRNA levels and log10 CA-vDNA levels in LNs from all 3 groups of RMs 24 weeks post-ATI (rho = 0.7, p = 6.5 × 10⁻⁵). g) Two-sided spearman correlation between log10 CA-vDNA levels and IPDA in LNs from all 3 groups of RMs 24 weeks post-ATI (rho = 0.78, p = 8.9 × 10⁻⁶). h) Two-sided spearman correlation between log10 IPDA and log10 2LTRs in LNs from all 3 groups of RMs 24 weeks post-ATI (rho = 0.97, p = 8.3 × 10⁻⁷). i) Heatmap showing the association between all viral readouts 24 weeks post-ATI (complete data are available for 25 RMs). Top row: Mamu-A*01 allele status (white: negative; gray: positive). Second row: group annotations (control RMs: black; RMs treated with aIL-10 alone: red; combo-treated RMs: blue). Values for some RMs are missing due to insufficient amounts of cells to perform the assessment of viral readouts. ATI: analytical treatment interruption. AUC: area under the curve. IPDA: intact proviral DNA assay. LNs: lymph nodes. ns: non-significant. VL: viral load. 2LTR: 2 long terminal repeats. Source data
Extended Data Fig. 4
Extended Data Fig. 4. IL-10 sensitizes CD4+ T-cells to BCL-2-regulated death and is antagonized by anti-IL-10.
a) Representative gating strategy for the evaluation of BCL-2 expression at the per cell level (MFI: median fluorescence intensity) in CD4+ and CD8+ T cells from LNs and PBMCs of all RMs. PBMCs from uninfected RMs (n = 6) were kept in media containing IL-10 (10 ng/mL), IL-10 (10 ng/mL) + anti-IL-10 (10 ug/mL; Merck clone IOAS9) or left unstimulated. After 24 h, Venetoclax (ABT-199) was added at different concentrations (10 nM, 100 nM, or 1,000 nM) for extra 36 h. b) Ratio of dead cells by trypan blue exclusion staining. X axis: Venetoclax dose response (10, 100 and 1,000 nM); Y axis: ratio of the number of dead cells. Red: Treatment with IL-10 alone. Blue: treatment with IL-10 + anti-IL-10. Two-way RM ANOVA, Bonferroni’s multiple comparison test. Data are presented as mean values +/− SEM; *p < 0.05; **p < 0.01; ***p < 0.001 c) Two-sided spearman correlation between the number of dead cells and the relative frequencies of CD4+BCL2+ T cells. The outer edges of the squares refer to the pre-treatment condition: red: IL-10; blue: IL-10 + aIL-10. Shades inside the squares refer to the dose of Venetoclax: white: 10 nM; gray: 100 nM; black: 1,000 nM. rho = −0.6138, p < 0.0001. LNs: lymph nodes. PBMCs: peripheral blood mononuclear cells. RM: rhesus macaques. Source data
Extended Data Fig. 5
Extended Data Fig. 5. Twenty-eight cytokines and chemokines were measured in plasma samples obtained longitudinally from all RMs.
a-b) K-means clustering and Gap statistics identified 3 clusters of cytokines and chemokines over time. Clusters 1 and 2 and their components are shown at different time points before and after ATI. Continuous lines represent the natural cubic spline interpolation of medians across weeks. c) Raw data (pg/mL plasma) for Cluster 3 cytokine and chemokine components of Cluster 3 immediately before ATI (week 0). *p < 0.05; **p < 0.01; ***p < 0.001; ****p < 0.0001 - Kruskal-Wallis test. Black: control RMs; red: RMs treated with aIL-10 alone; blue: combo-treated RMs. ATI: analytical treatment interruption. LLOD: lower limit of detection. RMs: rhesus macaques. In boxplots, the central line marks the median, and the lower and upper hinges represent the first and third quartiles. Whiskers extend to the smallest and largest values within 1.5 * IQR (inter-quartile range) from the hinges. Source data
Extended Data Fig. 6
Extended Data Fig. 6. Analysis of activation, exhaustion and stemness markers in CD4+ and CD8 + T cells.
a-c) Gating strategies for the supervised analysis of activation, exhaustion and stemness markers in CD4+ and CD8+ T cells. CD4+ T cells were classified as « effectors » or « progenitors » based on staining for T-bet, TCF1 and GrzB. CD8+ T cells were classified as « stem-like », « intermediate » or « exhausted » based on staining for CD101, TCF1, T-bet, GrzB, and CX3CR1. Expression of several activation/exhaustion markers was observed based on MFI. These analyses resulted in the identification of hundreds of discrete CD4+ and CD8+ T cell subsets, some of which were differentially modulated pre-ATI and 9- and 24 weeks post ATI in control RMs vs RMs treated with aIL-10 alone vs combo-treated RMs. d-f) Heatmaps illustrate features present pre-ATI, at 9 weeks post-ATI and at 24 weeks post-ATI that were significantly associated with LN CA-vRNA 24 weeks post-ATI. The top row represents log10 CA-vRNA levels, the second row represents group annotation (black: control RMs; red: RMs treated with aIL-10 alone; blue: combo-treated RMs). Arrows indicate the major features that were highlighted in this analysis. ATI: analytical treatment interruption. CA-vRNA: cell-associated viral RNA. LNs: lymph nodes. PBMCs: peripheral blood mononuclear cells. RMs: rhesus macaques. Source data
Extended Data Fig. 7
Extended Data Fig. 7. Pseudotime analysis in unstimulated T cells from LNs at 24 weeks post -ATI.
This analysis was performed as described under Methods, with the earliest trajectory in pseudotime manually defined by naïve T cells (CD95CD28+). The progression of the pseudotime was defined by the positioning of cells based on the modulation of the relative expression (MFI) of markers of stemness (that is, TCF-1), activation (that is, ID2, GrzB, T-bet) and exhaustion (that is, TOX, IRF4). CD4+ and CD8+ T cell clusters and the analysis of their pseudotime is shown (panels a and c, respectively). X axis: Louvain cluster numbers; Y axis: relative frequency of each cluster in each of the 3 groups: control RMs (black), RMs treated with aIL-10 alone (red), and combo-treated RMs (blue). The bottom bar below the X axis from dark blue to yellow reflects the pseudotime scale from less (dark blue) to more differentiated cells (yellow). The bottom arrows highlight the fact that CD4+ T cells accumulated in the later part of the pseudotime (a), while CD8+ T cells accumulated at the beginning of the pseudotime (c). The MFI of each marker used to define the clusters (Phenograph) and pseudotime progression (Monocle3 pseudotime analysis) are shown for CD4+ (b) and CD8+ (d) T cells. The line going from the bottom to the top in the UMAPs depicts the trajectory of the cells on the pseudotime scale. The color gradient (blue to red) depicts the lowest to the highest per-cell level of expression for each marker, annotated in the bar in the right of each plot with its respective expression (MFI). The squares in b and d represent Cluster 9 and Cluster 2 for CD4+ and CD8+ T cells, respectively. Comparison of means between groups in a and c was performed with two-sided Wilcoxon rank sum test and p-value correction for multiple tests was performed with Benjamini-Hochberg method. *p < 0.05. ATI: analytical treatment interruption; MFI: median fluorescence intensity; RMs: rhesus macaques; UMAP: uniform manifold approximation and projection for dimension reduction. Sample size: Control n = 8, aIL10 n = 9, aIL10 + aPD1 n = 9. In boxplots, the central line marks the median, and the lower and upper hinges represent the first and third quartiles. Whiskers extend to the smallest and largest values within 1.5 * IQR (inter-quartile range) from the hinges. Source data
Extended Data Fig. 8
Extended Data Fig. 8. Modulation of SIV-specific features over time (weeks post-ATI).
a) Fold change (FC) in production of IFN-γ (left panel), IL-2 (middle panel) and TNF-α (right panel) following stimulation with SIV peptides over unstimulated (UNS) in CD4+ cells from LNs of control RMs (black), RMs treated with aIL-10 only (red) and combo-treated RMs (blue) at various time points during follow-up pre- and post-ATI. b) FC in production of IFN-γ following stimulation with SIV peptides over unstimulated (UNS) in CD8+ cells from LNs of control RMs (black), RMs treated with aIL-10 only (red) and combo-treated RMs (blue) at various time points during follow-up pre- and post-ATI. c) FC in production of IFN-γ (left panel) and TNF-α (right panel) following stimulation with SIV peptides over unstimulated (UNS) in CD8+ cells from PBMCs of control RMs (black), RMs treated with aIL-10 only (red) and combo-treated RMs (blue) at various time points during follow-up pre- and post-ATI. For figures a-c, continuous lines represent the natural cubic spline interpolation of medians across weeks and groups were compared with a linear regression model. The t-statistics for the regression coefficients were used to assess significance, and multiple test correction was performed with Holm–Bonferroni method. Sample size a-c: Control n = 8, aIL10 n = 9, aIL10 + aPD1 n = 10. d-f) Two-sided spearman correlation of the FC of each feature 24 weeks post-ATI and CA-vRNA levels in LNs of control RMs (black), RMs treated with aIL-10 only (red) and combo-treated RMs (blue) 24 weeks post-ATI. g-i) Two-sided spearman correlation of the FC of each feature 24 weeks post-ATI and CA-2LTR levels in LNs of control RMs (black), RMs treated with aIL-10 only (red) and combo-treated RMs (blue) 24 weeks post-ATI. Rho and p-values are shown in the plots. *p < 0.05. ATI: analytical treatment interruption; CA-2LTR: cell-associated 2-LTR circles; CA-vRNA: cell-associated viral RNA; FC: fold change; LNs: lymph nodes; PBMCs: peripheral blood mononuclear cells; RMs: rhesus macaques; SIV: simian immunodeficiency virus; UNS: unstimulated. In boxplots, the central line marks the median, and the lower and upper hinges represent the first and third quartiles. Whiskers extend to the smallest and largest values within 1.5 * IQR (inter-quartile range) from the hinges. Source data
Extended Data Fig. 9
Extended Data Fig. 9. Combo and aIL-10 specific markers.
Heatmap representing the top significantly different flow cytometry markers between RMs treated with aIL-10 alone (red; n = 8) and combo-treated RMs (blue; n = 7). Rows represent flow cytometry markers (p < 0.05), and columns represent samples. Flow markers are represented as a variable-wise standardized value (Z-score). Red and blue correspond to up- and downregulated expression of flow cytometry markers, respectively. Levels of CA-vRNA in LNs measured at 24 weeks post-ATI are displayed at the top of the heatmap and Spearman correlation was used to assess the statistical significance of correlations (p < 0.05) between flow cytometry markers and LN CA-vRNA levels. ATI: analytical treatment interruption; CA-vRNA: cell-associated viral RNA; LNs: lymph nodes; RMs: rhesus macaques. Source data
Extended Data Fig. 10
Extended Data Fig. 10. Longitudinal plots of selected features that discriminate groups and predict lower levels of LN CA-vRNA 24 weeks post-ATI.
a) Features that were significantly downregulated and b) upregulated in combo-treated RMs that were associated with levels of CA-vRNA in LNs 24 weeks post-ATI. Black: control RMs; red: RMs treated with aIL-10 alone; blue: combo-treated RMs. ATI: analytical treatment interruption; CA-vRNA: cell-associated viral RNA; LNs: lymph nodes; RMs: rhesus macaques. Continuous lines represent the natural cubic spline interpolation of medians across weeks. Groups were compared with a linear regression model. The t-statistics for the regression coefficients were used to assess significance, and multiple test correction was performed with Holm–Bonferroni method. *p-adjusted < 0.05; **p-adjusted < 0.01. Sample size: Control n = 8, aIL10 n = 9, aIL10 + aPD1 n = 10. In boxplots, the central line marks the median, and the lower and upper hinges represent the first and third quartiles. Whiskers extend to the smallest and largest values within 1.5 * IQR (inter-quartile range) from the hinges. Source data

References

    1. Pourcher, V., Gourmelen, J., Bureau, I. & Bouee, S. Comorbidities in people living with HIV: an epidemiologic and economic analysis using a claims database in France. PLoS ONE15, e0243529 (2020). - PMC - PubMed
    1. Galvez, C. et al. Atlas of the HIV-1 reservoir in peripheral CD4 T cells of individuals on successful antiretroviral therapy. mBio.12, e0307821 (2021). - PMC - PubMed
    1. Chomont, N. et al. HIV reservoir size and persistence are driven by T cell survival and homeostatic proliferation. Nat. Med.15, 893–900 (2009). - PMC - PubMed
    1. Salantes, D. B. et al. HIV-1 latent reservoir size and diversity are stable following brief treatment interruption. J. Clin. Invest.128, 3102–3115 (2018). - PMC - PubMed
    1. Tian, Y., Mollo, S. B., Harrington, L. E. & Zajac, A. J. IL-10 regulates memory T cell development and the balance between Th1 and follicular Th cell responses during an acute viral infection. J. Immunol.197, 1308–1321 (2016). - PMC - PubMed

MeSH terms

Substances

LinkOut - more resources