. 2024 Nov;30(11):3369-3380.
doi: 10.1038/s41591-024-03214-0. Epub 2024 Sep 12.

An open-source framework for end-to-end analysis of electronic health record data

Affiliations

An open-source framework for end-to-end analysis of electronic health record data

Lukas Heumos et al. Nat Med. 2024 Nov.

Abstract

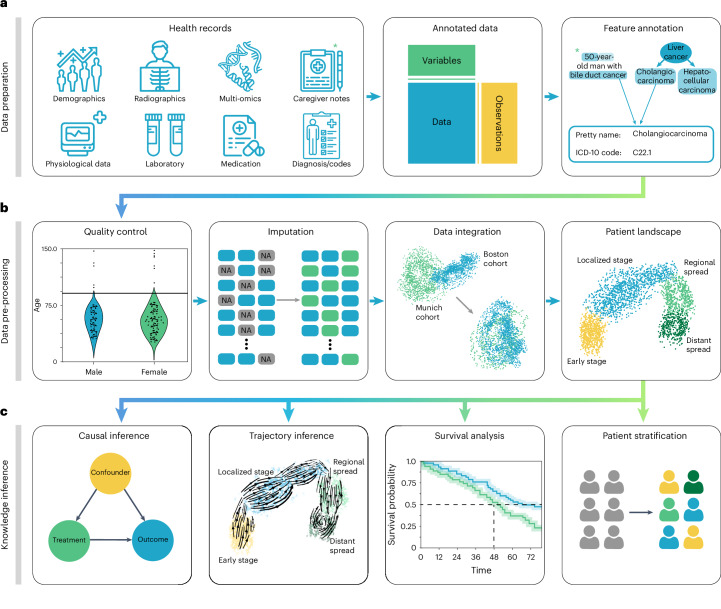
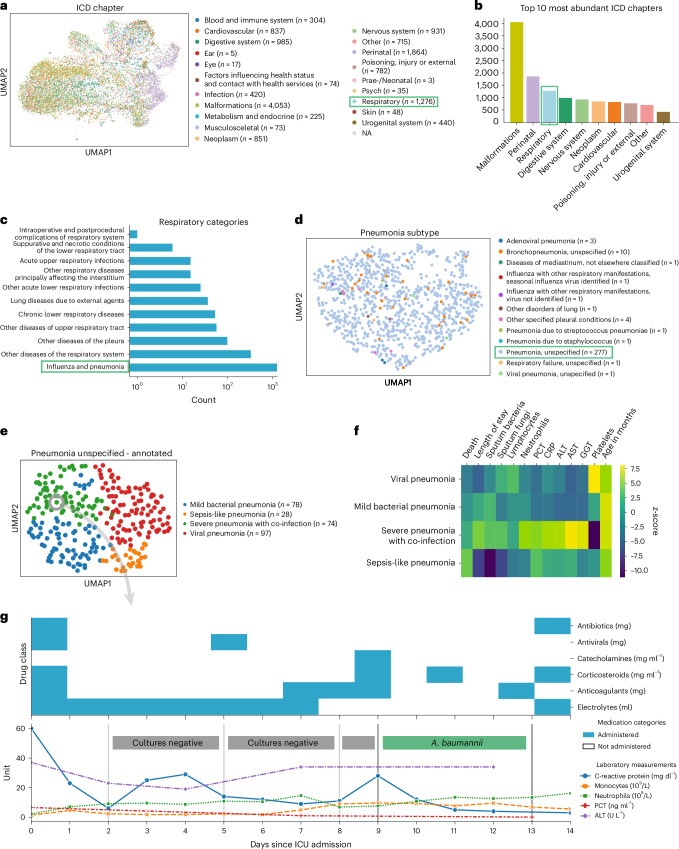
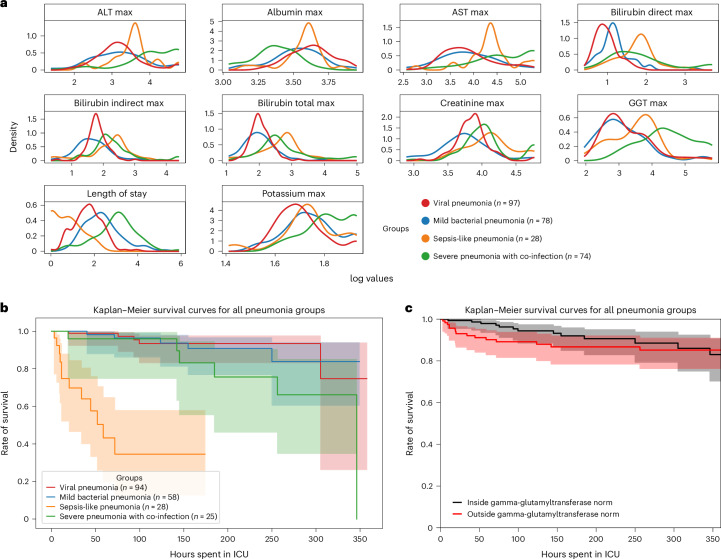
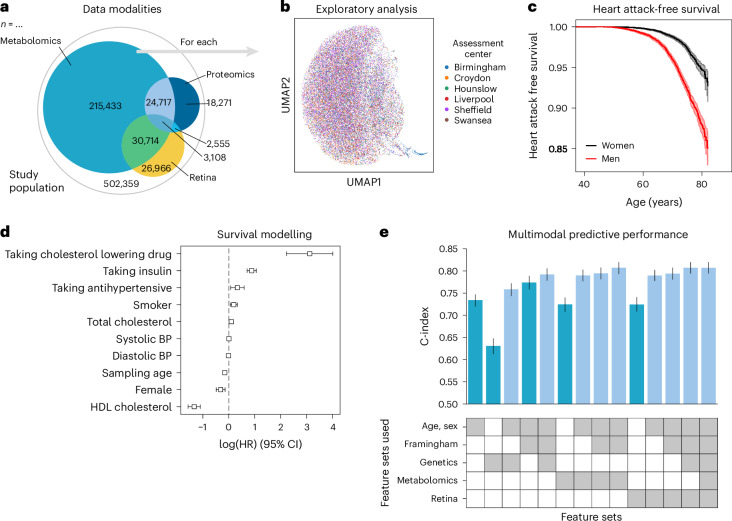
With progressive digitalization of healthcare systems worldwide, large-scale collection of electronic health records (EHRs) has become commonplace. However, an extensible framework for comprehensive exploratory analysis that accounts for data heterogeneity is missing. Here we introduce ehrapy, a modular open-source Python framework designed for exploratory analysis of heterogeneous epidemiology and EHR data. ehrapy incorporates a series of analytical steps, from data extraction and quality control to the generation of low-dimensional representations. Complemented by rich statistical modules, ehrapy facilitates associating patients with disease states, differential comparison between patient clusters, survival analysis, trajectory inference, causal inference and more. Leveraging ontologies, ehrapy further enables data sharing and training EHR deep learning models, paving the way for foundational models in biomedical research. We demonstrate ehrapy's features in six distinct examples. We applied ehrapy to stratify patients affected by unspecified pneumonia into finer-grained phenotypes. Furthermore, we reveal biomarkers for significant differences in survival among these groups. Additionally, we quantify medication-class effects of pneumonia medications on length of stay. We further leveraged ehrapy to analyze cardiovascular risks across different data modalities. We reconstructed disease state trajectories in patients with severe acute respiratory syndrome coronavirus 2 (SARS-CoV-2) based on imaging data. Finally, we conducted a case study to demonstrate how ehrapy can detect and mitigate biases in EHR data. ehrapy, thus, provides a framework that we envision will standardize analysis pipelines on EHR data and serve as a cornerstone for the community.


Conflict of interest statement

Competing interests L. Heumos is an employee of LaminLabs. F.J.T. consults for Immunai Inc., Singularity Bio B.V., CytoReason Ltd. and Omniscope Ltd. and has ownership interest in Dermagnostix GmbH and Cellarity. The remaining authors declare no competing interests.

Figures

Fig. 1
Fig. 1. Schematic overview of EHR analysis with ehrapy.
a, Heterogeneous health data are first loaded into memory as an AnnData object with patient visits as observational rows and variables as columns. Next, the data can be mapped against ontologies, and key terms are extracted from free text notes. b, The EHR data are subject to quality control where low-quality or spurious measurements are removed or imputed. Subsequently, numerical data are normalized, and categorical data are encoded. Data from different sources with data distribution shifts are integrated, embedded, clustered and annotated in a patient landscape. c, Further downstream analyses depend on the question of interest and can include the inference of causal effects and trajectories, survival analysis or patient stratification.
Fig. 2
Fig. 2. PIC dataset overview and annotation of patients diagnosed with unspecified pneumonia.
a, UMAP of all patient visits in the ICU with primary discharge diagnosis grouped by ICD chapter. b, The prevalence of respiratory diseases prompted us to investigate them further. c, Respiratory categories show the abundance of influenza and pneumonia diagnoses that we investigated more closely. d, We observed the ‘unspecified pneumonia’ subgroup, which led us to investigate and annotate it in more detail. e, The previously ‘unspecified pneumonia’-labeled patients were annotated using several clinical features (Extended Data Fig. 5), of which the most important ones are shown in the heatmap (f). g, Example disease progression of an individual child with pneumonia illustrating pharmacotherapy over time until positive A. baumannii swab.
Fig. 3
Fig. 3. Survival analysis of patients diagnosed with unspecified pneumonia.
a, Line plots of major hepatic system laboratory measurements per group show variance in the measurements per pneumonia group. b, Kaplan–Meier survival curves demonstrate lower survival for ‘sepsis-like’ and ‘severe pneumonia with co-infection’ groups. c, Kaplan–Meier survival curves for children with GGT measurements outside the norm range display lower survival.
Fig. 4
Fig. 4. Causal inference of LOS affected by different medication types.
a, ehrapy’s causal module is based on the strategy of the tool ‘dowhy’. Here, EHR data containing treatment, outcome and measurements and a causal graph serve as input for causal effect quantification. The process includes the identification of the target estimand based on the causal graph, the estimation of causal effects using various models and, finally, refutation where sensitivity analyses and refutation tests are performed to assess the robustness of the results and assumptions. b, Curated causal graph using age, liver damage and inflammation markers as disease progression proxies together with medications as interventions to assess the causal effect on length of ICU stay. c, Determined causal effect strength on LOS in days of administered medication categories.
Fig. 5
Fig. 5. Analysis of myocardial infarction risk in the UKB.
a, The UKB includes 502,359 participants from 22 assessment centers. Most participants have genetic data (97%) and physical measurement data (93%), but fewer have data for complex measures, such as metabolomics, retinal imaging or proteomics. b, We found a distinct cluster of individuals (bottom right) from the Birmingham assessment center in the retinal imaging data, which is an artifact of the image acquisition process and was, thus, excluded. c, Myocardial infarctions are recorded for 15% of the male and 7% of the female study population. Kaplan–Meier estimators with 95% CIs are shown. d, For every modality combination, a linear Cox proportional hazards model was fit to determine the prognostic potential of these for myocardial infarction. Cardiovascular risk factors show expected positive log hazard ratios (log (HRs)) for increased blood pressure or total cholesterol and negative ones for sampling age and systolic blood pressure (BP). log (HRs) with 95% CIs are shown. e, Combining all features yields a C-index of 0.81. ce, Error bars indicate 95% CIs (n = 29,216).
Fig. 6
Fig. 6. Recovery of disease severity trajectory in COVID-19 chest x-ray images.
a, Randomly selected chest x-ray images from the BrixIA dataset demonstrate its variance. b, UMAP visualization of the BrixIA dataset embedding shows a separation of disease severity classes. c, Calculated pseudotime for all images increases with distance to the ‘normal’ images. d, Stream projection of fate mapping in UMAP space showcases disease severity trajectory of the COVID-19 chest x-ray images.
Extended Data Fig. 1
Extended Data Fig. 1. Overview of the paediatric intensive care database (PIC).
The database consists of several tables corresponding to several data modalities and measurement types. All tables colored in green were selected for analysis and all tables in blue were discarded based on coverage rate. Despite the high coverage rate, we discarded the ‘OR_EXAM_REPORTS’ table because of the lack of detail in the exam reports.
Extended Data Fig. 2
Extended Data Fig. 2. Preprocessing of the Paediatric Intensive Care (PIC) dataset with ehrapy.
(a) Heterogeneous data of the PIC database was stored in ‘data’ (matrix that is used for computations) and ‘observations’ (metadata per patient visit). During quality control, further annotations are added to the ‘variables’ (metadata per feature) slot. (b) Preprocessing steps of the PIC dataset. (c) Example of the function calls in the data analysis pipeline that resembles the preprocessing steps in (B) using ehrapy.
Extended Data Fig. 3
Extended Data Fig. 3. Missing data distribution for the ‘youths’ group of the PIC dataset.
The x-axis represents the percentage of missing values in each feature. The y-axis reflects the number of features in each bin with text labels representing the names of the individual features.
Extended Data Fig. 4
Extended Data Fig. 4. Patient selection during analysis of the PIC dataset.
Filtering for the pneumonia cohort of the youths filters out care units except for the general intensive care unit and the pediatric intensive care unit.
Extended Data Fig. 5
Extended Data Fig. 5. Feature rankings of stratified patient groups.
Scores reflect the z-score underlying the p-value per measurement for each group. Higher scores (above 0) reflect overrepresentation of the measurement compared to all other groups and vice versa. (a) By clinical chemistry. (b) By liver markers. (c) By medication type. (d) By infection markers.
Extended Data Fig. 6
Extended Data Fig. 6. Liver marker value progression for the ‘youths’ group and Kaplan-Meier curves.
(a) Viral and severe pneumonia with co-infection groups display enriched gamma-glutamyl transferase levels in blood serum. (b) Aspartate transferase (AST) and Alanine transaminase (ALT) levels are enriched for severe pneumonia with co-infection during early ICU stay. (c) and (d) Kaplan-Meier curves for ALT and AST demonstrate lower survivability for children with measurements outside the norm.
Extended Data Fig. 7
Extended Data Fig. 7. Overview of medication categories used for causal inference.
(a) Feature engineering process to group administered medications into medication categories using drugbank. (b) Number of medications per medication category. (c) Number of patients that received (dark blue) and did not receive specific medication categories (light blue).
Extended Data Fig. 8
Extended Data Fig. 8. UK-Biobank data overview and quality control across modalities.
(a) UMAP plot of the metabolomics data demonstrating a clear gradient with respect to age at sampling, and (b) type 2 diabetes prevalence. (c) Analogously, the features derived from retinal imaging show a less pronounced age gradient, and (d) type 2 diabetes prevalence gradient. (e) Stratifying myocardial infarction risk by the type 2 diabetes comorbidity confirms vastly increased risk with a prior type 2 (T2D) diabetes diagnosis. Kaplan-Meier estimators with 95 % confidence intervals are shown. (f) Similarly, the polygenic risk score for coronary heart disease used in this work substantially enriches myocardial infarction risk in its top 5% percentile. Kaplan-Meier estimators with 95 % confidence intervals are shown. (g) UMAP visualization of the metabolomics features colored by the assessment center shows no discernable biases. (A-G) n = 29,216.
Extended Data Fig. 9
Extended Data Fig. 9. UK-Biobank retina derived feature quality control.
(a) Leiden Clustering of retina derived feature space. (b) Comparison of ‘overall retinal pigment epithelium (RPE) thickness’ values between cluster 5 (n = 301) and the rest of the population (n = 28,915). (c) RPE thickness in the right eye outliers on the UMAP largely corresponds to cluster 5. (d) Log ratio of top and bottom 5 fields in obs dataframe between cluster 5 and the rest of the population. (e) Image Quality of the optical coherence tomography scan as reported in the UKB. (f) Minimum motion correlation quality control indicator. (g) Inner limiting membrane (ILM) quality control indicator. (D-G) Data are shown for the right eye only, comparable results for the left eye are omitted. (A-G) n = 29,216.
Extended Data Fig. 10
Extended Data Fig. 10. Bias detection and mitigation study on the Diabetes 130-US hospitals dataset (n = 101,766 hospital visits, one patient can have multiple visits).
(a) Filtering to the visits of Medicare recipients results in an increase of Caucasians. (b) Proportion of visits where Hb1Ac measurements are recorded, stratified by admission type. Adjusted P values were calculated with Chi squared tests and Bonferroni correction (Adjusted P values: Emergency vs Referral 3.3E-131, Emergency vs Other 1.4E-101, Referral vs Other 1.6E-4.) (c) Normalizing feature distributions jointly vs. separately can mask distribution differences. (d) Imputing the number of medications for visits. Onto the complete data (blue), MCAR (30% missing data) and MAR (38% missing data) were introduced (orange), with the MAR mechanism depending on the time in hospital. Mean imputation (green) can reduce the variance of the distribution under MCAR and MAR mechanisms, and bias the center of the distribution under an MAR mechanism. Multiple imputation, such as MissForest imputation can impute meaningfully even in MAR cases, when having access to variables involved in the MAR mechanism. Each boxplot represents the IQR of the data, with the horizontal line inside the box indicating the median value. The left and right bounds of the box represent the first and third quartiles, respectively. The ‘whiskers’ extend to the minimum and maximum values within 1.5 times the IQR from the lower and upper quartiles, respectively. (e) Predicting the early readmission within 30 days after release on a per-stay level. Balanced accuracy can mask differences in selection and false negative rate between sensitive groups.

References

    1. Goldberger, A. L. et al. PhysioBank, PhysioToolkit, and PhysioNet: components of a new research resource for complex physiologic signals. Circulation101, E215–E220 (2000). - PubMed
    1. Atasoy, H., Greenwood, B. N. & McCullough, J. S. The digitization of patient care: a review of the effects of electronic health records on health care quality and utilization. Annu. Rev. Public Health40, 487–500 (2019). - PubMed
    1. Jamoom, E. W., Patel, V., Furukawa, M. F. & King, J. EHR adopters vs. non-adopters: impacts of, barriers to, and federal initiatives for EHR adoption. Health (Amst.)2, 33–39 (2014). - PMC - PubMed
    1. Rajkomar, A. et al. Scalable and accurate deep learning with electronic health records. NPJ Digit. Med.1, 18 (2018). - PMC - PubMed
    1. Wolf, A. et al. Data resource profile: Clinical Practice Research Datalink (CPRD) Aurum. Int. J. Epidemiol.48, 1740–1740g (2019). - PMC - PubMed