. 2024 Nov;4(11):1562-1581.
doi: 10.1038/s43587-024-00694-0. Epub 2024 Sep 12.

Aged bone marrow macrophages drive systemic aging and age-related dysfunction via extracellular vesicle-mediated induction of paracrine senescence

Affiliations

Aged bone marrow macrophages drive systemic aging and age-related dysfunction via extracellular vesicle-mediated induction of paracrine senescence

Jing Hou et al. Nat Aging. 2024 Nov.

Abstract

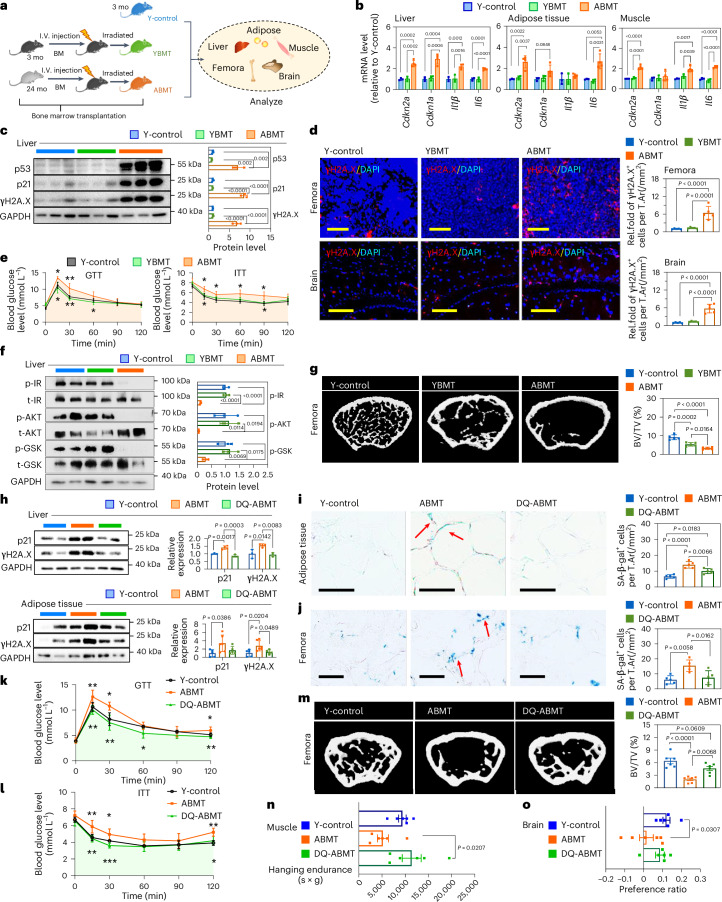
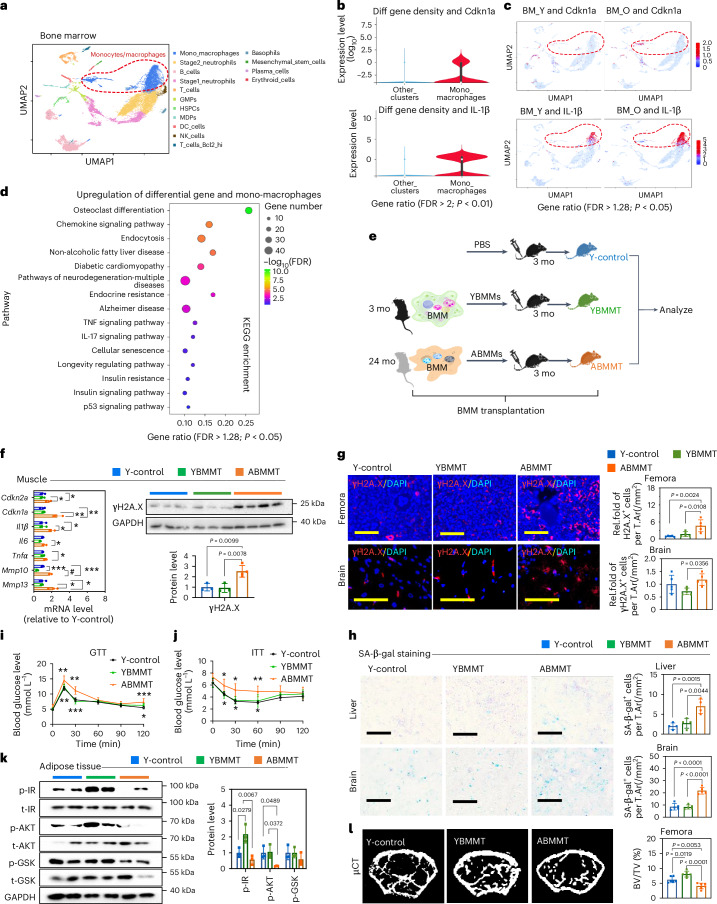
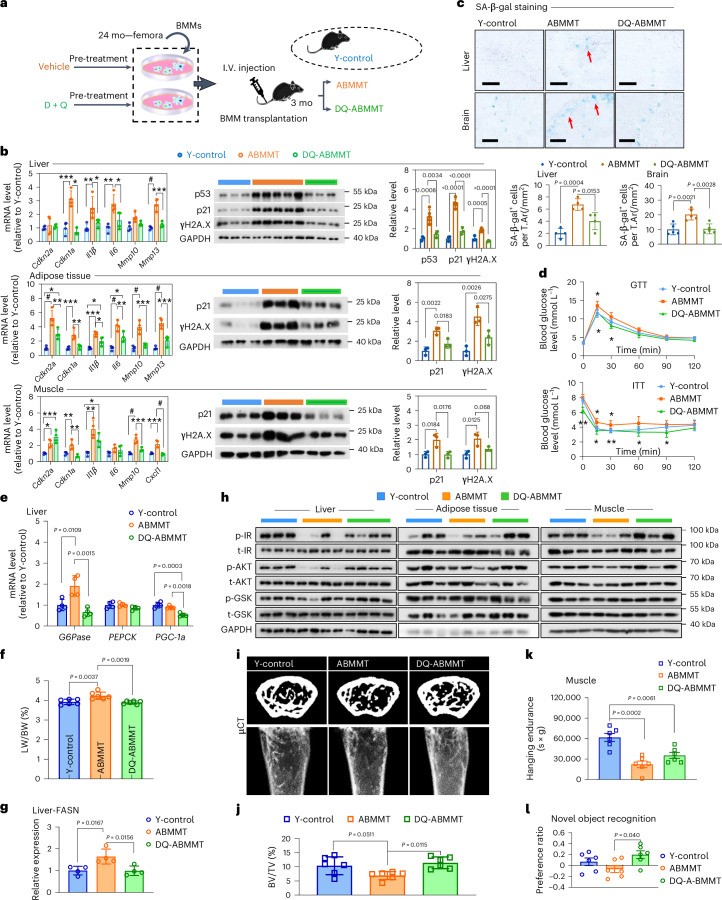
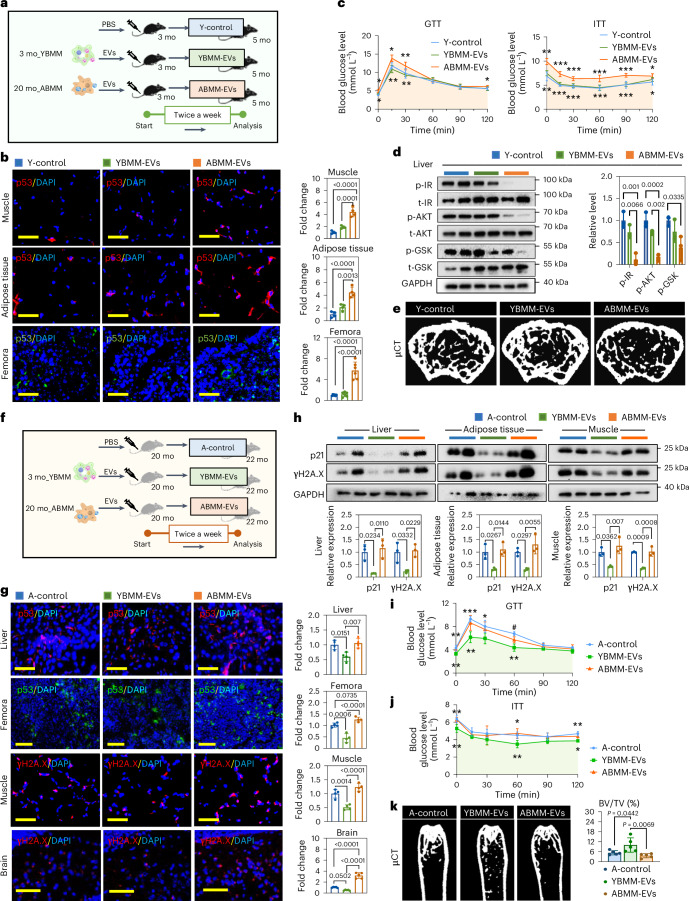
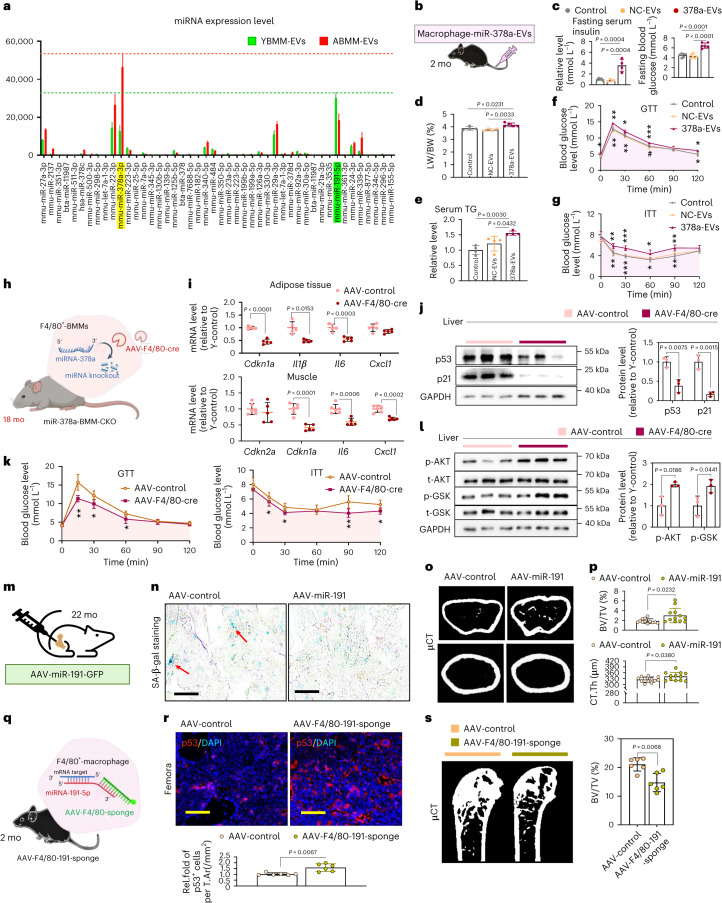
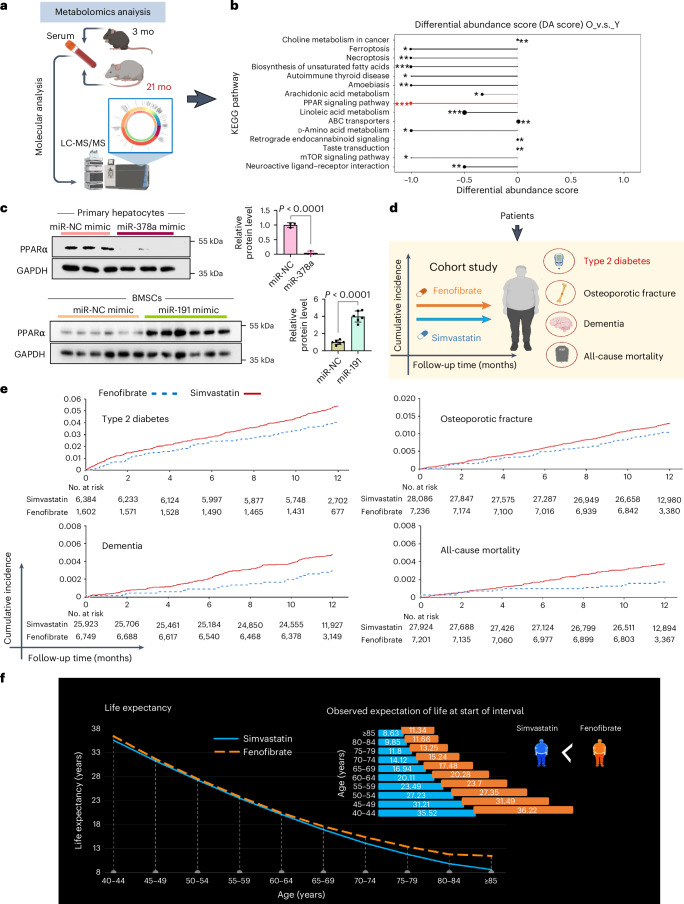
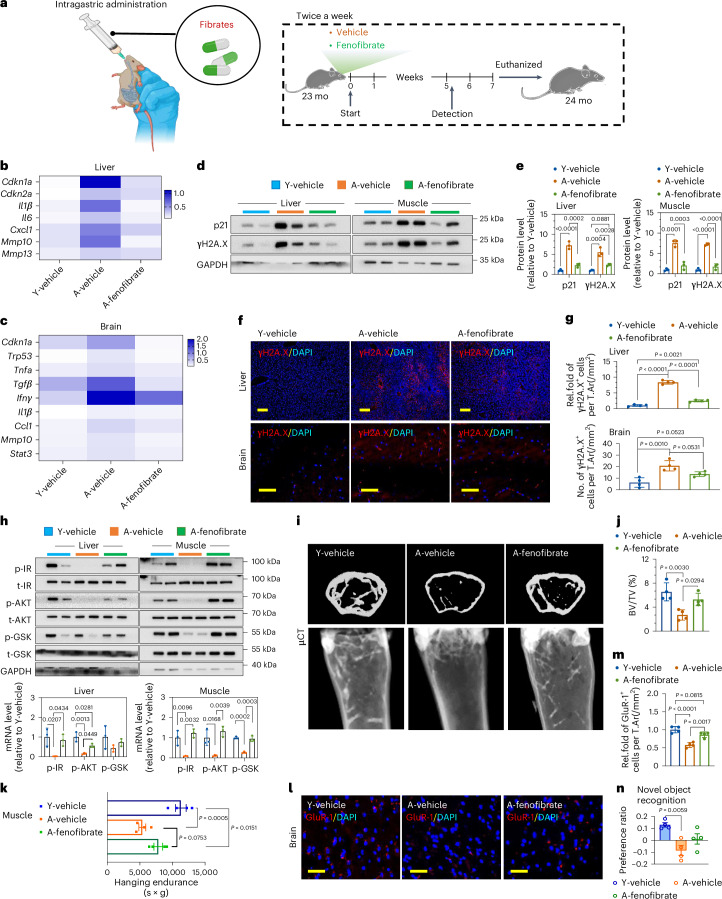
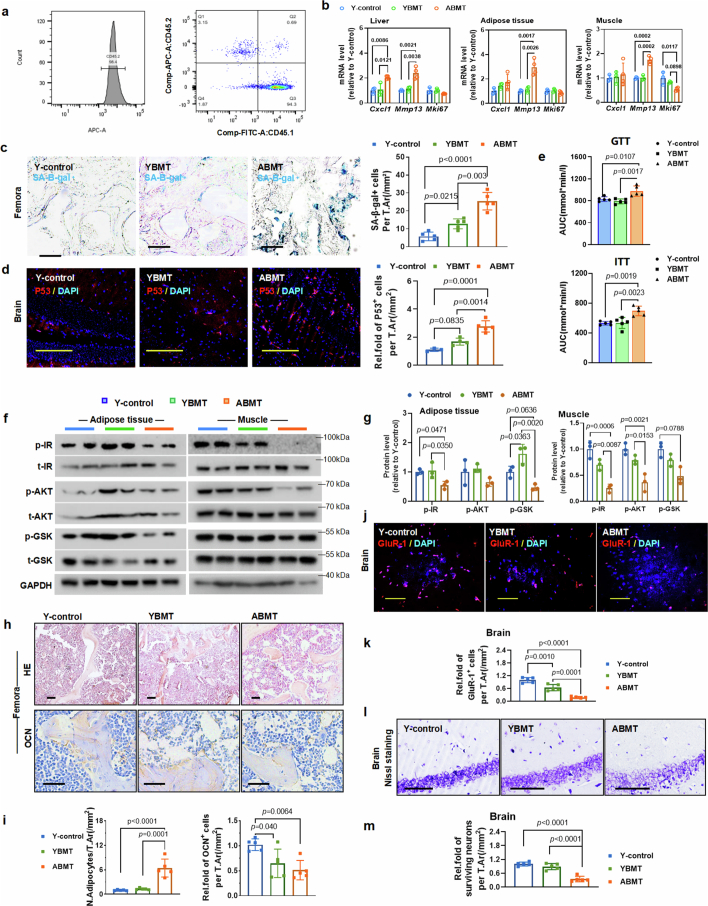
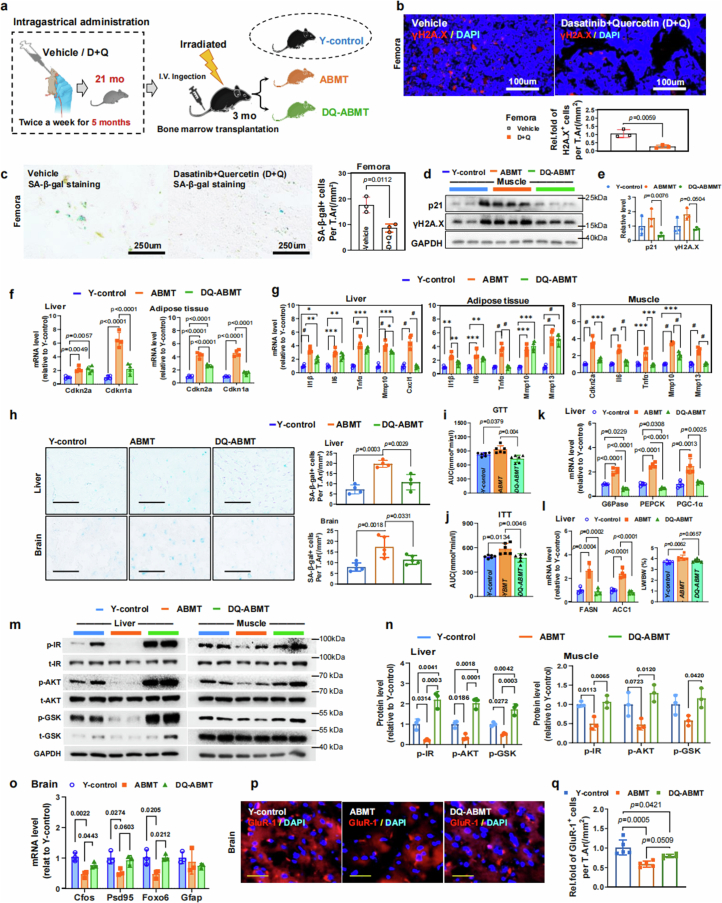
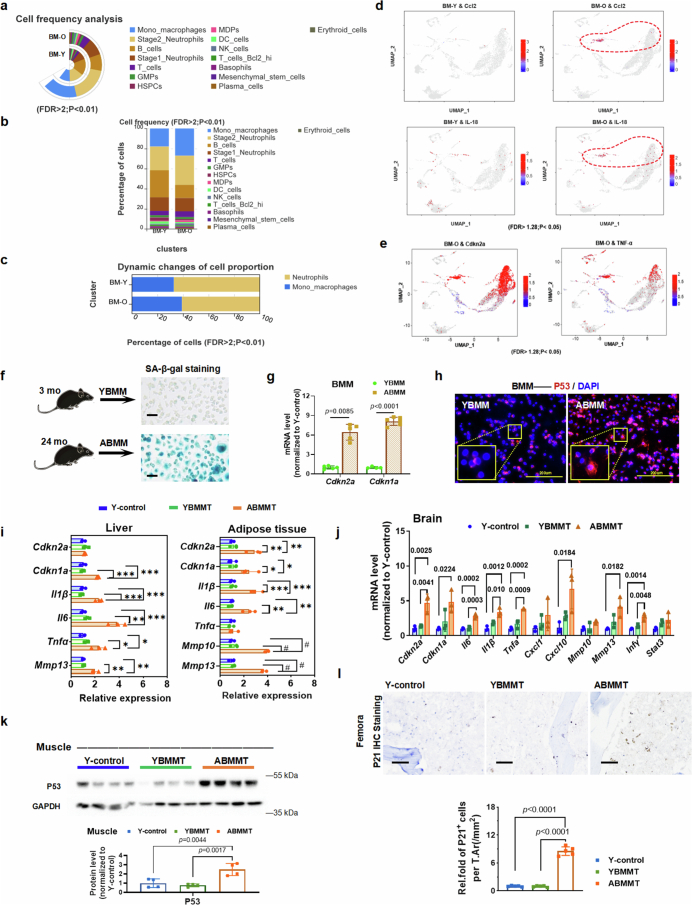
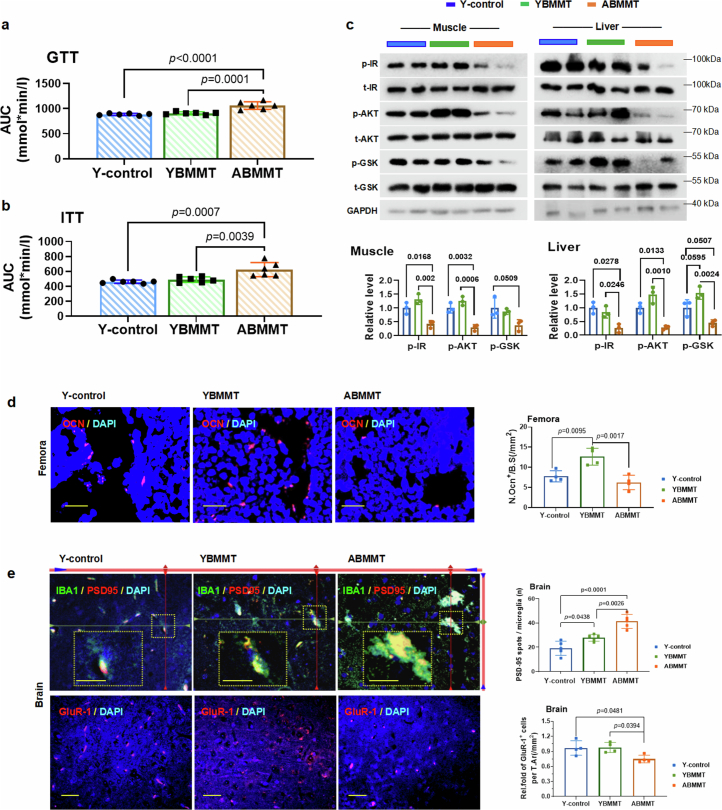
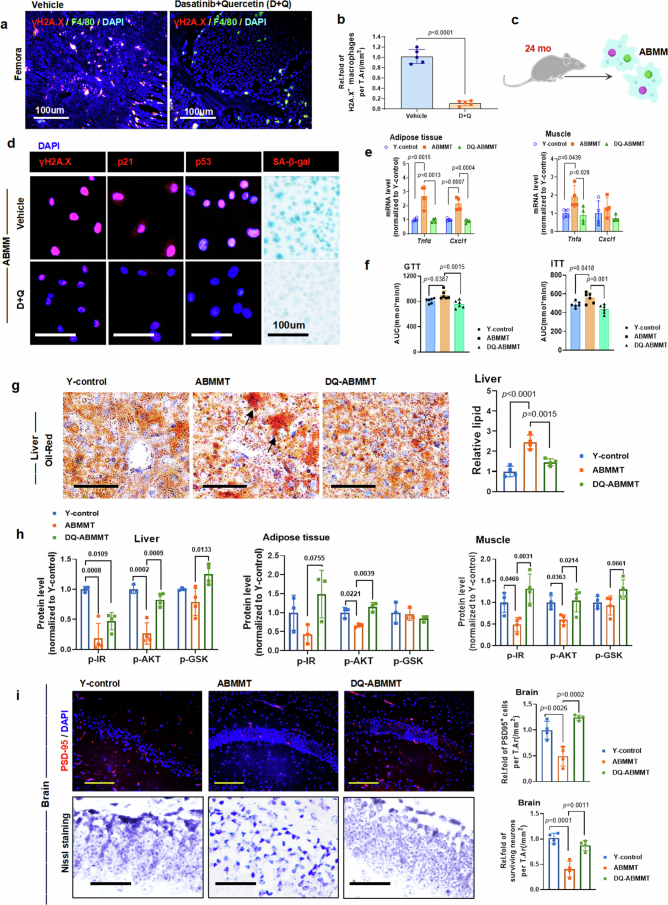
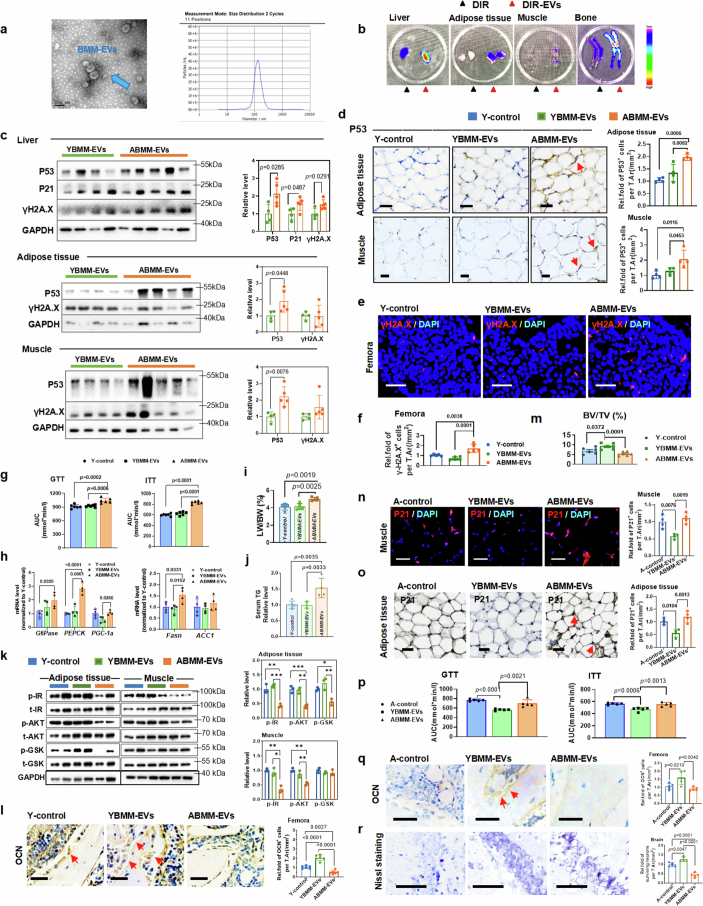
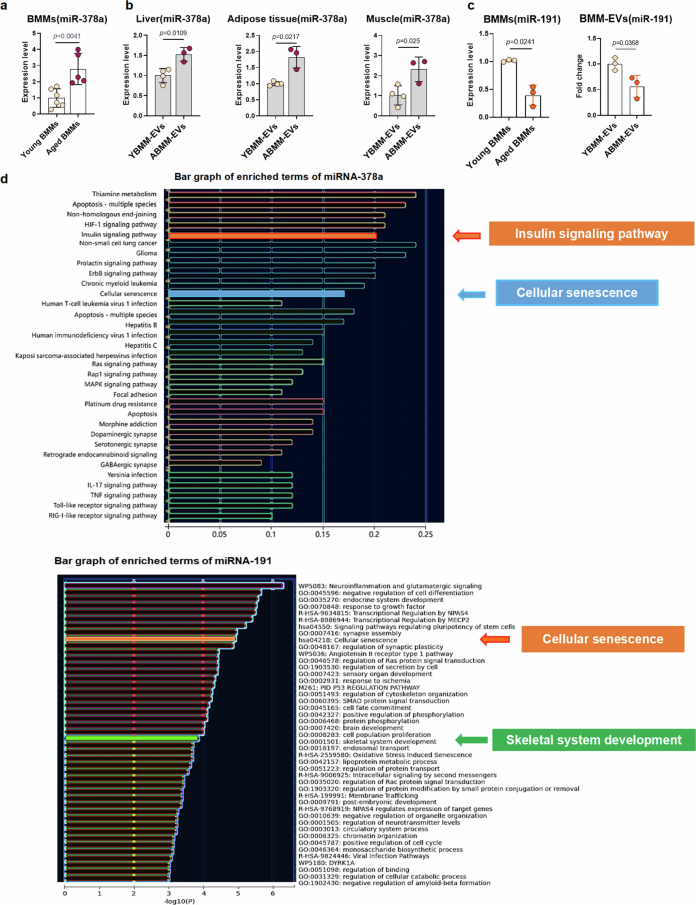
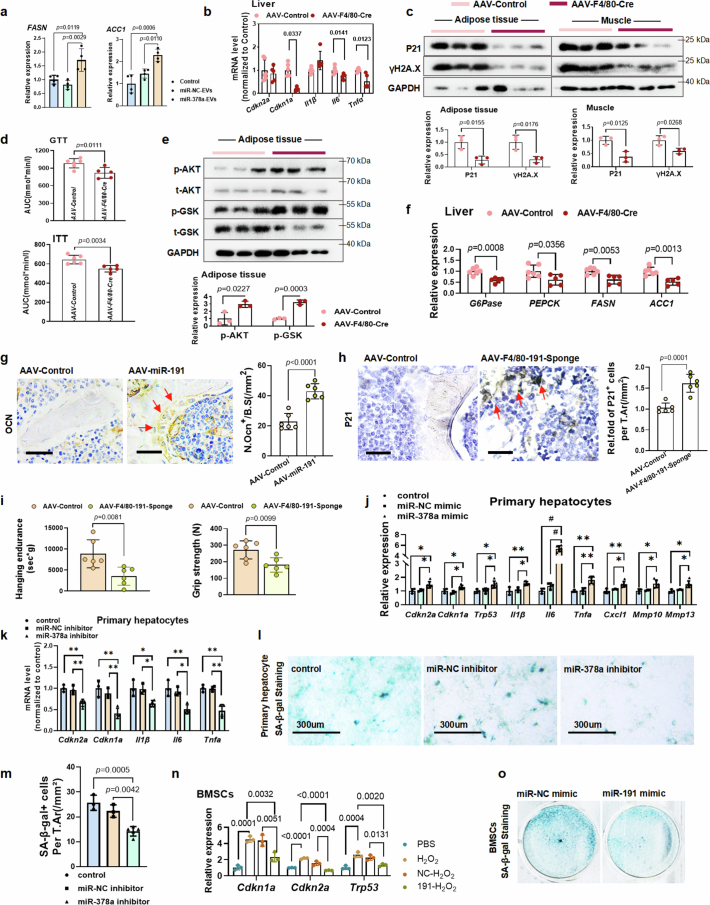
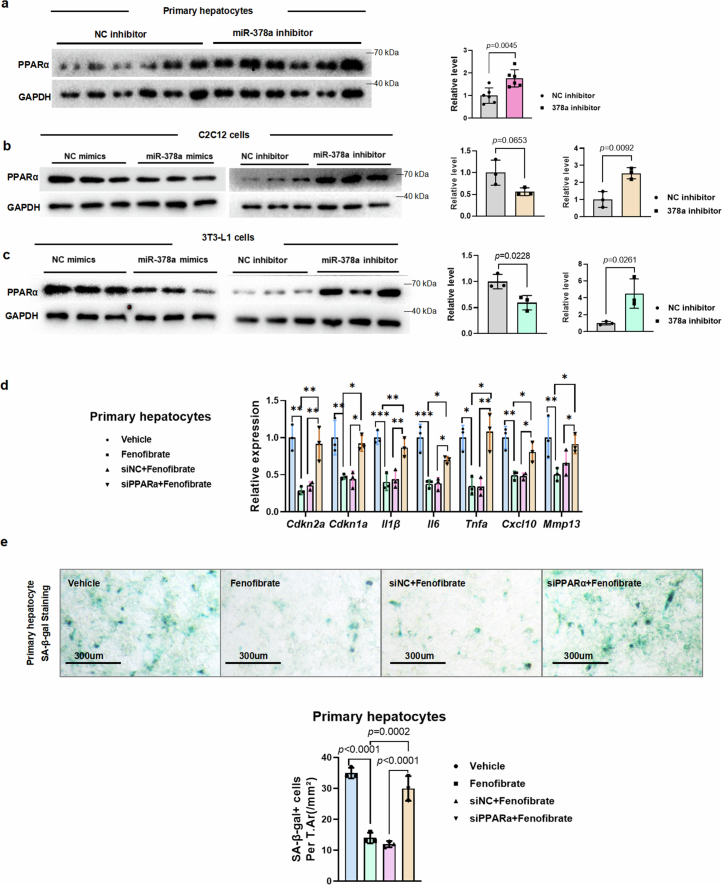
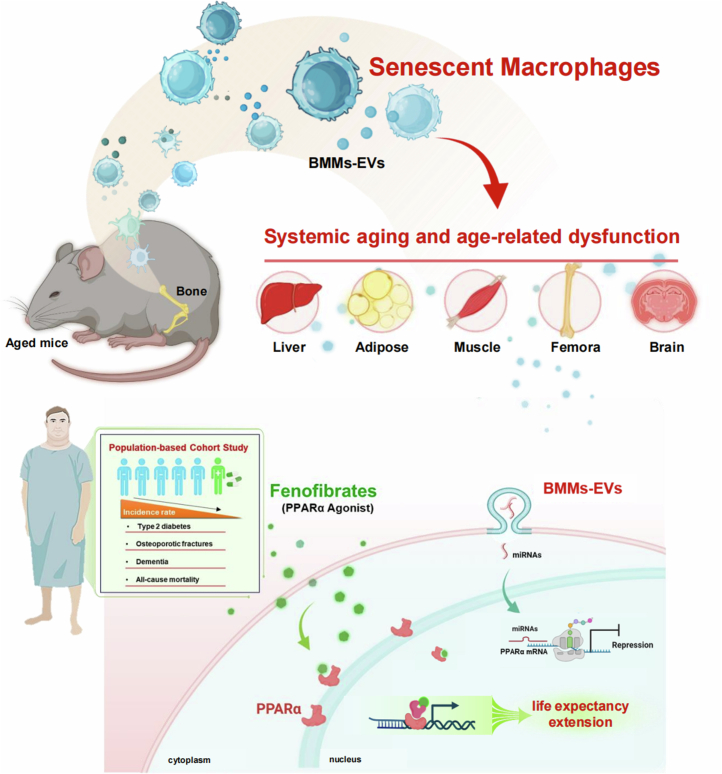
The accumulation and systemic propagation of senescent cells contributes to physiological aging and age-related pathology. However, which cell types are most susceptible to the aged milieu and could be responsible for the propagation of senescence has remained unclear. Here we found that physiologically aged bone marrow monocytes/macrophages (BMMs) propagate senescence to multiple tissues, through extracellular vesicles (EVs), and drive age-associated dysfunction in mice. We identified peroxisome proliferator-activated receptor α (PPARα) as a target of microRNAs within aged BMM-EVs that regulates downstream effects on senescence and age-related dysfunction. Demonstrating therapeutic potential, we report that treatment with the PPARα agonist fenofibrate effectively restores tissue homeostasis in aged mice. Suggesting conservation to humans, in a cohort study of 7,986 participants, we found that fenofibrate use is associated with a reduced risk of age-related chronic disease and higher life expectancy. Together, our findings establish that BMMs can propagate senescence to distant tissues and cause age-related dysfunction, and they provide supportive evidence for fenofibrate to extend healthy lifespan.


Conflict of interest statement

Competing interests The authors declare no competing interests.

Figures

Fig. 1
Fig. 1. Aged bone marrow causes senescence propagation in multiple young organs.
a, Experimental setup for bone marrow transplantation. Young recipients (3 months old, male mice) were lethally irradiated and then transplanted with bone marrow from young donors (3 months old, male mice) and aged donors (24 months old, male mice). b, The mRNA levels of senescence-associated genes and SASP factors in liver, muscle and adipose tissue of young recipients receiving bone marrow transplantation (YBMT and ABMT) (n = 4 mice for ABMT; n = 3 mice for other groups). c, Western blot analysis of p53, p21 and γH2A.X protein expression in liver (left) and quantitative analysis (right) (n = 3 mice). d, Immunofluorescence detection of γH2A.X in femur and brain (scale bar, 50 μm; n = 5 mice) (left) and quantitative analysis (right). e, GTT and ITT (n = 5 mice). f, Western blot analysis of phosphorylated key molecules of insulin pathway in the liver (left) and quantitative data (right) (n = 3 mice). g, Representative µCT images of recipient mice after transplantation (left) and quantitative analysis of trabecular bone volume/tissue volume (BV/TV) (right) (n = 5 mice). h, Old mice (16 months old, male) were treated with vehicle or D+Q for 5 months. After 5 months, bone marrow was isolated from mice and transplanted into young mice (3 months old, male) (ABMT and DQ-ABMT). Western blot analysis of p21 and γH2A.X protein expression in liver (n = 4 mice for ABMT; n = 3 mice for other groups) and adipose tissue (n = 6 mice for ABMT; n = 5 mice for other groups) (left) of young recipients receiving bone marrow from DQ-treated aged mice, and quantitative analysis (right). i,j, Representative images of SA-β-gal staining in the adipose tissue (i) and femur (j) (scale bar, 50 μm; n = 5 mice) (left), and their quantitative analysis (right). The red arrows represent the SA-β-gal-positive cells. k,l, GTT (k) and ITT (l) were performed on young recipients after transplantation (n = 6 mice). m, Representative µCT images (left) and quantitative analysis (right) (n = 6 mice). The colored shading in e, k and l represents the area under the curve. n, Hanging endurance (n = 6 mice). o, Novel object recognition (n = 6 mice). Data are presented as mean ± s.e.m. *P < 0.05, **P < 0.01 and ***P < 0.001, as determined by one-way ANOVA followed by Tukey’s multiple comparison test. BM, bone marrow; FDR, false discovery rate; I.V., intravenous; mo, months; Rel. fold, relative fold; T.Ar, total area. Source data
Fig. 2
Fig. 2. Macrophages within bone marrow are the major contributor to aging.
a, Bioinformatics analysis of scRNA-seq of bone marrow cells from isochronic parabiotic pairs of young mice (2 months old, BM-Y) and old mice (23 months old, BM-O), respectively. b, Violin plots show the expression levels of Cdkn1a and Il-β in the BMMs compared to other cell types. c, UMAP plots show the distribution of senescence-related genes in different cell types in young and old bone marrow (BM-Y and BM-O). The red dashed outlines represent the population of monocytes/macrophages. Color bars are the distribution of senescence-related differential genes. d, Bubble plot shows the KEGG enrichment pathways for the upregulated aging-related genes in the BMM population. e, BMMs were isolated from young mice (3 months old, male, YBMMs) and aged mice (24 months old, male, ABMMs) and then transplanted into young recipients (3 months old, male mice). f, Gene expression (left) (n = 3 mice) and protein levels (right) (n = 4 mice for ABMMT; n = 3 mice for other groups) of senescence-associated markers in muscle of young mice transplanted with BMMs (YBMMT and ABMMT). g, Immunofluorescence for γH2A.X protein in the femur (upper left) and brain (bottom left) (scale bar, 50 μm; n = 5 mice; 5–6 images per mouse), and their quantitative analysis (right). h, Representative images of SA-β-gal staining in the liver (scale bar, 50 μm; n = 4 mice; 5–6 images per mouse) (upper left) and brain (scale bar, 50 μm; n = 5 mice; 5–6 images per mouse) (bottom left), and their quantitative analysis (right). i,j, GTT (i) and ITT (j) were performed on young mice transplanted with BMMs (n = 6 mice). k, Western blot analysis of key molecules of insulin signaling pathway in adipose tissue (left) and quantitative analysis (right) (n = 3 mice). l, Representative µCT images (left) and quantitative analysis (right) of trabecular bone-related parameters (bone volume/tissue volume (BV/TV)) (n = 6 mice). Data are expressed as mean ± s.e.m. for all panels. *P < 0.05, **P < 0.01, ***P < 0.001 and #P < 0.0001, as determined by one-way ANOVA followed by Tukey’s multiple comparison test. UMAP, uniform manifold approximation and projection. FDR, false discovery rate; mo, months; Diff, differential; Rel. fold, relative fold; T.Ar, total area. Source data
Fig. 3
Fig. 3. Senescent BMMs drive senescence propagation to multiple tissues.
a, Outline of the studies. BMMs were isolated from aged mice (24 months old, male) and then treated with vehicle or D+Q (ABMM, DQ-ABMM). We subsequently transplanted them into young recipients (3 months old, male mice). b, Gene expression (left) (n = 4 mice) and protein levels (right) of senescence-associated markers in liver (upper), muscle (middle) and adipose tissue (bottom) of young mice transplanted with DQ-treated BMMs (n = 5 mice for ABMMT; n = 3 mice for other groups in liver; n = 3 mice in muscle and adipose). c, Representative SA-β-gal staining in liver (scale bar, 50 μm; n = 4 mice; 5–6 images per mouse) (top) and brain (scale bar, 50 μm; n = 5 mice; 5–6 images per mouse) (bottom). The red arrows represent the SA-β-gal-positive cells. d, GTT and ITT (n = 6 mice). e, Gene expression of G6Pase, PEPCK and PGC-1α in liver (n = 4 mice). f, The ratio of liver weight to body weight (LW/BW) (n = 6 mice). g, The mRNA level of FASN in liver (n = 4 mice). h, Phosphorylation levels of insulin signaling in liver (n = 3 mice for Y-control, n = 4 mice for other groups), muscle and adipose tissue (n = 3 mice). i,j, Representative µCT images (i) and quantitative analysis of trabecular bone volume/tissue volume (BV/TV) (j) (n = 6 mice). k, Hanging endurance (n = 6 mice). l, Novel object recognition (n = 6 mice). Data are expressed as mean ± s.e.m. *P < 0.05, **P < 0.01, ***P < 0.001 and #P < 0.0001, as determined by one-way ANOVA followed by Tukey’s multiple comparison test. I.V., intravenous; mo, months; Rel. fold, relative fold; T.Ar, total area. Source data
Fig. 4
Fig. 4. EVs secreted by senescent BMMs propagate senescence and aging, whereas YBMM-EVs partially rejuvenate aging.
a, Experimental setup for EV transplantation. BMMs were isolated from young mice (3 months old, male) and aged mice (20 months old, male), and EVs secreted by BMMs were collected (YBMM-EVs, ABMM-EVs) and subsequently transplanted into young recipients (3 months old, male mice). b, Immunofluorescence staining for p53 in muscle (scale bar, 50 μm; n = 4 mice) (upper left), adipose tissue (scale bar, 50 μm; n = 4 mice; 5–6 images per mouse) (middle left) and bone sections (scale bar, 50 μm; n = 6 mice; 5–6 images per mouse) (bottom left) of young mice treated with YBMM-EVs or ABMM-EVs, and their quantitative analysis (right). c, GTT and ITT were performed on young mice receiving adaptive transfer of EVs (n = 6 mice). d, Phosphorylation level of insulin signaling in liver (left) and quantitative analysis (right) (n = 3 mice). e, Representative µCT images (n = 6 mice). f, Outline of the studies. BMMs were isolated from young mice (3 months old, male) and aged mice (20 months old, male), and EVs secreted by BMMs (YBMM-EVs, ABMM-EVs) were collected and subsequently transplanted into aged recipients (20 months old, male mice). g, Immunofluorescence detection of p53 in liver (upper left) and femur (middle left) (scale bar, 50 μm; n = 4 mice; 5–6 images per mouse) and γH2A.X in muscle (scale bar, 50 μm; n = 4 mice; 5–6 images per mouse) (lower left) and brain (scale bar, 50 μm; n = 5 mice; 5–6 images per mouse) (bottom left) of aged mice after YBMM-EV or ABMM-EV transplantation, and their quantitative analysis (right). h, Protein levels of senescence-related markers in liver (upper left), muscle (middle) and adipose tissue (upper right), and their quantitative analysis (bottom) (n = 3 mice). i,j, GTT (i) and ITT (j) (n = 5 mice). The colored shading in c, i and j represents the area under the curve. k, Representative µCT images (left) and quantitative analysis (right) of bone volume/tissue volume (BV/TV) (n = 5 mice). Data are presented as mean ± s.e.m. *P < 0.05, **P < 0.01, ***P < 0.001 and #P < 0.0001, as determined by one-way ANOVA followed by Tukey’s multiple comparison test. mo, months; Source data
Fig. 5
Fig. 5. Role of EV-loaded miRNAs in age-related dysfunction.
a, Bar plots show the different miRNA expression in YBMM-EVs and ABMM-EVs. The yellow and green shading represents the candidate miRNAs, namely miRNA-378a-3p (yellow shading) and miRNA-191 (green shading); the green and red horizontal dashed lines represent the expression levels of miRNA-378a-3p in ABMM-EVs (red dashed line) and miRNA-191 in YBMM-EVs (green dashed line). b, Outline of the studies (2 months old, male mice). ce, Fasting blood glucose (n = 6 mice) and fasting serum insulin level (c, n = 5 mice for control; n = 4 mice for other groups), LW/BW (d, n = 5 mice for 378a-EVs; n = 4 mice for other groups) and serum triglyceride levels (e, n = 4 mice) were measured in young mice transplanted with macropahge-miR378a-EVs. f,g, GTT (f) and ITT (g) were performed on young mice treated with macropahge-miR378a-EVs (n = 9 mice). h, Outline of generating specific knockout of miR-378a in BMMs of miR-378aflox/flox mice (18 months old, male mice). i, The mRNA level of senescence-associated markers in muscle (n = 6 mice for AAV-Control; n = 5 mice for other groups) and adipose tissue (n = 5 mice). j, Protein levels of senescence markers in liver of miR-378a-BMM-CKO mice (left) and quantitative analysis (right) (n = 3 mice). k, GTT and ITT were performed on miR-378a-BMM-CKO mice (n = 6 mice for AAV-Control; n = 5 mice for other groups). The colored shading in f, g and k represents the area under the curve. l, Phosphorylation levels of insulin signaling in liver (left) and quantitative analysis (right) (n = 3 mice). m, Outline of the studies (22 months old, male mice). n, Representative SA-β-gal staining of femur from aged mice after infection with AAV-miRNA-191 (scale bar, 50 μm; n = 5 mice). The red arrows represent the SA-β-gal-positive cells. o,p, Representative µCT images (o) and quantitative analysis of bone volume/tissue volume (BV/TV) and cortical bone thickness (CT. Th) (p) (n = 12 mice). q, Outline of the studies (2 months old, male mice). r, Representative p53 fluorescence staining of femurs after infection with AAV-F4/80-miR-191-sponge (scale bar, 50 μm; n = 6 mice) (top) and quantitative analysis (right). s, Representative µCT images (left) and quantitative analysis (right) (n = 6 mice). Data are expressed as mean ± s.e.m. *P < 0.05, **P < 0.01, ***P < 0.001 and #P < 0.0001, as determined by one-way ANOVA followed by Tukey’s multiple comparison test in cg; two-tailed t-test in i (muscle and Cdkn1a, Il-6 and Cxcl1 in adipose), jn, p (CT. Th) and s; and two-tailed t-test with Welch’s correction in i (Il-1β in adipose), p (BV/TV) and r. mo, months; TG, triglyceride; Rel. fold, relative fold; T.Ar, total area. Source data
Fig. 6
Fig. 6. Fenofibrate delays the onset of age-related disorders in humans.
a, Outline of the studies. Serum was collected from young mice (3 months old, male) and aged mice (21 months old, male) and subjected to metabolomics analysis. b, Differential abundance score shows the changes of metabolites in serum from young and aged mice. The red horizontal line represents the differential enrichment of PPAR signaling pathway in serum from young and aged mice; the red asterisks represent the statistical difference (P < 0.001). c, Protein levels of PPARα after overexpression of miRNA-378a in primary hepatocytes (n = 3 biological replicates) (upper left) or miRNA-191 in BMSCs (n = 6 biological replicates) (bottom left), and their quantitative analysis (right). d, Outline of the studies. e, Cumulative incidence of type 2 diabetes, major osteoporotic fracture, dementia and all-cause mortality in participants initiating fenofibrate and those using simvastatin. f, Life expectancy. Data are expressed as mean ± s.e.m. *P < 0.05, **P < 0.01 and ***P < 0.001, as determined by two-tailed t-test. mo, months. Source data
Fig. 7
Fig. 7. Fenofibrate effectively restores tissue homeostasis in aged mice.
a, Experimental setup for fenofibrate treatment. Aged mice (23 months old) were treated with vehicle or fenofibrate (A-vehicle, A-fenofibrate), and then the senescent phenotypes were assessed. b,c, Gene expression of senescence and SASP markers in liver (n = 4 mice) (b) and brain (n = 4 mice for Y-vehicle; n = 3 mice for other groups) (c) of aged mice treated with fenofibrate. Color bars are the heatmap of relative mRNA expression. d,e, Protein expression of p21 and γH2A.X in liver and muscle (d) and their quantitative data (e) (n = 3 mice). f,g, Immunofluorescence detection of γH2A.X in liver and brain (f) and their quantitative data (g) (scale bar, 50 μm; n = 4 mice; 5–6 images per mouse). h, Phosphorylation levels of insulin signaling in liver (upper left) and muscle (upper right), and their quantitative analysis (bottom) (n = 3 mice). i,j, Representative µCT images (i) and quantitative analysis of bone volume/tissue volume (BV/TV) (j) (n = 4 mice). k, Hanging endurance (n = 4 mice). l,m, Immunofluorescence detection of GluR-1 in brain (l) and quantification of GluR-1 foci (m) (scale bar, 50 μm; n = 4 mice; 5–6 images per mouse). n, Novel object recognition (n = 4 mice). Statistical differences were determined by one-way ANOVA followed by Tukey’s multiple comparison test. mo, months; Rel. fold, relative fold; T.Ar, total area. Source data
Extended Data Fig. 1
Extended Data Fig. 1. Aged bone marrow drives senescence in young recipients.
a, CD45.2 expression in white blood cells (enriched from total blood cells by red blood cell lysis) of CD45.2 recipient mice before irradiation, and CD45.1 and CD45.2 expression in white blood cells after transplantation of CD45.1 donor bone marrow cells (n = 3 mice). b, Expression of senescence-related genes in liver, muscle and adipose tissue of young recipients after bone marrow transplantation (n = 4 mice for ABMT; n = 3 mice for other groups). c, Representative SA-β-gal staining in femoral bone sections (scale bar, 50μm; n = 5 mice; 5 ~ 6 images per mouse). d, Representative p53 fluorescence image in brain (scale bar, 50μm; n = 5 mice for ABMT; n = 4 mice for other groups; 5 ~ 6 images per mouse). e, The AUC data for GTT and ITT were calculated, respectively (n = 5 mice). f-g, Western blot analysis of key molecules of insulin pathway in muscle and adipose tissue, and their quantitative data (n = 3 mice). h-i, Representative HE staining and osteocalcin staining in femoral bone sections (scale bar, 50μm; n = 5 mice; 5 ~ 6 images per mouse), and their quantitative data. j-k, Immunofluorescence for GluR-1 protein in brain and quantitative analysis (scale bar, 50μm; n = 5 mice; 5 ~ 6 images per mouse). l-m, Nissl staining in brain and quantitative analysis (scale bar, 50μm; n = 5 mice; 5 ~ 6 images per mouse). Data are presented as mean ± SEM. *P < 0.05; **P < 0.01; ***P < 0.001; #P < 0.0001, as determined by one-way ANOVA followed by Tukey’s multiple comparison test. Source data
Extended Data Fig. 2
Extended Data Fig. 2. Senolytics blunt the ability of aged bone marrow to induce senescence propagation to young recipients.
a, Outline of the studies (male mice). Old mice (16 m, male) were treated with Vehicle or D + Q for 5months. After 5 months, bone marrow was isolated from mice and then transplanted into young mice (3 m, male) (ABMT, DQ-ABMT). b, Immunofluorescence staining of γH2A.X in femoral bone sections (scale bar, 100μm; n = 3 mice; 5 ~ 6 images per mouse). c, Representative SA-β-gal staining of bone marrow in aged mice after DQ administration (scale bar, 250μm; n = 3 mice; 5 ~ 6 images per mouse). d-e, The protein levels of senescence-associated markers in muscle and quantitative analysis (n = 3 mice). f-g, Gene expression of senescence-associated markers in liver, muscle and adipose tissue of young mice receiving bone marrow from DQ-treated aged mice (n = 4 mice). h, Representative images of SA-β-gal staining in the liver (scale bar, 50μm; n = 4 mice; 5 ~ 6 images per mouse) and brain (scale bar, 50μm; n = 5 mice; 5 ~ 6 images per mouse). i-j, The AUC data for GTT and ITT were calculated, respectively (n = 6 mice). k, The mRNA levels of G6Pase, PEPCK, and PGC-1a in the liver (n = 4 mice). l, Gene expression of FASN and ACC1 in liver (n = 4 mice), and the LW/BW of young recipients (n = 6 mice). m-n, Western blot analysis of phosphorylated key molecules of insulin pathway in the liver and muscle, and their quantitative data (n = 3 mice). o, The mRNA levels of C-fos, Psd95, Foxo6 and Gfap in the brain (n = 3 mice). p-q, Immunofluorescence detection of GluR-1 in the brain and quantitative analysis (scale bar, 50μm; n = 5 mice; 5 ~ 6 images per mouse). Data are presented as mean ± SEM. *P < 0.05; **P < 0.01, ***P < 0.001; #P < 0.0001 were determined using two-tailed t-test in b-c and one-way ANOVA followed by Tukey’s multiple comparison test in d-q. Source data
Extended Data Fig. 3
Extended Data Fig. 3. Bone marrow monocytes/macrophages are more susceptible to senescence during aging.
a-b, The number of cells and the percentage of cells are displayed by cell frequency analysis. c, Dynamic changes of cell proportion in BMMs and neutrophils. d, UMAP plots show the distribution of senescence-related genes in different cell types in young and old bone marrow (BM-Y, BM-O). e, UMAP plots show the expression and distribution of senescence-related genes in old bone marrow cells (BM-O). f, SA-β-gal staining in BMMs isolated from young (3 m, n = 3 male mice) and aged mice (24 m, n = 3 male mice), respectively (scale bar, 50μm). g, The expression levels of senescence-related genes in BMMs (n = 3 mice). h, p53 immunofluorescence staining in BMMs (scale bar, 200μm; n = 3 mice; 5 ~ 6 images per n). i-j, Expression levels of senescence markers in liver, adipose tissue and brain of young mice after BMMs transplantation (n = 3 mice). k, Western blot analysis of p53 protein expression in muscle (n = 4 mice). l, Representative images of p21 immunohistochemistry in femur (scale bar, 50μm; n = 5 mice; 5 ~ 6 images per mouse). Mean ± SEM are shown for all panels. *P < 0.05; **P < 0.01; ***P < 0.001; #P < 0.0001 were determined using two-tailed t-test in a-f, g (Cdkn1a) and h, two-tailed t-test with a Welch’s correction in g (Cdkn2a) and one-way ANOVA followed by Tukey’s multiple comparison test in i-l. Source data
Extended Data Fig. 4
Extended Data Fig. 4. Senescent BMMs lead to the propagation of senescent phenotypes to young murine.
a-b, AUC data for GTT and ITT were calculated, respectively (n = 6 mice). c, Western blot analysis of key molecules in the insulin signaling pathway in liver and muscle (n = 3 mice). d, Osteocalcin staining was performed in femoral bone sections after BMMs transplantation (scale bar, 50μm; n = 4 mice; 5 ~ 6 images per mouse). e, Representative images and quantification of the number of PSD95+ synapses that engulfed by microglia (scale bar, 50μm; n = 5 mice; 5 ~ 6 images per mouse) and immunofluorescence detection of GluR-1 in brain (scale bar, 50μm; n = 4 mice; 5 ~ 6 images per mouse). Mean ± SEM are shown for all panels. *P < 0.05; **P < 0.01; ***P < 0.001; #P < 0.0001 according to one-way ANOVA followed by Tukey’s multiple comparison test. Source data
Extended Data Fig. 5
Extended Data Fig. 5. Senolytics can eliminate senescent BMMs, and alleviate their pro-aging effects on multiple young tissues.
a-b, Representative images (scale bar, 100μm; n = 5 mice; 5 ~ 6 images per mouse) and quantification of the number of γH2A.X+ macrophage in bone marrow after in vivo DQ treatment. c-d, SA-β-gal staining and immunofluorescence staining of p21, γH2A.X and p53 in BMMs after in vitro DQ treatment (scale bar, 100μm; n = 3 mice; 5 ~ 6 images per n). e, Expression levels of SASP factors in muscle and adipose tissue of young mice transplanted with DQ-treated BMMs (n = 4 mice). f, The AUC data for GTT and ITT were calculated, respectively (n = 6 mice). g, Representative liver Oil-Red staining (scale bar, 50μm; n = 4 mice; 5 ~ 6 images per mouse). h, Quantification of phosphorylation levels of insulin signaling in liver (n = 3 mice for Y-control; n = 4 mice for other groups), muscle (n = 4 mice) and adipose tissue (n = 3 mice). i, Representative images of PSD95 immunofluorescence and Nissl staining in brain (scale bar, 50μm; n = 4 mice; 5 ~ 6 images per mouse). Data are presented as mean ± SEM. *P < 0.05; **P < 0.01; ***P < 0.001; #P < 0.0001 were determined using two-tailed t-test in a-d and one-way ANOVA followed by Tukey’s multiple comparison test in e-i. Source data
Extended Data Fig. 6
Extended Data Fig. 6. EVs secreted by senescent BMMs propagate senescence, whereas young BMM-derived EVs ameliorate aging-related phenotypes of aged mice.
a, The electron microscopy analysis (scale bar, 100 nm) and particle size of EVs (n = 3 mice). b, The uptake of EVs by multiple tissues (n = 3 mice). c, Protein levels of senescence markers in multiple tissues of young mice treated with YBMM-EVs or ABMM-EVs (n = 4 mice for YBMM-EVs; n = 5 mice for ABMM-EVs). d, Immunohistochemical staining of p53 in muscle and adipose tissue (scale bar, 50μm; n = 4 mice). e-f, Immunofluorescence staining for γH2A.X in bone sections, and the quantitative analysis (scale bar, 50μm; n = 5 mice). g, AUC data of GTT and ITT were calculated respectively (n = 6 mice). h, Expression levels of G6Pase, PEPCK, PGC-1a, FASN and ACC1 in the liver (n = 4 mice). i, The LW/BW were measured in young recipients (n = 5 mice). j, Serum triglyceride (TG) levels (n = 5 mice for Y-control and YBMM-EVs; n = 4 mice for ABMM-EVs). k, Phosphorylation levels of insulin signaling in muscle and adipose tissue (n = 3 mice). l, Osteocalcin immunohistochemical staining of femoral bone sections (scale bar, 50μm; n = 6 mice). m, Quantitative analysis of trabecular bone related parameters (BV/TV) (n = 6 mice). n, Immunofluorescence detection of p21 in muscle of aged mice after treatment with YBMM-EVs or ABMM-EVs (scale bar, 50μm; n = 4 mice; 5 ~ 6 images per mouse). o, Representative images of p21 immunohistochemistry in adipose tissue (scale bar, 50μm; n = 4 mice). p, The AUC data of GTT and ITT (n = 5 mice). q, Immunohistochemical staining of osteocalcin in femurs (scale bar, 50μm; n = 5 mice). r, Nissl staining in brain (scale bar, 50μm; n = 5 mice; 5 ~ 6 images per mouse). Data are expressed as mean ± SEM. *P < 0.05; **P < 0.01; ***P < 0.001; #P < 0.0001 were determined using two-tailed t-test in c. and one-way ANOVA followed by Tukey’s multiple comparison test in d-r. Source data
Extended Data Fig. 7
Extended Data Fig. 7. BMMs-EVs containing miRNAs enrichment pathways.
a, Expression level of miRNA-378a in BMMs isolated from young (3 m, male mice) and aged mice (24 m, male mice) (n = 6 young mice; n = 5 aged mice). b, Expression level of miRNA-378a in liver, adipose tissues and muscle of young mice after YBMM-EVs or ABMM-EVs treatment (n = 4 mice for YBMM-EVs; n = 3 mice for ABMM-EVs). c, Expression level of miRNA-191 in BMMs and their derived EVs (n = 3 mice). d, Bar plots of enriched terms of miR-378a and miR-191. Data are shown as mean ± SEM. *P < 0.05; **P < 0.01were determined using two-tailed t-test in a, b (liver and muscle) and c (BMM-EVs) and two-tailed t-test with a Welch’s correction in b (adipose tissues) and c (BMMs). Source data
Extended Data Fig. 8
Extended Data Fig. 8. MiR-378a and miR-191 regulate age-related dysfunction.
a, The mRNA levels of FASN and ACC1 in liver of young recipients transplanted with macrophage-miR-378a-EVs (n = 4 mice). b, The mRNA levels of senescence-related markers in liver (n = 6 mice for AAV-Control; n = 5 mice for AAV-F4/80-Cre). c, Protein levels of senescence markers in muscle and adipose tissue of miR-378a-BMM-CKO mice (n = 3 mice). d, The AUC data of GTT and ITT (n = 6 mice for AAV-Control; n = 5 mice for AAV-F4/80-Cre). e, Phosphorylation levels of insulin signaling in adipose tissue (n = 3 mice). f, Expression levels of G6Pase, PEPCK, FASN and ACC1 in the liver (n = 6 mice for AAV-Control; n = 5 mice for AAV-F4/80-Cre). g, Immunohistochemical staining of osteocalcin in femurs of aged mice injected with AAV-miR-191 (scale bar, 50μm; n = 6 mice). h, Immunohistochemical staining of p21 in femurs of young mice injected with AAV-F4/80-miR-191-sponge (scale bar, 50μm; n = 6 mice). i, Hanging endurance and grip strength (n = 6 mice). j, The mRNA levels of senescence-related markers in primary hepatocytes after miR-378a overexpression (n = 6 biological replicates for miR-378a mimic; n = 3 biological replicates for other groups). k, The mRNA levels of senescence-related markers in primary hepatocytes after inhibition of miR-378a expression (n = 4 biological replicates for miR-378a inhibitor; n = 3 biological replicates for other groups). l-m, Representative images of SA-β-gal staining in primary hepatocytes (scale bar, 300μm; n = 5 biological replicates for miR-378a inhibitor; n = 3 biological replicates for other groups), and their quantitative data. n, The mRNA levels of senescence-related markers in BMSCs after miR-191 overexpression (n = 3 biological replicates). o, Representative images of SA-β-gal staining in BMSCs (n = 3 biological replicates). Data are shown as mean ± SEM. *P < 0.05; **P < 0.01; ***P < 0.001; #P < 0.0001 were determined using two-tailed t-test in b (Cdkn2a, Il-1β and Il-6), c-i and o, two-tailed t-test with a Welch’s correction in b (Cdkn1a and Tnf-α) and one-way ANOVA followed by Tukey’s multiple comparison test in a, j-n. Source data
Extended Data Fig. 9
Extended Data Fig. 9. Fenofibrate regulates cellular senescence by targeting PPARα.
a, Protein levels of PPARα after inhibition of miRNA-378a expression in primary hepatocytes (n = 6 biological replicates). b-c, Protein levels of PPARα after overexpression or inhibition of miRNA-378a in C2C12 cells (n = 3 biological replicates) and 3T3-L1 cells (n = 3 biological replicates). d, Effects of Fenofibrate supplementation on mRNA levels of senescence-related markers in primary hepatocytes after inhibition of PPARα expression (n = 3 biological replicates). e, Representative images of SA-β-gal staining in primary hepatocytes (scale bar, 300μm; n = 3 biological replicates; 5 ~ 6 images per n). Data are expressed as mean ± SEM. *P < 0.05; **P < 0.01; ***P < 0.001; #P < 0.0001 were determined using two-tailed t-test in a-b, and c (mimic), two-tailed t-test with a Welch’s correction in c (inhibitor) and one-way ANOVA followed by Tukey’s multiple comparison test in d-e. Source data
Extended Data Fig. 10
Extended Data Fig. 10. Schematic representation of key findings.
Aged bone marrow macrophages induce paracrine senescence through extracellular vesicles, driving systemic aging and age-related dysfunction through PPARα signalling.

Similar articles

Cited by

References

    1. Pan, C. C. et al. Antagonizing the irreversible thrombomodulin-initiated proteolytic signaling alleviates age-related liver fibrosis via senescent cell killing. Cell Res.33, 516–532 (2023). - PMC - PubMed
    1. Grosse, L. et al. Defined p16High senescent cell types are indispensable for mouse healthspan. Cell Metab.32, 87–99 (2020). - PubMed
    1. Baker, D. J. et al. Clearance of p16Ink4a-positive senescent cells delays ageing-associated disorders. Nature479, 232–236 (2011). - PMC - PubMed
    1. Wagner, J. U. G. et al. Aging impairs the neurovascular interface in the heart. Science381, 897–906 (2023). - PubMed
    1. Khosla, S., Farr, J. N. & Monroe, D. G. Cellular senescence and the skeleton: pathophysiology and therapeutic implications. J. Clin. Invest.132, e154888 (2022). - PMC - PubMed

MeSH terms

LinkOut - more resources