Review
. 2024 Dec;24(12):611-620.
doi: 10.1007/s11910-024-01375-6. Epub 2024 Sep 12.

The Role of Population Receptive Field Sizes in Higher-Order Visual Dysfunction

Affiliations
Review

The Role of Population Receptive Field Sizes in Higher-Order Visual Dysfunction

Deena Elul et al. Curr Neurol Neurosci Rep. 2024 Dec.

Abstract

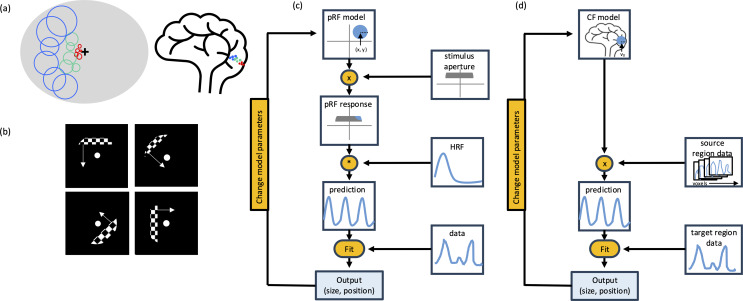
Purpose of review: Population receptive field (pRF) modeling is an fMRI technique used to retinotopically map visual cortex, with pRF size characterizing the degree of spatial integration. In clinical populations, most pRF mapping research has focused on damage to visual system inputs. Herein, we highlight recent work using pRF modeling to study high-level visual dysfunctions.

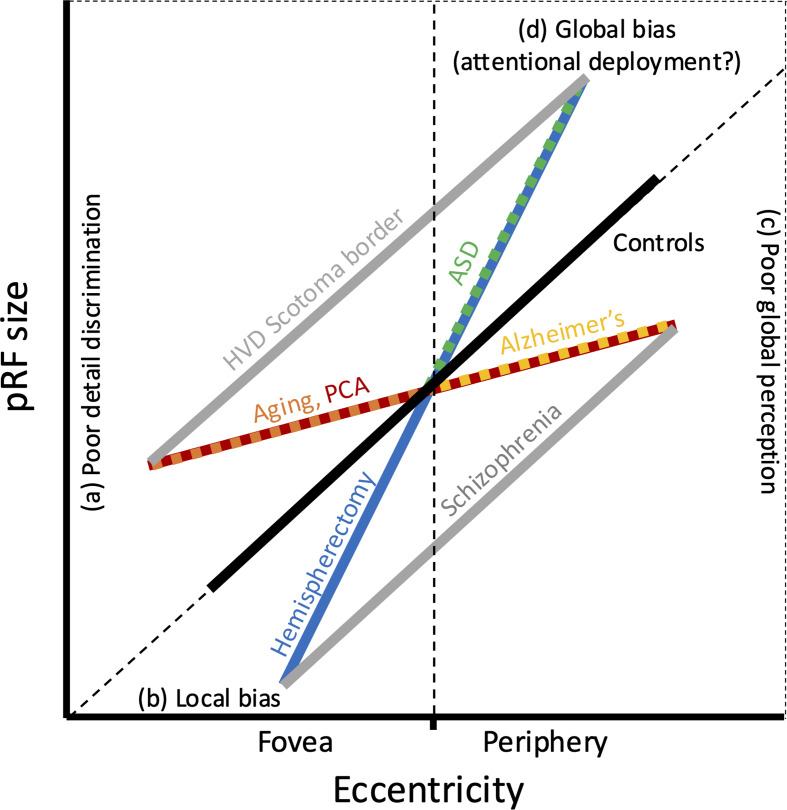
Recent findings: Larger pRF sizes, indicating coarser spatial processing, were observed in homonymous visual field deficits, aging, and autism spectrum disorder. Smaller pRF sizes, indicating finer processing, were observed in Alzheimer's disease and schizophrenia. In posterior cortical atrophy, a unique pattern was found in which pRF size changes depended on eccentricity. Changes to pRF properties were observed in clinical populations, even in high-order impairments, explaining visual behavior. These pRF changes likely stem from altered interactions between brain regions. Furthermore, some studies suggested that pRF sizes change as part of cortical reorganization, and they can point towards future prognosis.

Keywords: Functional MRI; Hemianopia; Population receptive field; Spatial integration; Visual cortex.


Conflict of interest statement

The authors declare no competing interests.

Figures

Fig. 1
Fig. 1
Population receptive field (pRF) and Connective field (CF) modeling procedures. a) Diagram of population receptive fields shown on the visual field and along the calcarine sulcus b) Example stimuli used for pRF and CF mapping c) Diagram of the pRF model fitting procedure (adapted from [4]) d) Diagram of the CF model fitting procedure (adapted from [11])
Fig. 2
Fig. 2
Graphical summary of population receptive field (pRF) size results and suggested interpretation. Patient groups’ pRF sizes divided into four quadrants according to their deviation from controls’ pRF sizes (foveal/peripheral eccentricities, smaller/larger than controls’). a) Larger pRF sizes in the fovea may reflect poor detail discrimination. b) Smaller pRF sizes in the fovea may reflect local bias. c) Smaller pRF sizes in the periphery may reflect poor global perception. d) Larger pRF sizes in the periphery may reflect a global processing bias or changes in attentional deployment

References

    1. Kanwisher N, McDermott J, Chun MM. The fusiform face area: a module in human extrastriate cortex specialized for face perception. J Neurosci. 1997;17:4302–11. - PMC - PubMed
    1. Fox P, Miezin F, Allman J, Van Essen D, Raichle M. Retinotopic organization of human visual cortex mapped with positron- emission tomography. J Neurosci. 1987;7:913–22. - PMC - PubMed
    1. Golomb JD, Kanwisher N. Higher Level Visual Cortex represents Retinotopic, not spatiotopic, object location. Cereb Cortex. 2012;22:2794–810. - PMC - PubMed
    1. Dumoulin SO, Wandell BA. Population receptive field estimates in human visual cortex. NeuroImage. 2008;39:647–60. - PMC - PubMed
    1. Zuiderbaan W, Harvey BM, Dumoulin SO. Modeling center-surround configurations in population receptive fields using fMRI. J Vis. 2012;12:10–10. - PubMed

MeSH terms