. 2024 Sep 12;30(1):147.
doi: 10.1186/s10020-024-00915-7.

SIRT1-mediated deacetylation of FOXO3 enhances mitophagy and drives hormone resistance in endometrial cancer

Affiliations

SIRT1-mediated deacetylation of FOXO3 enhances mitophagy and drives hormone resistance in endometrial cancer

Xuehua Wei et al. Mol Med. .

Abstract

Background: The complex interplay between Sirtuin 1 (SIRT1) and FOXO3 in endometrial cancer (EC) remains understudied. This research aims to unravel the interactions of deacetylase SIRT1 and transcription factor FOXO3 in EC, focusing on their impact on mitophagy and hormone resistance.

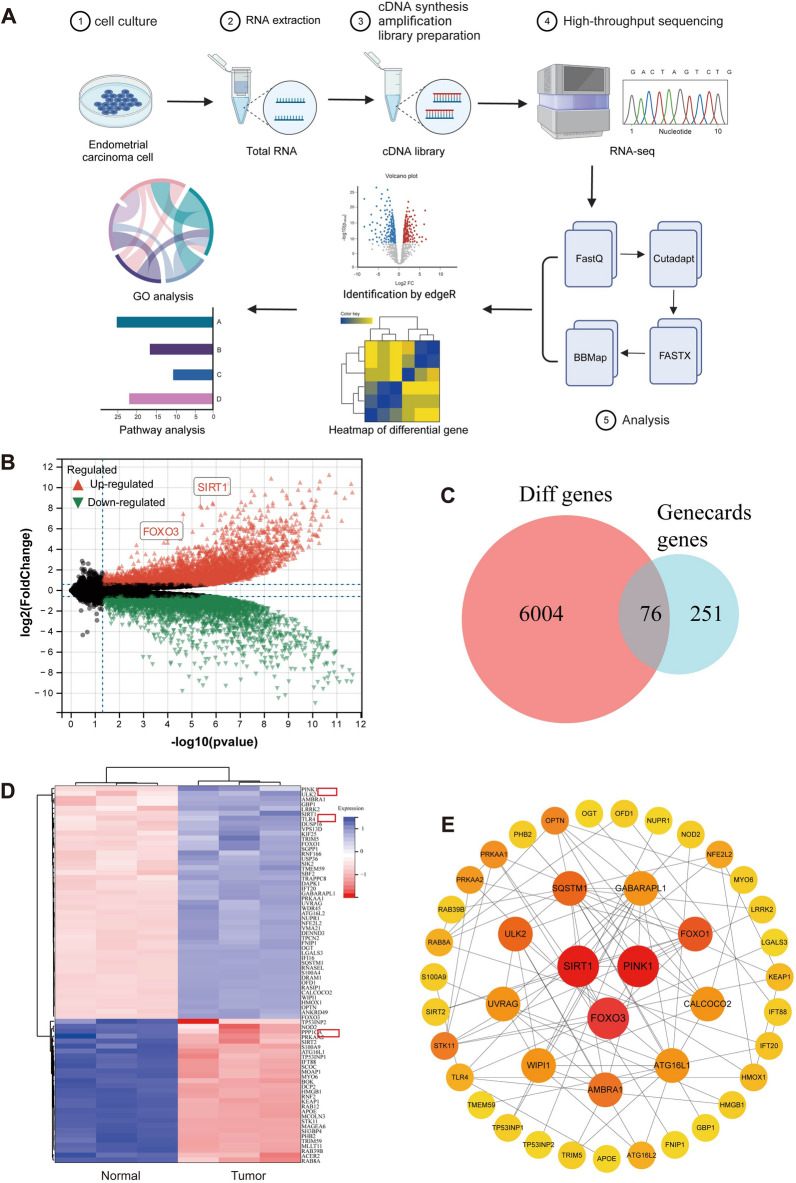
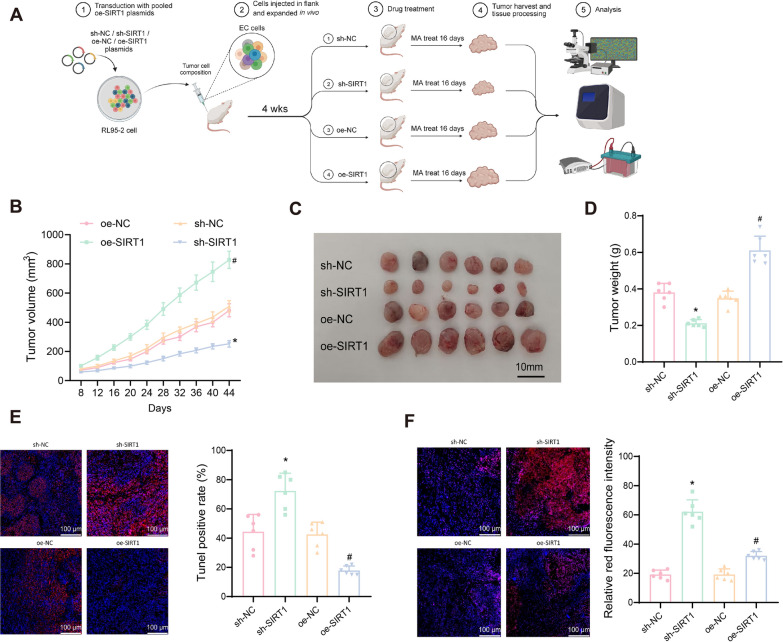
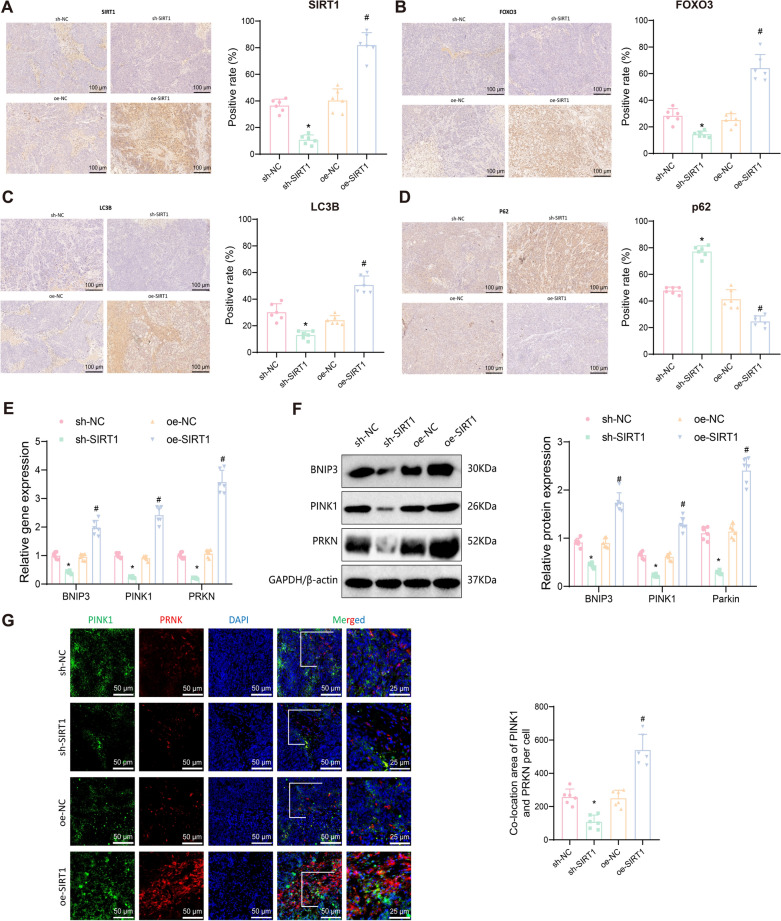
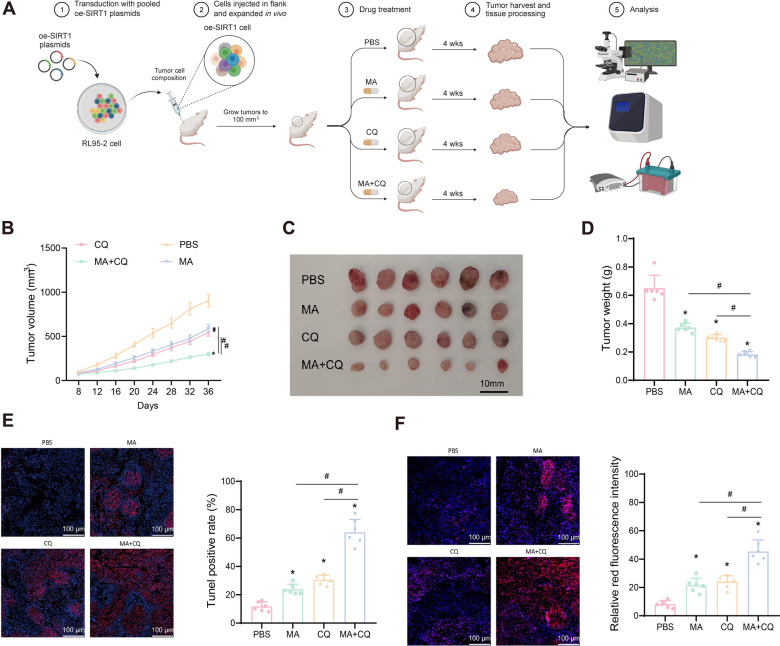
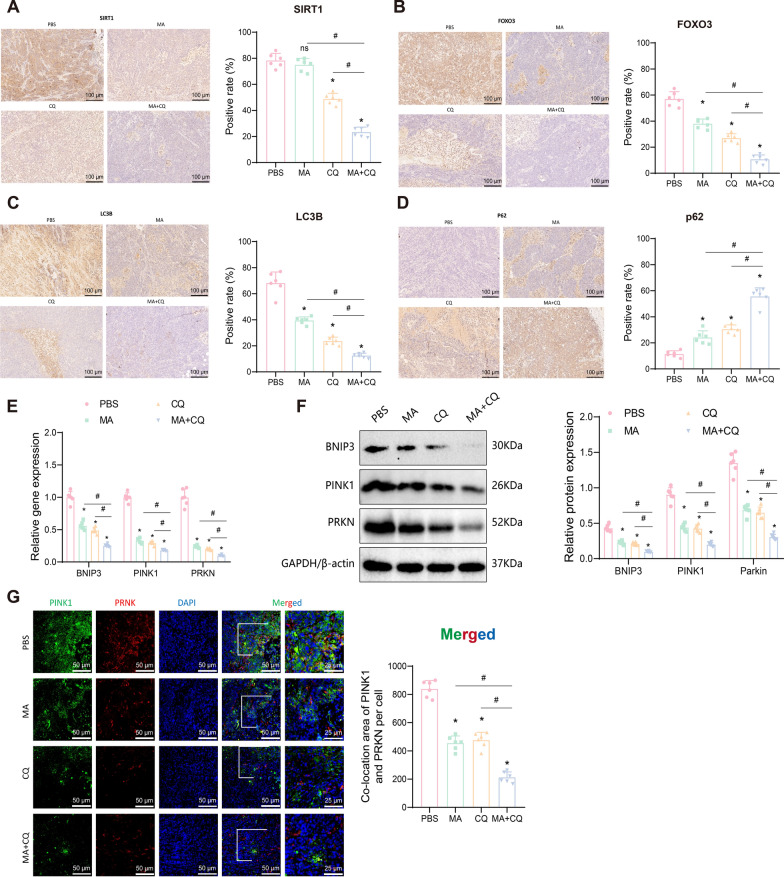
Methods: High-throughput sequencing, cell experiments, and bioinformatics tools were employed to investigate the roles and interactions of SIRT1 and FOXO3 in EC. Co-immunoprecipitation (Co-IP) assay was used to assess the interaction between SIRT1 and FOXO3 in RL95-2 cells. Functional assays were used to assess cell viability, proliferation, migration, invasion, apoptosis, and the expression of related genes and proteins. A mouse model of EC was established to evaluate tumor growth and hormone resistance under different interventions. Immunohistochemistry and TUNEL assays were used to assess protein expression and apoptosis in tumor tissues.

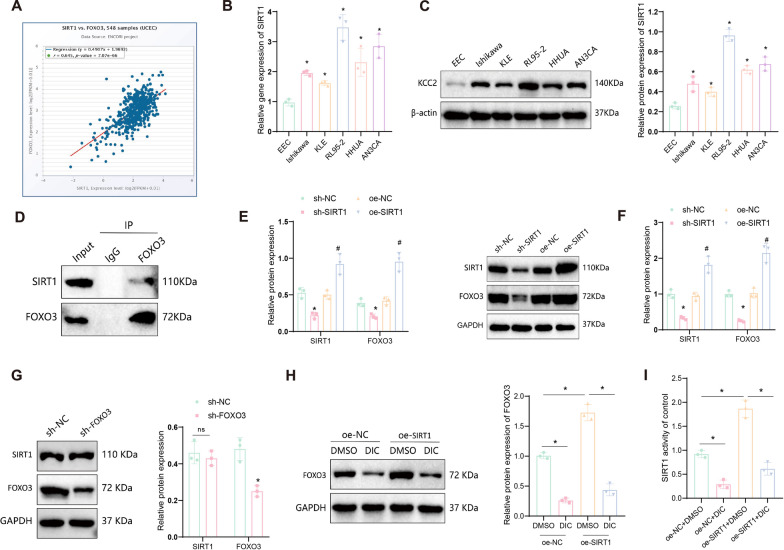
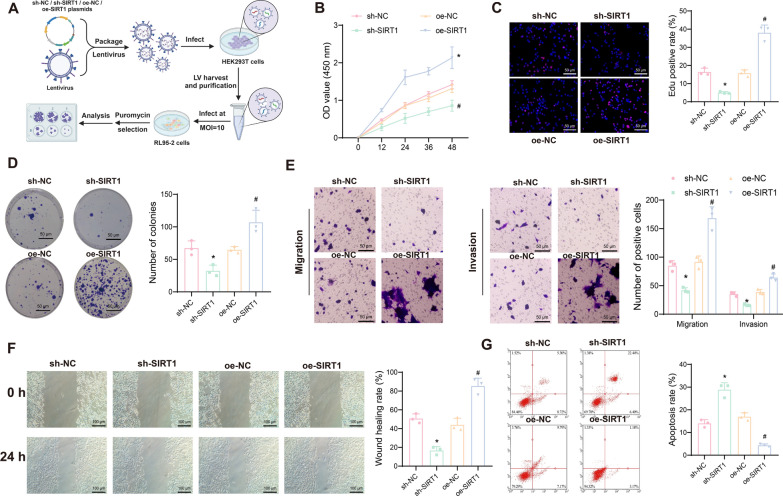
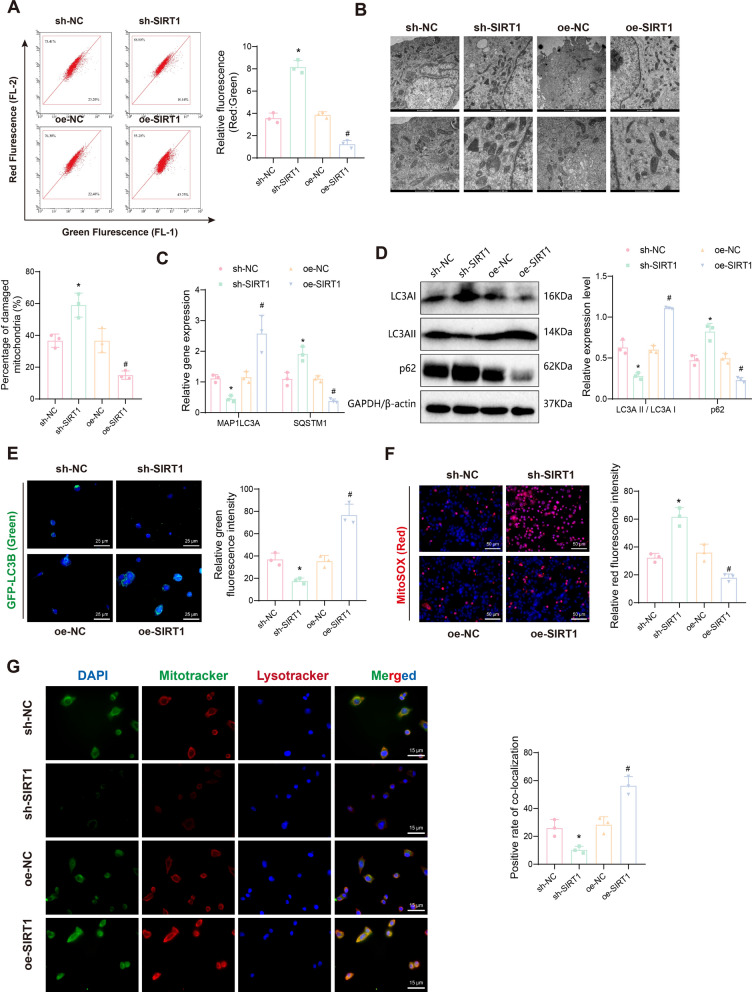
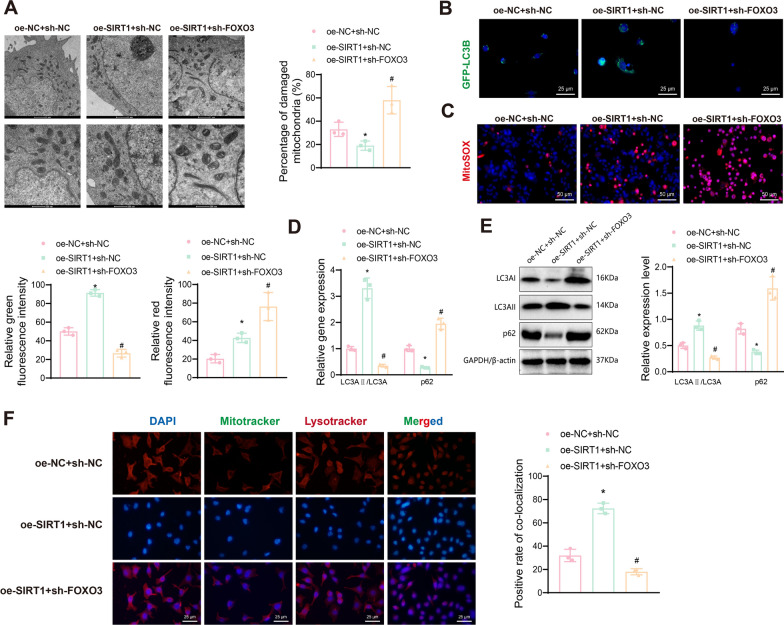
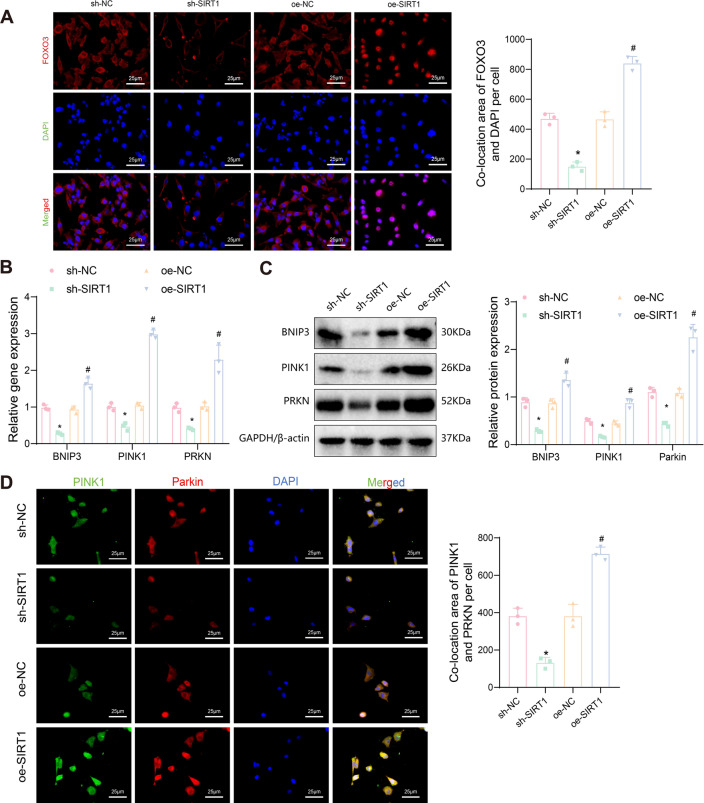
Results: High-throughput transcriptome sequencing revealed a close association between SIRT1, FOXO3, and EC development. Co-IP showed a protein-protein interaction between SIRT1 and FOXO3. Overexpression of SIRT1 enhanced FOXO3 deacetylation and activity, promoting BNIP3 transcription and PINK1/Parkin-mediated mitophagy, which in turn promoted cell proliferation, migration, invasion, and inhibited apoptosis in vitro, as well as increased tumor growth and hormone resistance in vivo. These findings highlighted SIRT1 as an upstream regulator and potential therapeutic target in EC.

Conclusion: This study reveals a novel molecular mechanism underlying the functional relevance of SIRT1 in regulating mitophagy and hormone resistance through the deacetylation of FOXO3 in EC, thereby providing valuable insights for new therapeutic strategies.

Keywords: BNIP3/PINK1/Parkin signaling pathway; Deacetylation modification; Endometrial cancer; FOXO3; Hormone resistance; Mitophagy; SIRT1.


Conflict of interest statement

The author declares no competing interests.

Figures

Fig. 1
Fig. 1
Transcriptional sequencing analysis of key genes associated with EC and mitophagy. A Volcano plot of gene expression in 3 groups of normal endometrial cells (EEC cells) and three groups of EC cells (RL95-2 cells). Upregulated genes are indicated by red triangles, downregulated genes by green triangles, and non-DEGs by black dots; B Venn diagram showing the intersection of DEGs and mitophagy-related genes; C Heatmap of DEGs intersecting between 3 groups of EEC cells and 3 groups of RL95-2 cells, with blue indicating upregulated genes and red indicating downregulated genes; D PPI network graph (Combined score = 0.7), with yellow to red color gradient indicating the degree values of the genes from small to large; E Bubble chart of the KEGG pathway enrichment analysis results for 76 EARGs; F Circle chart of the KEGG pathway enrichment analysis results for 76 EARGs
Fig. 2
Fig. 2
Regulation relationship between SIRT1 and FOXO3 proteins. A Correlation of SIRT1 and FOXO3 mRNA expression in EC (UCEC) according to starBase or ENCORI database, where r > 0 represents a positive correlation. B Detection of SIRT1 mRNA expression in different cell lines using RT-qPCR. C Detection of SIRT1 protein expression in different cell lines using Western blot; D Co-IP experiment to determine the interaction between SIRT1 and FOXO3 proteins in RL95-2 cells. E Detection of changes in SIRT1 and FOXO3 protein expression in RL95-2 cells after silencing or overexpressing SIRT1 mRNA using Western blot; F Detection of changes in SIRT1 and FOXO3 mRNA expression in RL95-2 cells after silencing or overexpressing SIRT1 mRNA using RT-qPCR; G Detection of changes in SIRT1 and FOXO3 protein expression in RL95-2 cells after silencing FOXO3 mRNA using Western blot; H Detection of the effect of overexpressing SIRT1 in RL95-2 cells and using the DIC on FOXO3 protein expression using Western blot; I Detection of the effect of the DIC treatment on SIRT1 activity. Data are presented as mean ± SD, and each cell experiment was repeated three times. *p < 0.05 compared to the EEC group or sh-NC group or between two groups; #p < 0.05 compared to the oe-NC group; ns indicates not significant
Fig. 3
Fig. 3
Effects of silencing or overexpressing SIRT1 on EC cell growth, proliferation, migration, and invasion. A Schematic diagram of the cell experiments; B Viability changes of RL95-2 cells after silencing or overexpressing SIRT1 at 12, 24, 36, and 48 h measured using the CCK-8 assay; C Proliferation capacity of RL95-2 cells after silencing or overexpressing SIRT1 detected using the EdU assay, where EdU-positive cells appear pink, and EdU-negative cells appear blue; D Colony formation assay to measure the colony formation ability of RL95-2 cells after silencing or overexpressing SIRT1; E Transwell assay to evaluate the migration and invasion capacity of RL95-2 cells after silencing or overexpressing SIRT1; F Wound healing assay to assess the migration of RL95-2 cells after silencing or overexpressing SIRT1; G Flow cytometry analysis to detect apoptosis of RL95-2 cells after silencing or overexpressing SIRT1. Data are presented as mean ± SD, and each cell experiment was repeated three times. *p < 0.05 compared to the sh-NC group; #p < 0.05 compared to the oe-NC group
Fig. 4
Fig. 4
Impact of SIRT1 silencing or overexpression on mitophagy and mitochondrial function in EC cells. A JC-1 staining experiment to assess the change in MMP in RL95-2 cells after silencing or overexpressing SIRT1; B TEM to examine mitochondrial ultrastructure; C RT-qPCR to measure the expression changes of MAP1LC3A and SQSTM1 mRNA after silencing or overexpressing SIRT1; D Western blot analysis to detect the expression changes of LC3AI, LC3AII, and p62 proteins after silencing or overexpressing SIRT1 (note: LC3AI and LC3AII bands are displayed on the same gel image); E Immunofluorescence staining to assess the transfection efficiency of GFP-LC3B plasmid after silencing or overexpressing SIRT1; F MitoSOX immunofluorescence staining to examine the regulation of cellular ROS generation in response to silencing or overexpression of SIRT1; G Immunofluorescence co-localization staining of Mitotracker and Lysotracker to investigate the regulation of cellular mitophagy in response to silencing or overexpression of SIRT1. Data are presented as mean ± SD, with each cellular experiment repeated 3 times. *p < 0.05 compared to the sh-NC group; #p < 0.05 compared to the oe-NC group
Fig. 5
Fig. 5
Impact of SIRT1 overexpression on EC cell survival via FOXO3. A Schematic diagram of the experimental procedure; B CCK-8 assay to measure the viability changes of EC cells in different intervention groups at 12, 24, 36, and 48 h; C EdU assay to assess the proliferation ability of EC cells in different intervention groups, with EdU-positive cells shown in pink and EdU-negative cells shown in blue; D Colony formation assay to evaluate the colony-forming ability of EC cells in different intervention groups; E Transwell assay to investigate the migration and invasion ability of EC cells in different intervention groups; F Wound healing assay to examine the migration of EC cells in different intervention groups; G Flow cytometry analysis to detect the apoptosis of EC cells in different intervention groups; H JC-1 staining experiment to assess the change in MMP of EC cells in different intervention groups. Data are presented as mean ± SD, with each cellular experiment repeated 3 times. *p < 0.05 compared to the oe-NC + sh-NC group; #p < 0.05 compared to the oe-SIRT1 + sh-NC group
Fig. 6
Fig. 6
Effects of SIRT1 overexpression on FOXO3-mediated mitophagy in EC cells. A TEM examines mitochondrial ultrastructure; B Immunofluorescence staining examines transfection of GFP-LC3B plasmid in different intervention groups of EC cells; C MitoSOX immunofluorescence staining detects variations in ROS generation in different intervention groups of EC cells; D RT-qPCR detects changes in MAP1LC3A and SQSTM1 mRNA expression in different intervention groups of EC cells; E Western blot detects changes in LC3AI, LC3AII, and p62 protein expression in different intervention groups of EC cells (note: LC3AI and LC3AII bands should be presented on one gel image); F Mitotracker and Lysotracker immunofluorescence co-staining determines the co-localization of mitochondria and autophagosomes in different intervention groups of EC cells. Data are presented as mean ± SD, and each cell experiment in each group was repeated 3 times. *p < 0.05 compared to oe-NC + sh-NC group, with *p < 0.05; #p < 0.05 compared to oe-SIRT1 + sh-NC group, with #p < 0.05
Fig. 7
Fig. 7
Effects of SIRT1 overexpression on BNIP3/PINK1/Parkin-mediated mitophagy in EC cells. A Immunofluorescence staining determines the subcellular localization of FOXO3 protein in different intervention groups of EC cells; B RT-qPCR detects the expression of BNIP3, PINK1, and PRKN mRNA in different intervention groups of EC cells; C Western blot detects the expression of BNIP3, PINK1, and Parkin protein in different intervention groups of EC cells; D Immunofluorescence staining examines the expression and co-localization of PINK1 and Parkin protein in different intervention groups of EC cells. Data are presented as mean ± SD, and each cell experiment in each group was repeated 3 times. *p < 0.05 compared to sh-NC group, with *p < 0.05; #p < 0.05 compared to oe-NC group, with #p < 0.05
Fig. 8
Fig. 8
Overexpression of SIRT1 enhances the intracellular growth of EC cells. A Diagram illustrating the procedure of animal experiments (n = 6); B Line graph showing the tumor volume increase in subcutaneous tumor model mice from day 8 to 44 (n = 6); C Dissection of subcutaneous transplanted tumors in mice from each group on day 44 (n = 6); D Statistical analysis of tumor weight in subcutaneous tumor model mice on day 44 (n = 6); E TUNEL staining for apoptosis in mouse tumors from each group (n = 6); F MitoSOX immunofluorescence staining for ROS production in mouse tumor tissues from each group (n = 6). Data are presented as mean mean ± SD, with 6 nude mice in each group. *p < 0.05 compared to sh-NC group; #p < 0.05 compared to oe-NC group
Fig. 9
Fig. 9
Overexpression of SIRT1 enhances tumor growth through the BNIP3/PINK1/Parkin pathway. A Immunohistochemical staining showing the expression changes of SIRT1 protein in mouse tumor tissues from each group (n = 6); B Immunohistochemical staining showing the expression changes of FOXO3 protein in mouse tumor tissues from each group (n = 6); C Immunohistochemical staining showing the expression changes of LC3B protein in mouse tumor tissues from each group (n = 6); D Immunohistochemical staining showing the expression changes of p62 protein in mouse tumor tissues from each group (n = 6); E RT-qPCR analysis of the expression of BNIP3, PINK1, and PRKN mRNA in mouse tumor tissues from each group; F Western blot analysis of the expression of BNIP3, PINK1, and Parkin proteins in mouse tumor tissues from each group; G Immunofluorescence staining showing the expression and co-localization of PINK1 and Parkin proteins in mouse tumor tissues from each group. Data are presented as mean mean ± SD. *p < 0.05 compared to sh-NC group; #p < 0.05 compared to oe-NC group
Fig. 10
Fig. 10
Overexpression of SIRT1 enhances tumor growth by inducing cell autophagy. A Schematic diagram of the animal experiment process (n = 6); B Line graph showing the growth of subcutaneously transplanted tumors in mice from day 8 to day 36 (n = 6); C Anatomical diagram of subcutaneously transplanted tumors in mice on day 36 (n = 6); D Statistics of tumor weight in mice with subcutaneously transplanted tumors on day 36 (n = 6); E TUNEL staining to detect apoptosis of tumor cells in mice in each group (n = 6); F MitoSOX immunofluorescence staining to detect the generation of ROS in tumor tissues of mice in each group (n = 6). Data are presented as mean ± SD, with 6 nude mice in each group. *p < 0.05 compared to the PBS group; #p < 0.05 between the two groups
Fig. 11
Fig. 11
Overexpression of SIRT1 induces mitophagy and causes EC hormone Resistance. A Immunohistochemical staining to detect the expression changes of SIRT1 protein in tumor tissues of mice in each group (n = 6); B Immunohistochemical staining to detect the expression changes of FOXO3 protein in tumor tissues of mice in each group (n = 6); C Immunohistochemical staining to detect the expression changes of LC3B protein in tumor tissues of mice in each group (n = 6); D Immunohistochemical staining to detect the expression changes of p62 protein in tumor tissues of mice in each group (n = 6); E RT-qPCR to detect the expression of BNIP3, PINK1, and PRKN mRNA in tumor tissues of mice in each group; F Western blot to detect the expression of BNIP3, PINK1, and Parkin protein in tumor tissues of mice in each group; G Immunofluorescence staining to detect the expression and colocalization of PINK1 and Parkin proteins in tumor tissues of mice in each group. Data are presented as mean ± SD. *p < 0.05 compared to the PBS group; #p < 0.05 between the two groups

Similar articles

Cited by

References

    1. Akbar MJ, Lukasewicz Ferreira PC, Giorgetti M, Stokes L, Morris CJ. Bombesin receptor-targeted liposomes for enhanced delivery to lung cancer cells. Beilstein J Nanotechnol. 2019;10:2553–62. 10.3762/bjnano.10.246. 10.3762/bjnano.10.246 - DOI - PMC - PubMed
    1. Alves-Fernandes DK, Jasiulionis MG. The role of SIRT1 on DNA damage response and epigenetic alterations in cancer. Int J Mol Sci. 2019;20(13):3153. 10.3390/ijms20133153. 10.3390/ijms20133153 - DOI - PMC - PubMed
    1. Asaka R, Miyamoto T, Yamada Y, et al. Sirtuin 1 promotes the growth and cisplatin resistance of endometrial carcinoma cells: a novel therapeutic target. Lab Invest. 2015;95(12):1363–73. 10.1038/labinvest.2015.119. 10.1038/labinvest.2015.119 - DOI - PubMed
    1. Ashrafizadeh M, Zhang W, Zou R, Sethi G, Klionsky DJ, Zhang X. A bioinformatics analysis, pre-clinical and clinical conception of autophagy in pancreatic cancer: Complexity and simplicity in crosstalk. Pharmacol Res. 2023;194: 106822. 10.1016/j.phrs.2023.106822. 10.1016/j.phrs.2023.106822 - DOI - PubMed
    1. Ayturk U. RNA-seq in skeletal biology. Curr Osteoporos Rep. 2019;17(4):178–85. 10.1007/s11914-019-00517-x. 10.1007/s11914-019-00517-x - DOI - PubMed

LinkOut - more resources