. 2024 Sep 12;22(1):205.
doi: 10.1186/s12915-024-01970-6.

The subcellular distribution of miRNA isoforms, tRNA-derived fragments, and rRNA-derived fragments depends on nucleotide sequence and cell type

Affiliations

The subcellular distribution of miRNA isoforms, tRNA-derived fragments, and rRNA-derived fragments depends on nucleotide sequence and cell type

Tess Cherlin et al. BMC Biol. .

Abstract

Background: MicroRNA isoforms (isomiRs), tRNA-derived fragments (tRFs), and rRNA-derived fragments (rRFs) represent most of the small non-coding RNAs (sncRNAs) found in cells. Members of these three classes modulate messenger RNA (mRNA) and protein abundance and are dysregulated in diseases. Experimental studies to date have assumed that the subcellular distribution of these molecules is well-understood, independent of cell type, and the same for all isoforms of a sncRNA.

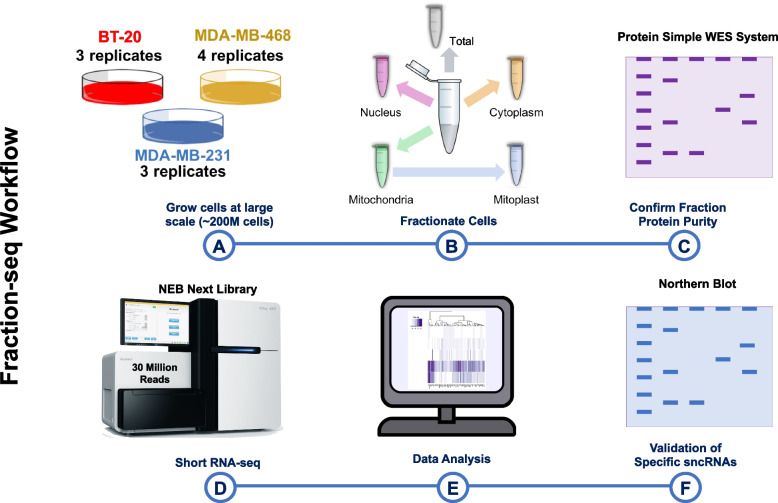
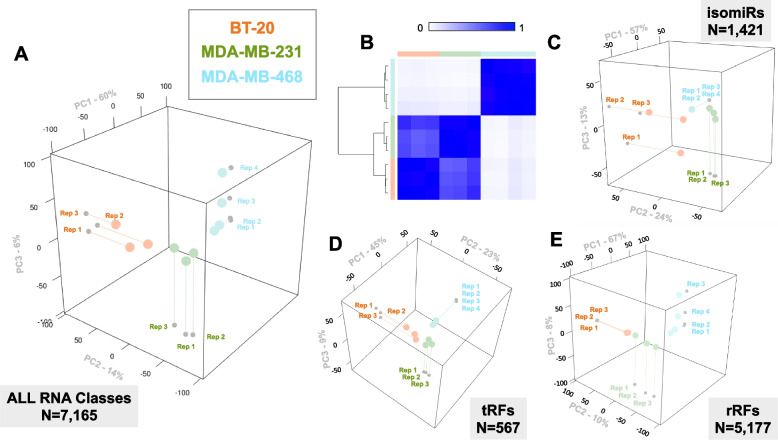
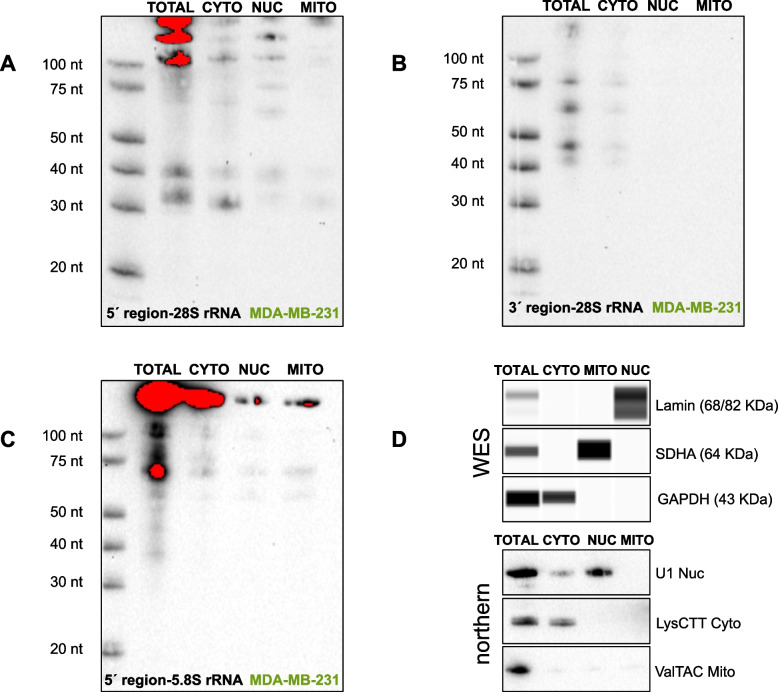
Results: We tested these assumptions by investigating the subcellular distribution of isomiRs, tRFs, and rRFs in biological replicates from three cell lines from the same tissue and same-sex donors that model the same cancer subtype. In each cell line, we profiled the isomiRs, tRFs, and rRFs in the nucleus, cytoplasm, whole mitochondrion (MT), mitoplast (MP), and whole cell. Using a rigorous mathematical model we developed, we accounted for cross-fraction contamination and technical errors and adjusted the measured abundances accordingly. Analyses of the adjusted abundances show that isomiRs, tRFs, and rRFs exhibit complex patterns of subcellular distributions. These patterns depend on each sncRNA's exact sequence and the cell type. Even in the same cell line, isoforms of the same sncRNA whose sequences differ by a few nucleotides (nts) can have different subcellular distributions.

Conclusions: SncRNAs with similar sequences have different subcellular distributions within and across cell lines, suggesting that each isoform could have a different function. Future computational and experimental studies of isomiRs, tRFs, and rRFs will need to distinguish among each molecule's various isoforms and account for differences in each isoform's subcellular distribution in the cell line at hand. While the findings add to a growing body of evidence that isomiRs, tRFs, rRFs, tRNAs, and rRNAs follow complex intracellular trafficking rules, further investigation is needed to exclude alternative explanations for the observed subcellular distribution of sncRNAs.

Keywords: Small non-coding RNAs; isomiRs; miRNA isoforms; miRNAs; microRNAs; rRFs; rRNA-derived fragments; sncRNAs; subcellular distribution; tRFs; tRNA-derived fragments.


Conflict of interest statement

The authors declare that they have no competing interests.

Figures

Fig. 1
Fig. 1
Overview of the Fraction-seq workflow. A Three TNBC cell lines BT-20 (three replicates), MDA-MB-231 (three replicates), and MDA-MB-468 (four replicates) were grown to ~ 200 M cells and harvested. B From the same starting material, we separated cells into total, nuclear, cytoplasmic, MT, and MP subcellular compartments. C We used the WES protein detection assay to analyze cell compartment markers in each cell fraction. D We prepared libraries for short RNA-seq using NEBNext with 100 ng RNA from each sample, followed by RNA sequencing using the Illumina NextSeq 500 platform at 75 cycles and an average depth of 30 million reads per biosample. E After quality trimming and adapter removal, we mapped reads to isomiRs, tRFs, and rRFs, considering only sncRNAs with lengths between 18 and 50 nts and normalizing their abundance by the respective biospecimen’s sequencing depth. Reads with normalized abundances ≤ 10 RPM were not considered. F We used northern blotting to validate the subcellular enrichments of select sncRNAs. Parts of this image were created with BioRender.com
Fig. 2
Fig. 2
The profiles of sncRNAs among the replicates are reproducible. A Principal Component Analysis (PCA) visualization of the sncRNAs with an average abundance ≥ 10 RPM across replicates (n = 7165). B Hierarchical clustering of the Pearson correlations for replicates from each cell line with sncRNA abundances ≥ 10 RPM. The color bar represents the Pearson correlation values, which range from 0 (white, uncorrelated) to 1 (blue, perfectly correlated). C PCA visualization of isomiRs in each sample with an average abundance ≥ 10 RPM across replicates (n = 1421). D PCA visualization of the tRFs in each sample with an average abundance ≥ 10 RPM across replicates (n = 567). E PCA of the rRFs in each sample with an average abundance ≥ 10 RPM across replicates (n = 5177). All panels: BT-20 samples are represented by orange, MDA-MB-231 samples are represented by green, and MDA-MB-468 samples are represented by cyan
Fig. 3
Fig. 3
The most abundant sncRNAs are cell-line- and subcellular-compartment-specific. A Venn diagram of the 10% most abundant sncRNAs in the three TNBC cell lines (BT-20, MDA-MB-231, and MDA-MB468) based on average abundance. BD Venn diagrams of the 10% most abundant sncRNAs in each compartment of BT-20 (B), MDA-MB-231 (C), and MDA-MB-468 (D) cells based on average abundance across replicates. Colors for panels BD: nucleus (Nuc)—green, cytoplasm (Cyto)—yellow, MT—purple, and MP—gray
Fig. 4
Fig. 4
Examples of subcellular enrichments using abundance-based ranking within a fraction. A Percentile-colored heatmap for select sncRNAs in total RNA and the nucleus, cytoplasm, MT, and MP for MDA-MB-231. B An analogous heatmap for MDA-MB-468 cells and a different collection of sncRNAs. For each sncRNA, we list its nucleotide sequence, the parental RNA from which the sncRNA arises, and the location of the sncRNA within the parental RNA. Red dotted lines separate each list into three groups: sncRNAs that are enriched primarily in the nucleus, the cytoplasm, or the MT, respectively
Fig. 5
Fig. 5
Model-adjusted abundances of isomiRs from the miR-19/92 cluster in different subcellular compartments. Heatmap of average reconstructed abundances of isomiRs from the miR-17/92 cluster (“oncomiR-1”) in BT-20 and MDA-MB-231 cell fractions. The shown abundances are model-adjusted RPM values. The isomiRs highlighted in green are the reference isoforms found in miRBase
Fig. 6
Fig. 6
Abundance and subcellular compartment enrichments of sncRNA from tRNAs belonging to the same isodecoder. A Nucleotide sequences and an alignment of two tRNAs belonging to the same isodecoder (LysCTT). The tRNAs differ by a single nucleotide at position 29. The highlighted text shows the region that our northern blot probe targets. B A heatmap showing abundances for 20 distinct tRFs from the same two tRNAs, in total RNA and the cytoplasmic fraction averaged across the replicates of BT-20, MDA-MB-231, and MDA-MB-468 cells. These abundances correspond to measurements after they were adjusted by our mixed-effects model to remove cross-fraction contamination and errors. C Summed adjusted abundances of tRFs bound by the probe shown in panel A above. D A northern blot showing the short RNAs (range: 20–40 nts) that we detected using 5 μg of total and cytoplasmic RNA. Full-length tRNALysCTT was used as a loading control
Fig. 7
Fig. 7
Subcellular compartment enrichments for 45S-derived rRFs. A. Northern blots showing rRFs that arise from the 5′ region of 28S rRNA in total RNA and the cytoplasmic, nuclear, and MT fractions. B Analogous blots for rRFs that arise from the 3′ region of 28S rRNA. C Analogous blots for an rRF from the 5.8S rRNA (see also text). All lanes were loaded with equivalent RNA. All experiments were carried out with MDA-MB-231 cells. D WES markers to assay the protein purity of the fractions and northern blot RNA markers to assay the RNA composition of the fractions. Note the different order of the lanes in the WES and northern panels

References

    1. Cherlin T, Magee R, Jing Y, Pliatsika V, Loher P, Rigoutsos I. Ribosomal RNA fragmentation into short RNAs (rRFs) is modulated in a sex- and population of origin-specific manner. BMC Biol. 2020;18(1):38. 10.1186/s12915-020-0763-0 - DOI - PMC - PubMed
    1. Giuliani A, Londin E, Ferracin M, Mensa E, Prattichizzo F, Ramini D, et al. Long-term exposure of human endothelial cells to metformin modulates miRNAs and isomiRs. Sci Rep. 2020;10(1):21782. 10.1038/s41598-020-78871-5 - DOI - PMC - PubMed
    1. Loher P, Londin ER, Rigoutsos I. IsomiR expression profiles in human lymphoblastoid cell lines exhibit population and gender dependencies. Oncotarget. 2014;5(18):8790–802. 10.18632/oncotarget.2405 - DOI - PMC - PubMed
    1. Pliatsika V, Loher P, Telonis AG, Rigoutsos I. MINTbase: a framework for the interactive exploration of mitochondrial and nuclear tRNA fragments. Bioinformatics. 2016;32(16):2481–9. 10.1093/bioinformatics/btw194 - DOI - PMC - PubMed
    1. Telonis AG, Loher P, Jing Y, Londin E, Rigoutsos I. Beyond the one-locus-one-miRNA paradigm: microRNA isoforms enable deeper insights into breast cancer heterogeneity. Nucleic Acids Res. 2015;43(19):9158–75. 10.1093/nar/gkv922 - DOI - PMC - PubMed

LinkOut - more resources