. 2024 Sep 12;19(1):125.
doi: 10.1186/s13020-024-00993-z.

DMDD, isolated from Averrhoa carambola L., ameliorates diabetic nephropathy by regulating endoplasmic reticulum stress-autophagy crosstalk

Affiliations

DMDD, isolated from Averrhoa carambola L., ameliorates diabetic nephropathy by regulating endoplasmic reticulum stress-autophagy crosstalk

Jianmei Shi et al. Chin Med. .

Abstract

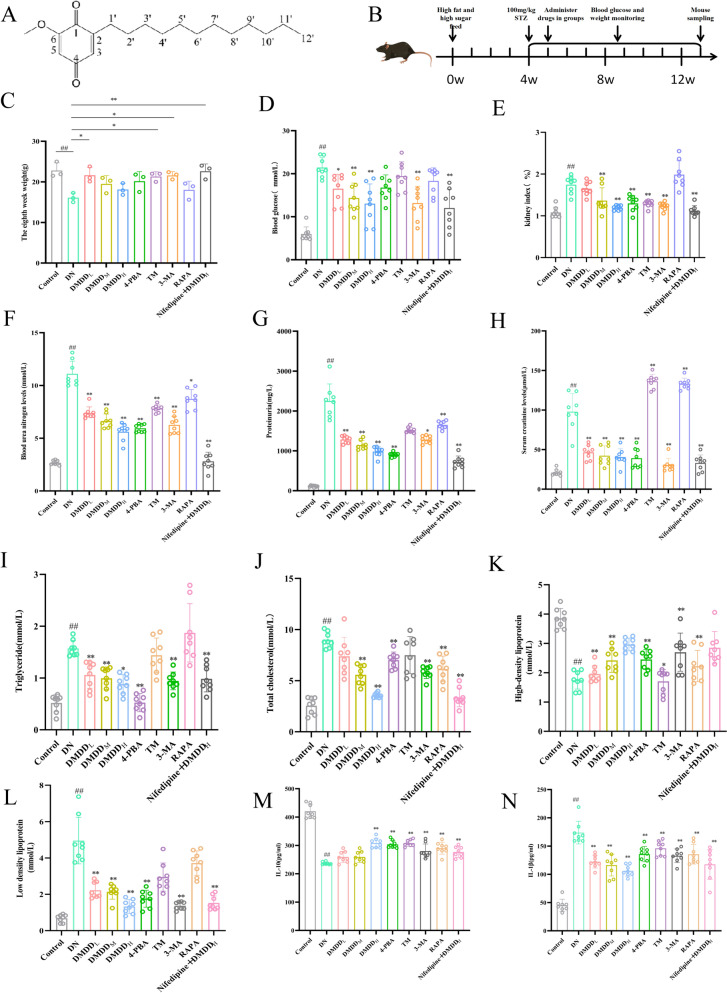
Background: Studies have shown that Averrhoa carambola L. possesses therapeutic potential for diabetes and related complications. However, the specific beneficial effects and molecular mechanisms of 2-dodecyl-6-meth-oxycyclohexa-2,5-diene-1,4-dione (DMDD) isolated from Averrhoa carambola L. on diabetic nephropathy (DN) require further investigation.

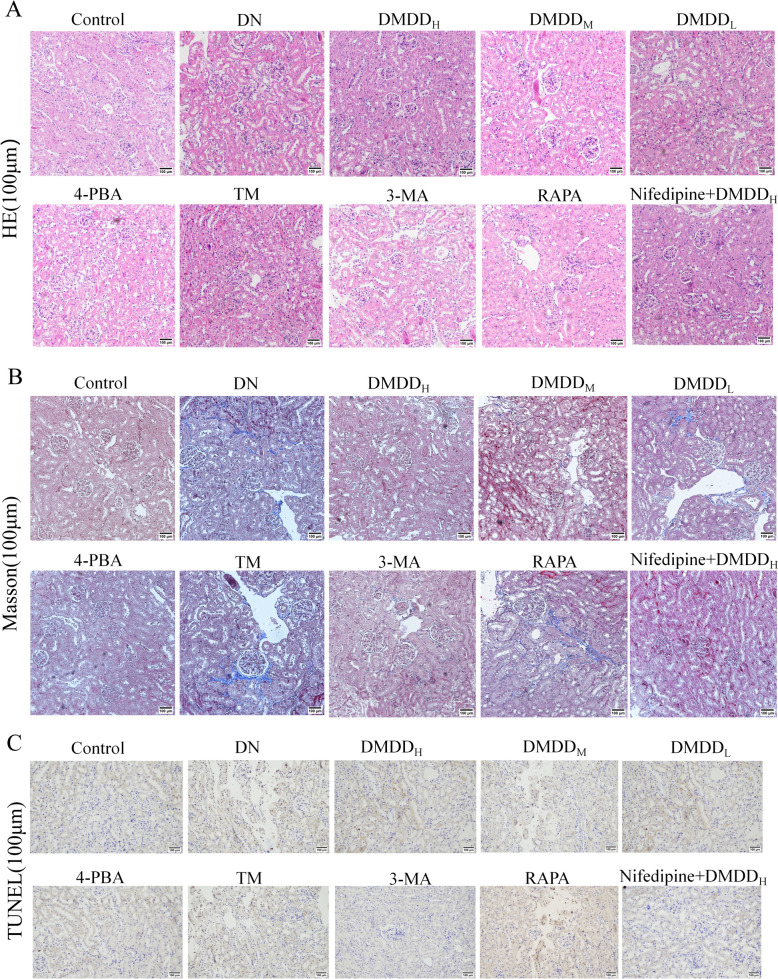
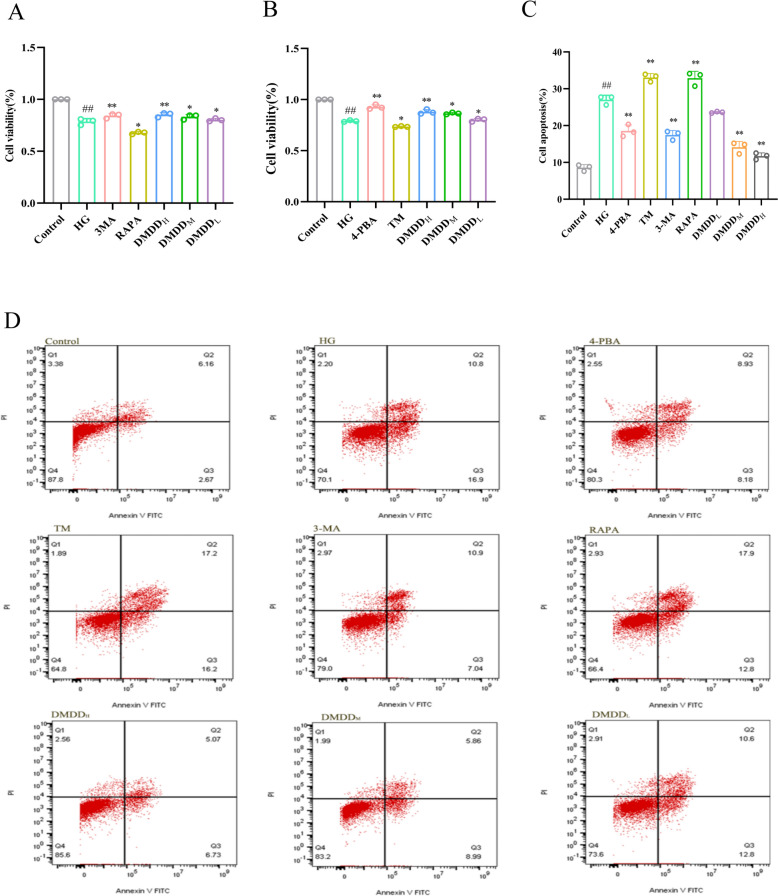
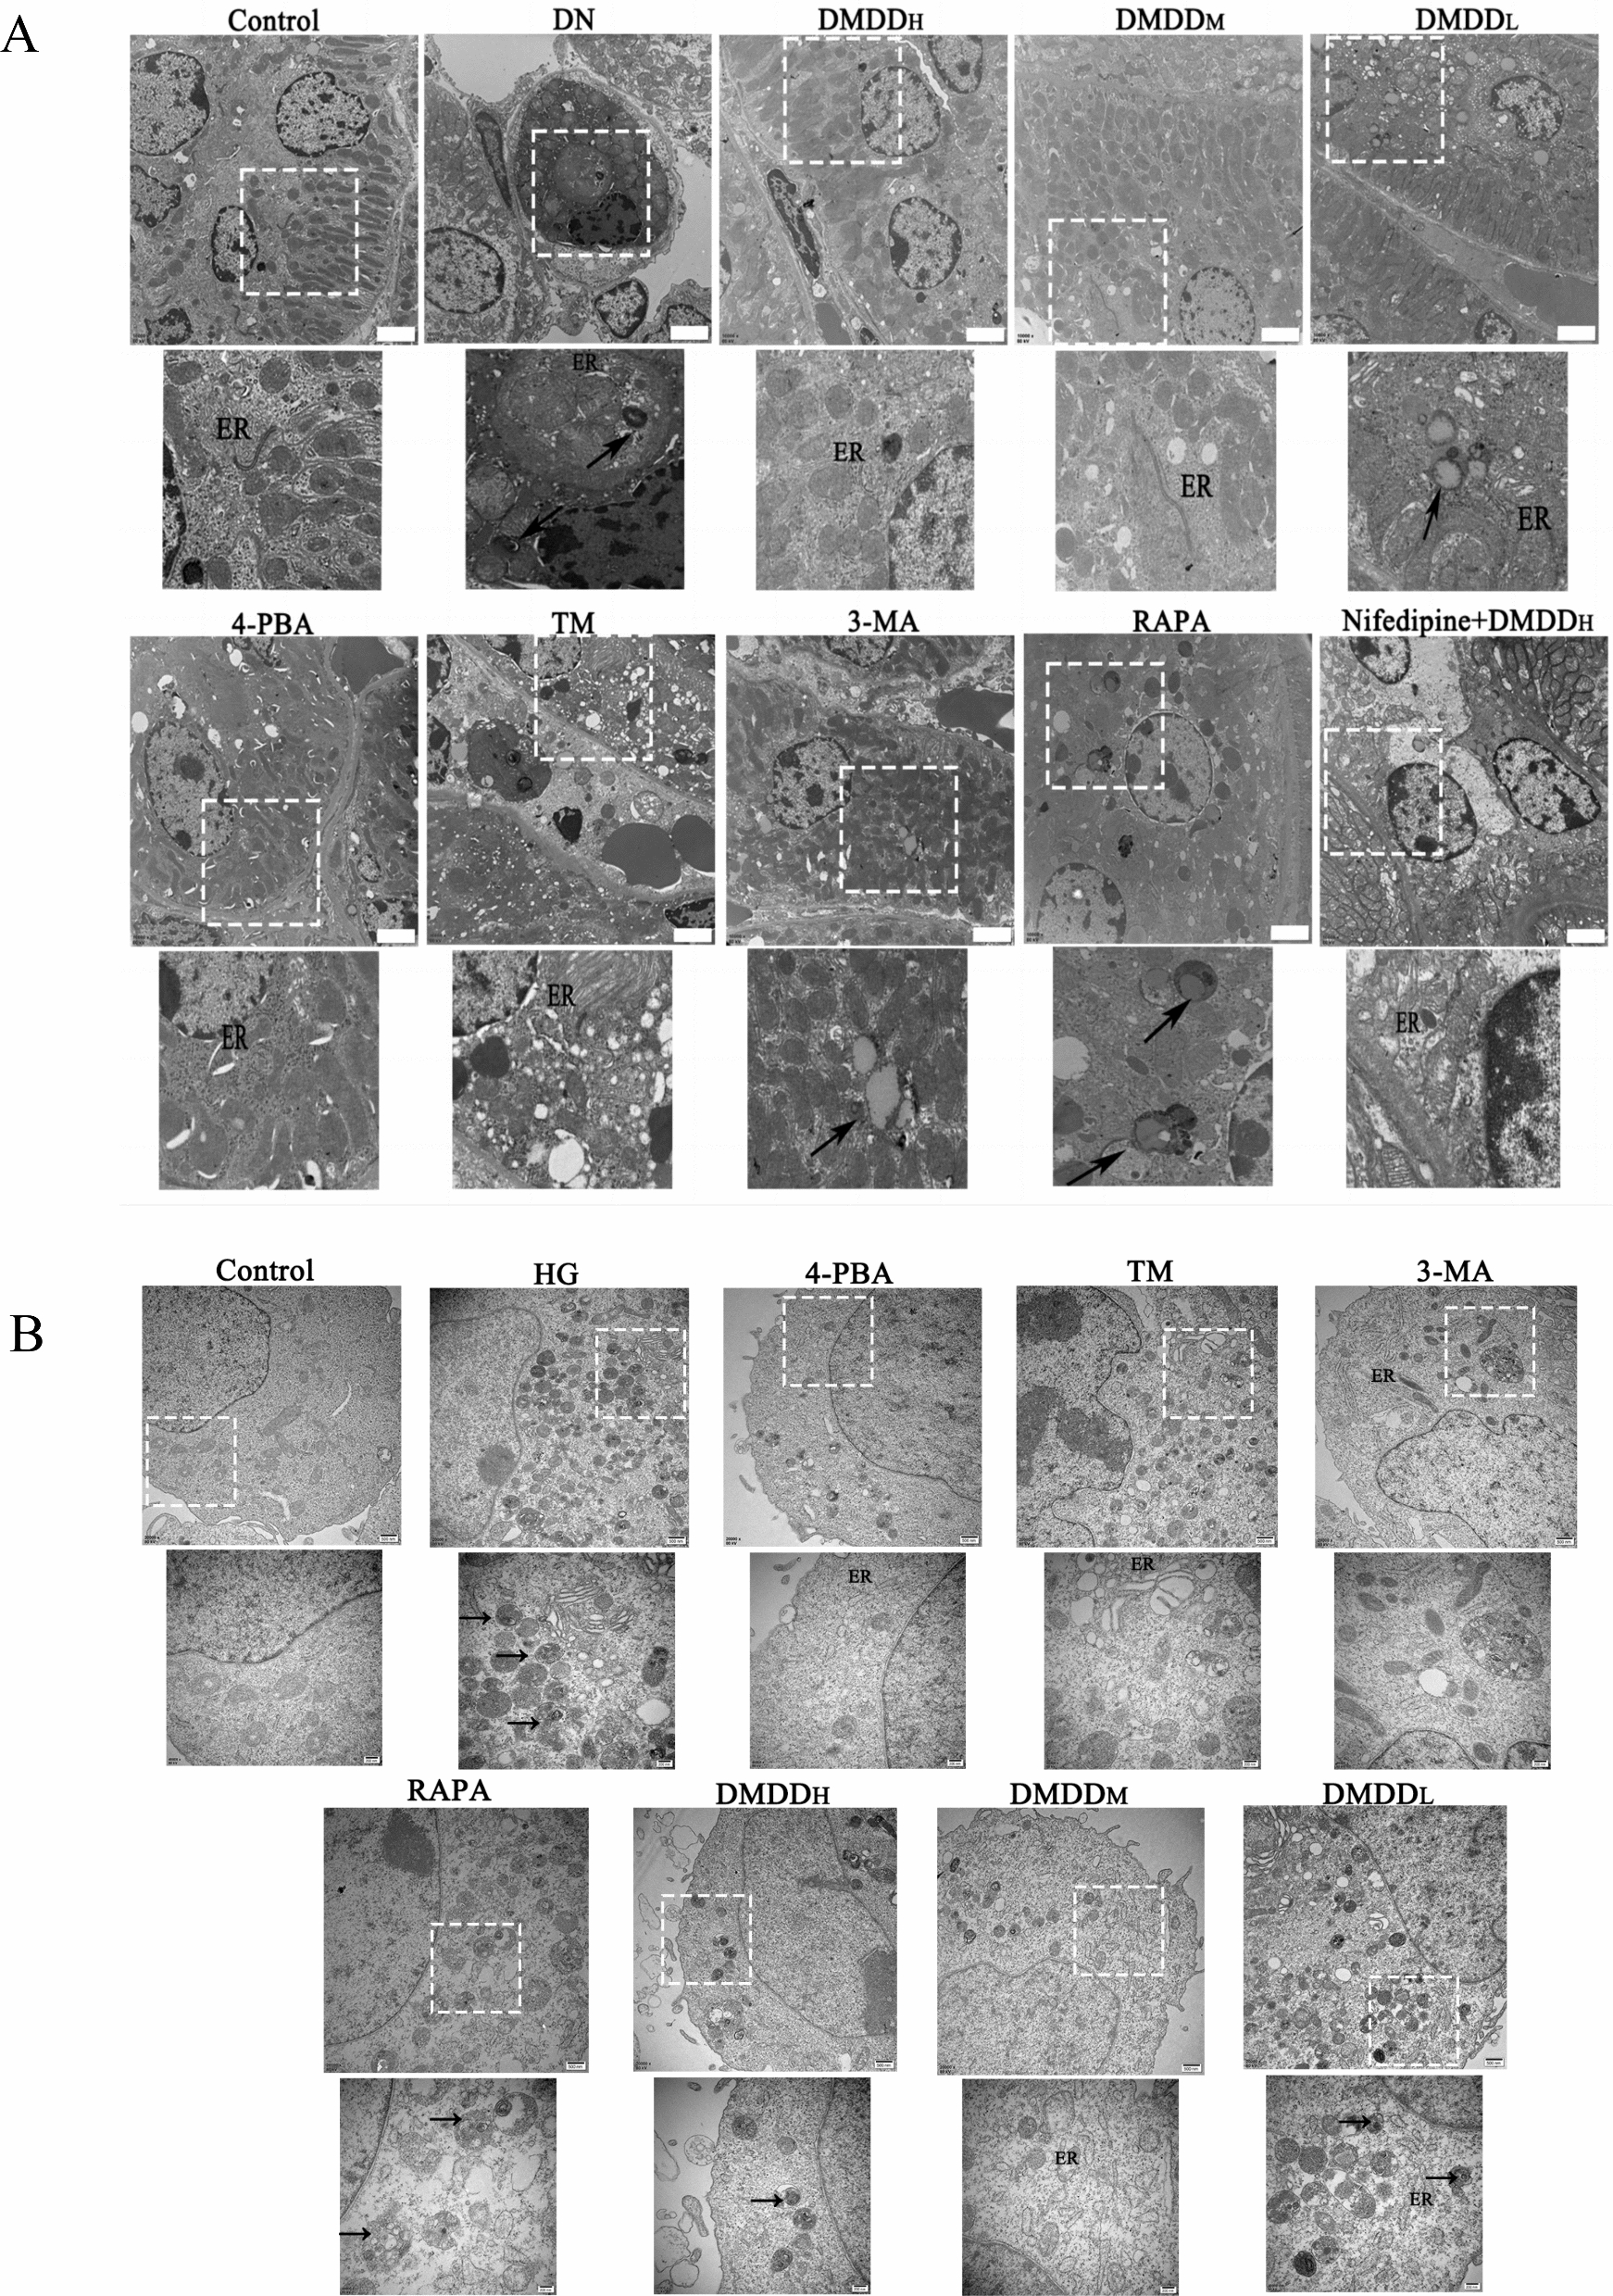
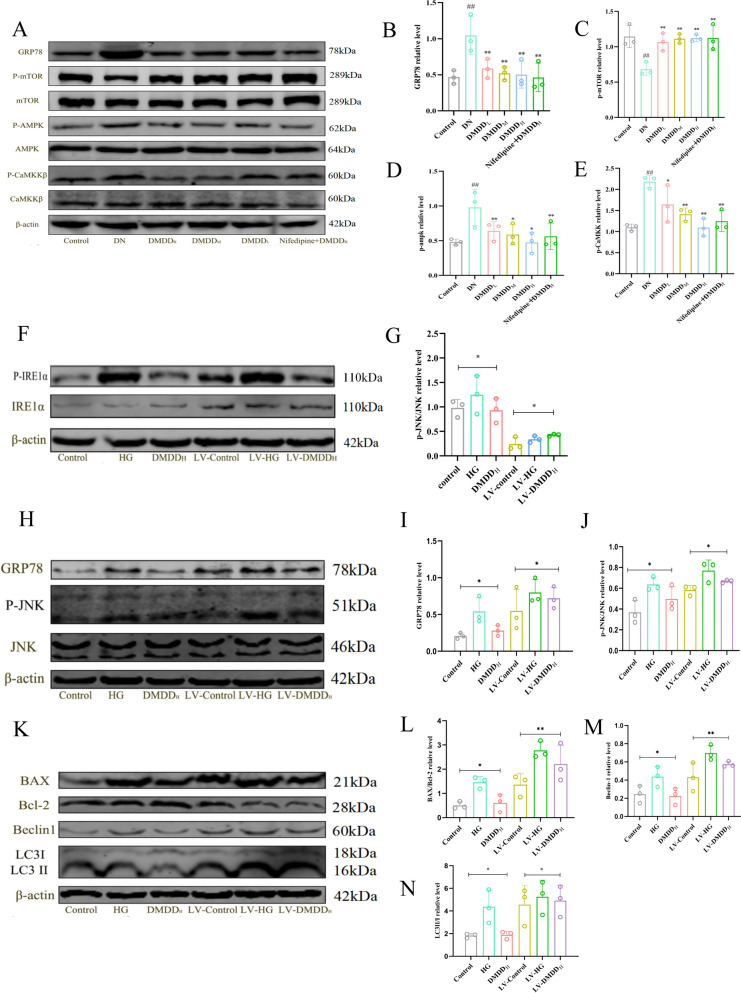
Methods: 80 C57BL/6 J male mice were subjected to a 1-week adaptive feeding, followed by a high-fat diet and intraperitoneal injection of 100 mg/kg streptozotocin (STZ) to construct an in vivo DN model. Additionally, human renal proximal tubular epithelial cells (HK-2) induced by high glucose (HG) were used as an in vitro DN model. The expression levels of epithelial-mesenchymal transition (EMT), endoplasmic reticulum stress (ERS), and autophagy-related proteins in renal tubular cells were detected by Western Blot, flow cytometry, immunofluorescence, and enzyme-linked immunosorbent assay (ELISA) staining. Transcriptome analysis revealed was conducted to elucidate the specific mechanism of by which DMDD mitigates DN by inhibiting ERS and autophagy. HK-2 cells were transfected with IRE1α overexpression lentivirus to reveal the role of IRE1α overexpression in HG-induced HK-2.

Results: The experimental data showed that DMDD significantly reduced blood glucose levels and improved renal pathological alterations in DN mice. Additionally, DMDD inhibited the calcium (Ca2+) pathway, manifested by decreased autophagosome formation and downregulation of LC3II/I, Beclin-1, and ATG5 expression. Moreover, in HG-induced HK-2 cells, DMDD suppressed the overexpression of GRP78, CHOP, LC3II/I, Beclin1, and ATG5. Notably, IRE1α overexpression significantly increased autophagy incidence; however, DMDD treatment subsequently reduced the expression of LC3II/I, Beclin1, and ATG5.

Conclusion: DMDD effectively inhibits excessive ERS and autophagy, thereby reducing renal cell apoptosis through the IRE1α pathway and Ca 2+ pathway.

Keywords: 2-Dodecyl-6-Meth-Oxycyclohexa-2,5-Diene-1,4-Dione; Autophagy; Diabetic nephropathy; Endoplasmic reticulum stress.


Conflict of interest statement

The authors declare that the research was conducted in the absence of any commercial or financial relationships that could be construed as a potential competing interests.

Figures

Fig. 1
Fig. 1
Effects of DMDD on renal function, blood lipids, and inflammatory factors in DN mice. A Chemical structure formula of DMDD; B Flowchart depicting the establishment of the in vivo DN model; C Body weight changes of mice in each group during the 8-week post-administration; D Blood glucose levels of mice in each group after 8 weeks of DMDD administration following successful establishment of the DN in vivo model; E Renal index changes in mice in each group after 8 weeks of DMDD administration following the successful modeling of the DN in vivo model; FH Effects of DMDD administration on renal function in mice; IL Effects of DMDD on blood lipids in mice after Nifedipine + DMDD administration; MN Effects of DMDD administration on inflammatory factors IL-10 and IL1β levels. The Control group refers to the normal group, DN group to the diabetic nephropathy model group, DMDDL, DMDDM, and DMDDH represent low-, medium-, and high-dose DMDD groups, respectively. Additionally, 4-PBA group denotes the endoplasmic reticulum stress inhibitor 4-PBA group, TM group denotes the endoplasmic reticulum stress agonist TM group, 3-MA group denotes the autophagy inhibitor 3-MA group, RAPA group denotes the autophagy agonist RAPA group, and Nifedipine + DMDDH group denotes nifedipine group + DMDD high-dose group. Data are expressed as mean ± SD (n = 8). Statistical significance: compared to the normal group, #P < 0.05, ##P < 0.01; compared to the model group, *P < 0.05, **P < 0.01
Fig. 2
Fig. 2
Effect of DMDD on histopathological kidney damage in DN mice. A HE staining. showing reduced cell infiltration. Scale bars 100 μm. B Masson staining. Scale bars 100 μm. C TUNEL staining. Scale bar " -" = 100 μm. The Control group denotes the normal group, DN group denotes the diabetic nephropathy model group, DMDDL, DMDDM, and DMDDH represent low-, medium-, and high-dose DMDD groups, respectively, 4-PBA group indicates endoplasmic reticulum stress inhibitor 4- PBA group, TM group denotes the endoplasmic reticulum stress agonist TM group, 3-MA group denotes the autophagy inhibitor 3-MA group, RAPA group denotes the autophagy agonist RAPA group, and Nifedipine + DMDDH group denotes the nifedipine group + DMDD high-dose group. (n = 8)
Fig. 3
Fig. 3
Docking results and transcriptional analysis of the target protein IRE1α and DMDD. A 3D structure of IRE1α constructed using PyMol-based amino acid sequence; B Visualization of the 7 active centers of IRE1α predicted by software; C Visualization of the 7 docking pockets of IRE1α with specific conformations; D Green fluttering bands in the figure represent the IRE1α target proteins, with the yellow stick indicating the DMDD small molecule structure. E After the docking between DMDD and IRE1α was completed, relevant calculations were conducted to determine the docking results data. F Docking scores for IRE1α activity pockets are shown in the figure; G Wayne plots. B indicates the normal group, C indicates the model group, and M indicates the model group; H GO enrichment analysis. I KEGG enrichment bar graph
Fig. 4
Fig. 4
Effects of DMDD on HK-2 cells. A Effects of 3-MA group, RAPA group and different DMDD dosages HK-2 cell viability; B Effects of different doses of 4-PBA group, TM group and DMDD administration group on HK-2 cell viability; C Effect of DMDD on the apoptotic rate of HK-2 cells; D Flow cytometry analysis of DMDD’s effect on the apoptosis of HK-2 cells. The Control group denotes the normal group, the HG group denotes the HK-2 high-glucose model group, DMDDL, DMDDM, and DMDDH represent low-, medium-, and high-dose DMDD groups, respectively, 3-MA group represents autophagy inhibitor 3-MA group, and RAPA group denotes the autophagy agonist RAPA group. Data are expressed as mean ± SD (n = 8). Statistical significance: compared to the normal group, #P < 0.05, ##P < 0.01; compared to the model group, *P < 0.05, **P < 0.01
Fig. 5
Fig. 5
Effect of DMDD on epithelial-mesenchymal transition in HK-2 cells. AC Immunofluorescence detection results; DM Effect of DMDD on cellular pro-fibrotic factors. The Control group indicates the normal group, HG group indicates the high-glucose group, DMDDL, DMDDM, and DMDDH represent low-, medium-, and high-dose DMDD groups, respectively, 4-PBA group indicates the low-dose group of DMDD, and 4-PBA group indicates the high-dose group of DMDD. group, 4-PBA group denotes the endoplasmic reticulum stress inhibitor 4-PBA group, TM group denotes the endoplasmic reticulum stress agonist TM group, 3-MA group denotes the autophagy inhibitor 3-MA group, and RAPA group denotes the autophagy agonist RAPA group. Data are expressed as mean ± SD (n = 8). Statistical significance: compared to the normal group, #P < 0.05, ##P < 0.01; compared to the model group, *P < 0.05, **P < 0.01
Fig. 6
Fig. 6
Effect of DMDD on the expression levels of GRP78, CHOP, BAX, Bcl-2 proteins. AC Effect of DMDD on the expression levels of GRP78 and CHOP proteins in kidney tissues of DN mice. DF Effects of DMDD on the expression levels of GRP78 and CHOP proteins in high glucose-induced HK-2 cells. G, H Effect of DMDD on the expression levels of BAX and Bcl-2 proteins in high-glucose-induced HK-2 cells. The Control group indicates the normal group, HG group indicates the high glucose group, DMDDL group indicates the DMDD low-dose group, DMDDM group indicates the DMDD medium-dose group, DMDDH group indicates the DMDD high-dose group, 4-PBA group indicates the endoplasmic reticulum stress inhibitor 4-PBA group, and TM group indicates the endoplasmic reticulum stress agonist TM group. Data are demonstrated as mean ± SD (n = 8), statistical significance: compared to the normal group, #P < 0.05, ##P < 0.01; compared to the model group, *P < 0.05, **P < 0.01
Fig. 7
Fig. 7
Effects of DMDD on the ultrastructure of kidneys and HK-2 cells in DN mice. A Effects of DMDD on the ultrastructure of kidney in DN mice; B Effects of DMDD on the ultrastructure of HK-2 cells. "Black arrow" represents autophagic vesicles or autophagic lysosomes; "ER" denotes endoplasmic reticulum. The control group denotes the normal group, DN group denotes the diabetic nephropathy mouse model group, HG group denotes the high glucose HK-2 cells group, DMDDL group denotes the DMDD low-dose group, DMDDM group denotes DMDD medium-dose group, DMDDH group denotes DMDD high-dose group, 4-PBA group denotes 4-PBA group, TM group denotes the endoplasmic reticulum stress inhibitor group, TM group denotes the endoplasmic reticulum stress agonist group, 3-MA group denotes the autophagy inhibitor group, 3-MA group, RAPA group denotes the autophagy agonist (RAPA) group, and Nifedipine + DMDDH group denotes nifedipine + DMDD high-dose group
Fig. 8
Fig. 8
Effect of DMDD on HK-2 cells. A Observation of autophagic flux by confocal laser scanning microscopy. GFP fluoresces shows green, and mRFP fluoresces red under a laser confocal microscope; BE Effects of DMDD on the expression levels of autophagy-related proteins LC3I, LC3II, Beclin 1, and ATG 5 in high glucose-induced HK-2 cells. The Control group signifies the normal group, HG group treatment the HK-2 high-glucose model group, DMDDL indicates the DMDD low-dose group, DMDDM indicates the DMDD medium-dose group, DMDDH represents the DMDD high-dose group, 3-MA indicates the autophagy inhibitor 3-MA group, and RAPA indicates the autophagy agonist RAPA group. Data are demonstrated as mean ± SD (n = 8), statistical significance: compared to the normal group, #P < 0.05, ##P < 0.01; compared to the model group, *P < 0.05, **P < 0.01
Fig. 9
Fig. 9
Effect of DMDD on the expression of ERS-autophagy signaling pathway protein levels in mouse kidney tissues. AE Effect of different dosage administration groups of DMDD on the expression levels of GRP78, p-mTOR, mTOR, p-AMPK, AMPK, p-CaMKKβ, CaMKKβ proteins in kidney tissues of DN mice. FG Effects of different dosage administration groups of DMDD on the expression levels of p-IRE1α and IRE1α proteins in high glucose-induced HK-2 cells after transfection. HJ Effect of varying dosage administration groups on the protein expression levels of GRP78, p-JNK, and JNK in high glucose-induced HK-2 cells after transfection. expression levels. KN Effect of different dosage groups of DMDD on the protein expression levels of Beclin-2, LC3 I, and LC3 II in high glucose-induced HK-2 cells after transfection. Note: The Control group indicates the normal group, the HG group indicates the high-glucose model group of HK-2 cells, the LV-DMDDL group indicates the low-dose transfected DMDD group DMDD, and the LV -DMDDM group denotes the DMDD medium-dose transfected DMDD group, and LV-DMDDH group denotes the high-dose transfected DMDD group after transfection. Data are performed as mean ± SD (n = 8), statistical significance: compared to the normal group, #P < 0.05, ##P < 0.01; compared to the model group, *P < 0.05, **P < 0.01
Fig. 10
Fig. 10
DMDD alleviates the mechanism of ERS-autophagy in HK-2 cells induced by high glucose and diabetic nephropathy in mice. The figure shows that DMDD mitigates excessive ER stress and autophagy by reducing Ca2+ concentration and inhibiting CaMKKβ and IRE1α pathways. Consequently, this intervention alleviates kidney damage, including proteinuria and renal fibrosis, thereby delaying the onset and progression of DN

Similar articles

Cited by

References

    1. Haraguchi R, Kohara Y, Matsubayashi K, Kitazawa R, Kitazawa S. New insights into the pathogenesis of diabetic nephropathy: proximal renal tubules are primary target of oxidative stress in diabetic kidney. Acta Histochem Cytochem. 2020;53(2):21–31. 10.1267/ahc.20008 - DOI - PMC - PubMed
    1. Liu BC, Tang TT, Lv LL, Lan HY. Renal tubule injury: a driving force toward chronic kidney disease. Kidney Int. 2018;93(3):568–79. 10.1016/j.kint.2017.09.033 - DOI - PubMed
    1. Eriguchi M, Lin M, Yamashita M, et al. Renal tubular ACE-mediated tubular injury is the major contributor to microalbuminuria in early diabetic nephropathy. Am J Physiol Renal Physiol. 2018;314(4):F531-f542. 10.1152/ajprenal.00523.2017 - DOI - PMC - PubMed
    1. Yuan D, Liu XM, Fang Z, et al. Protective effect of resveratrol on kidney in rats with diabetic nephropathy and its effect on endoplasmic reticulum stress. Eur Rev Med Pharmacol Sci. 2018;22(5):1485–93. - PubMed
    1. Liu Y, Xu D, Wang L, et al. MBTPS2 exacerbates albuminuria in streptozotocin-induced type I diabetic nephropathy by promoting endoplasmic reticulum stress-mediated renal damage. Arch Physiol Biochem. 2022;128(4):1050–7. 10.1080/13813455.2020.1749084 - DOI - PubMed

LinkOut - more resources