. 2024 Sep 12;22(1):556.
doi: 10.1186/s12951-024-02783-z.

A novel spherical GelMA-HAMA hydrogel encapsulating APET×2 polypeptide and CFIm25-targeting sgRNA for immune microenvironment modulation and nucleus pulposus regeneration in intervertebral discs

Affiliations

A novel spherical GelMA-HAMA hydrogel encapsulating APET×2 polypeptide and CFIm25-targeting sgRNA for immune microenvironment modulation and nucleus pulposus regeneration in intervertebral discs

Xiao-Jun Yu et al. J Nanobiotechnology. .

Abstract

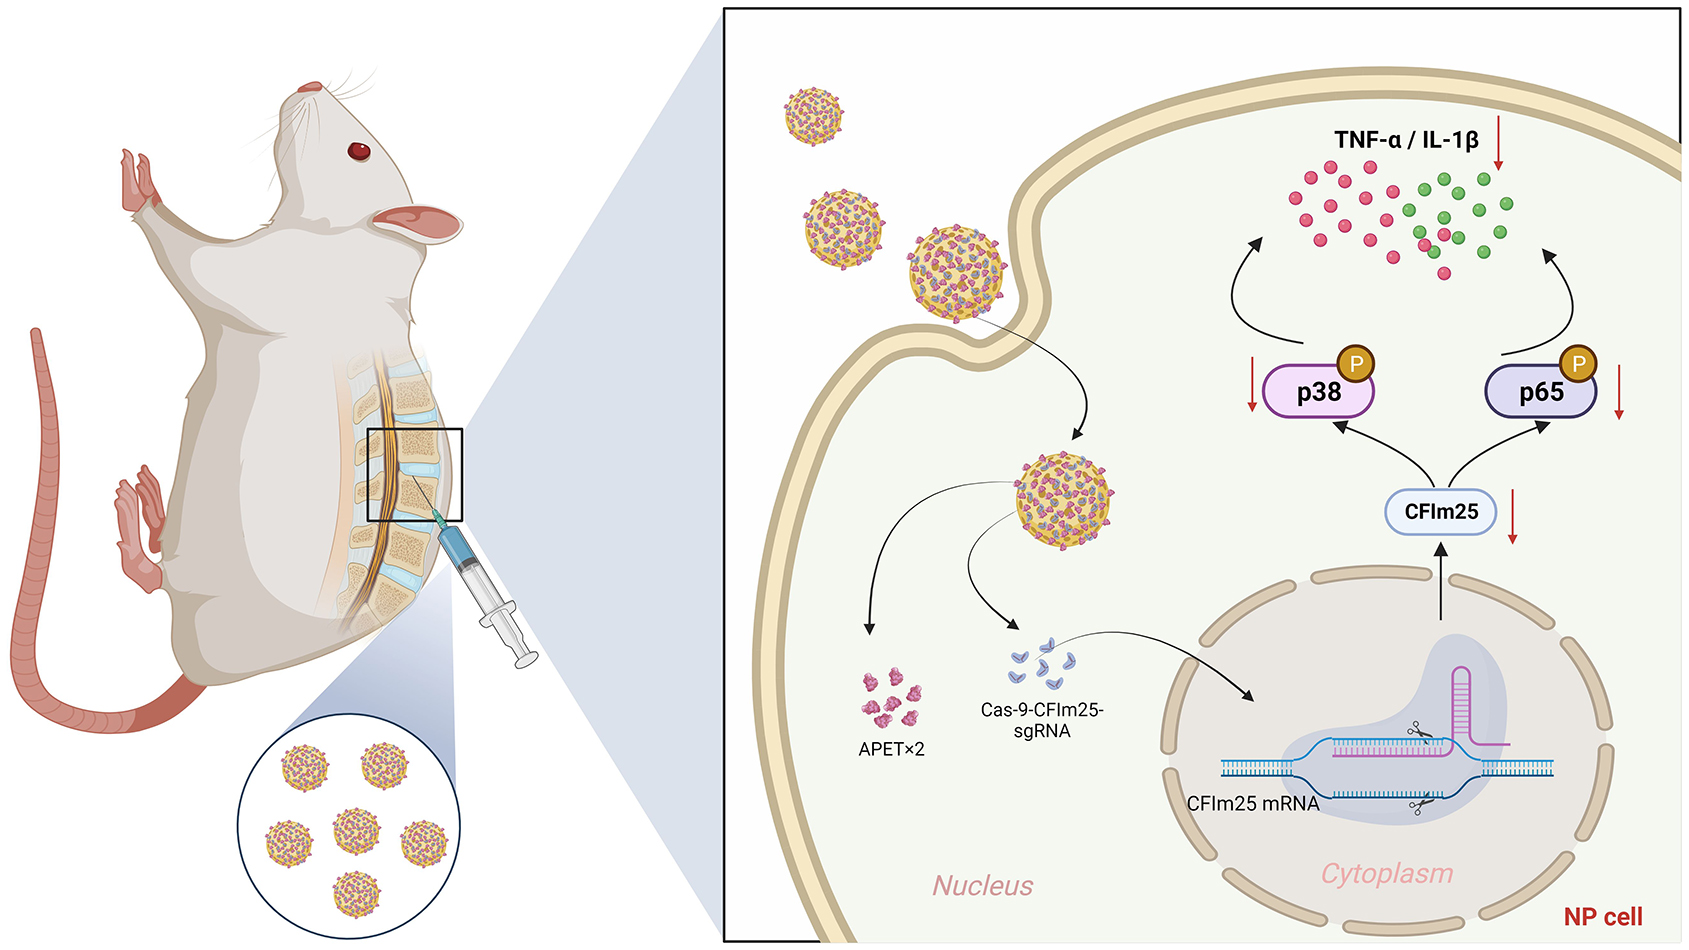
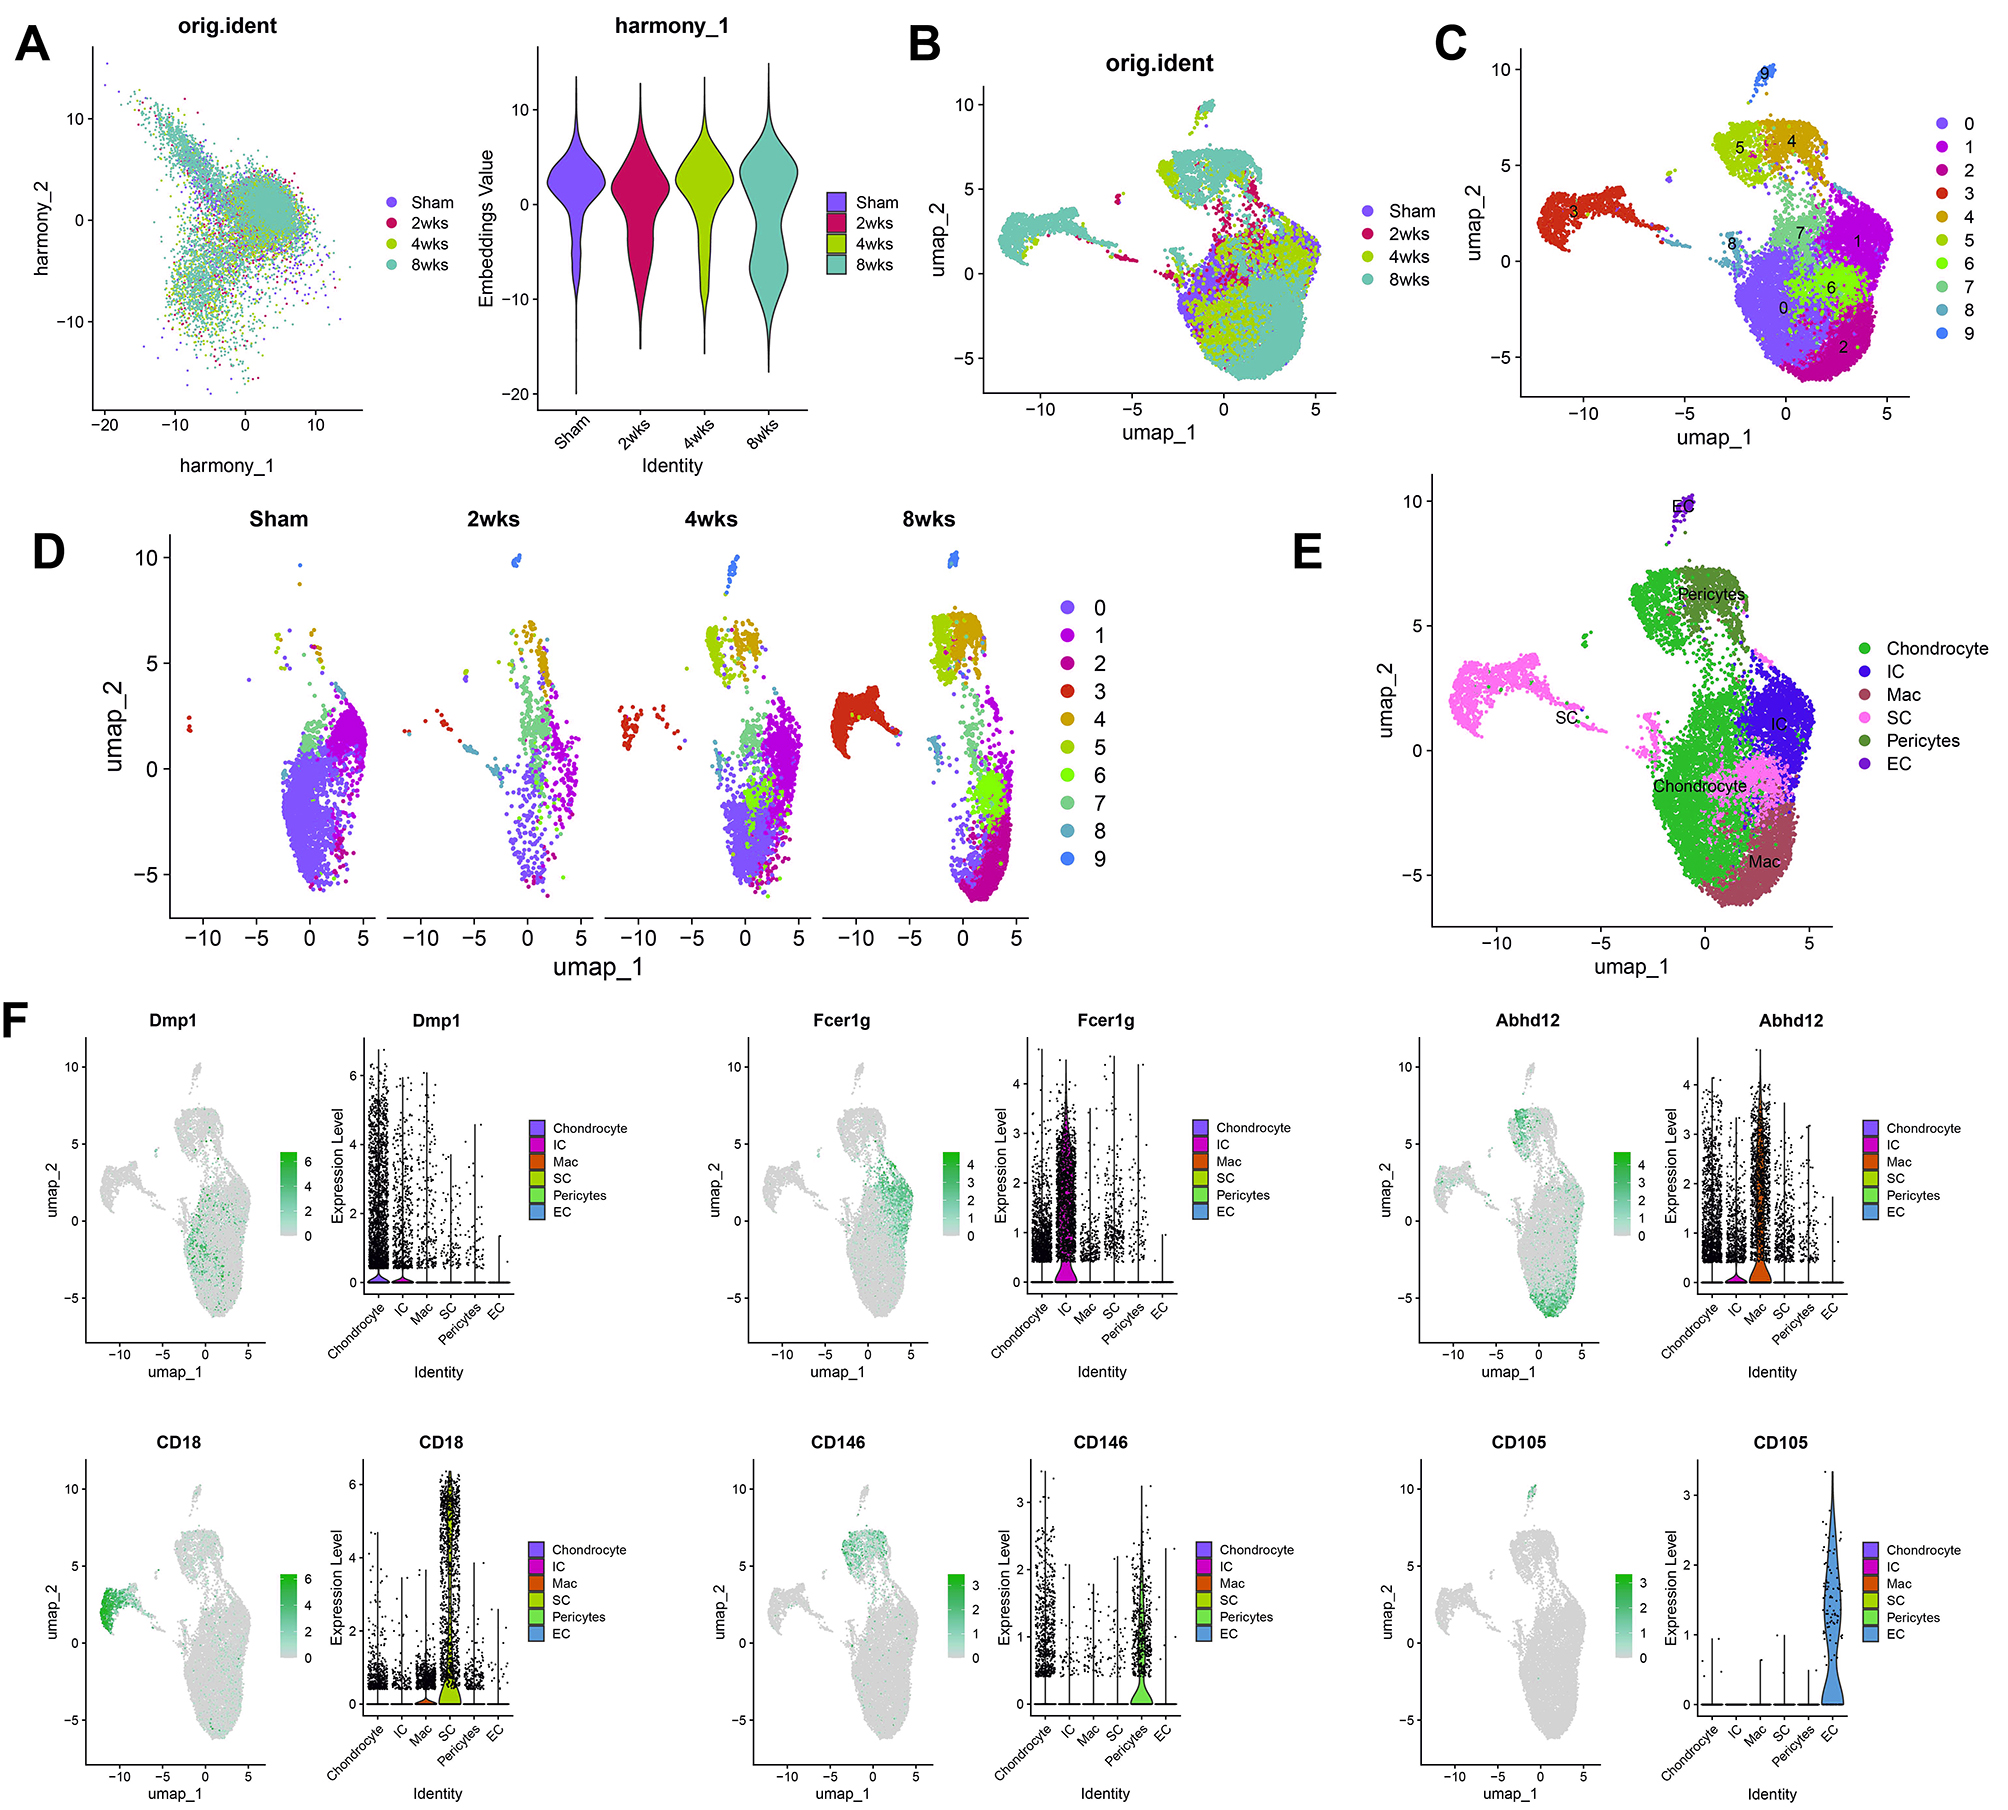
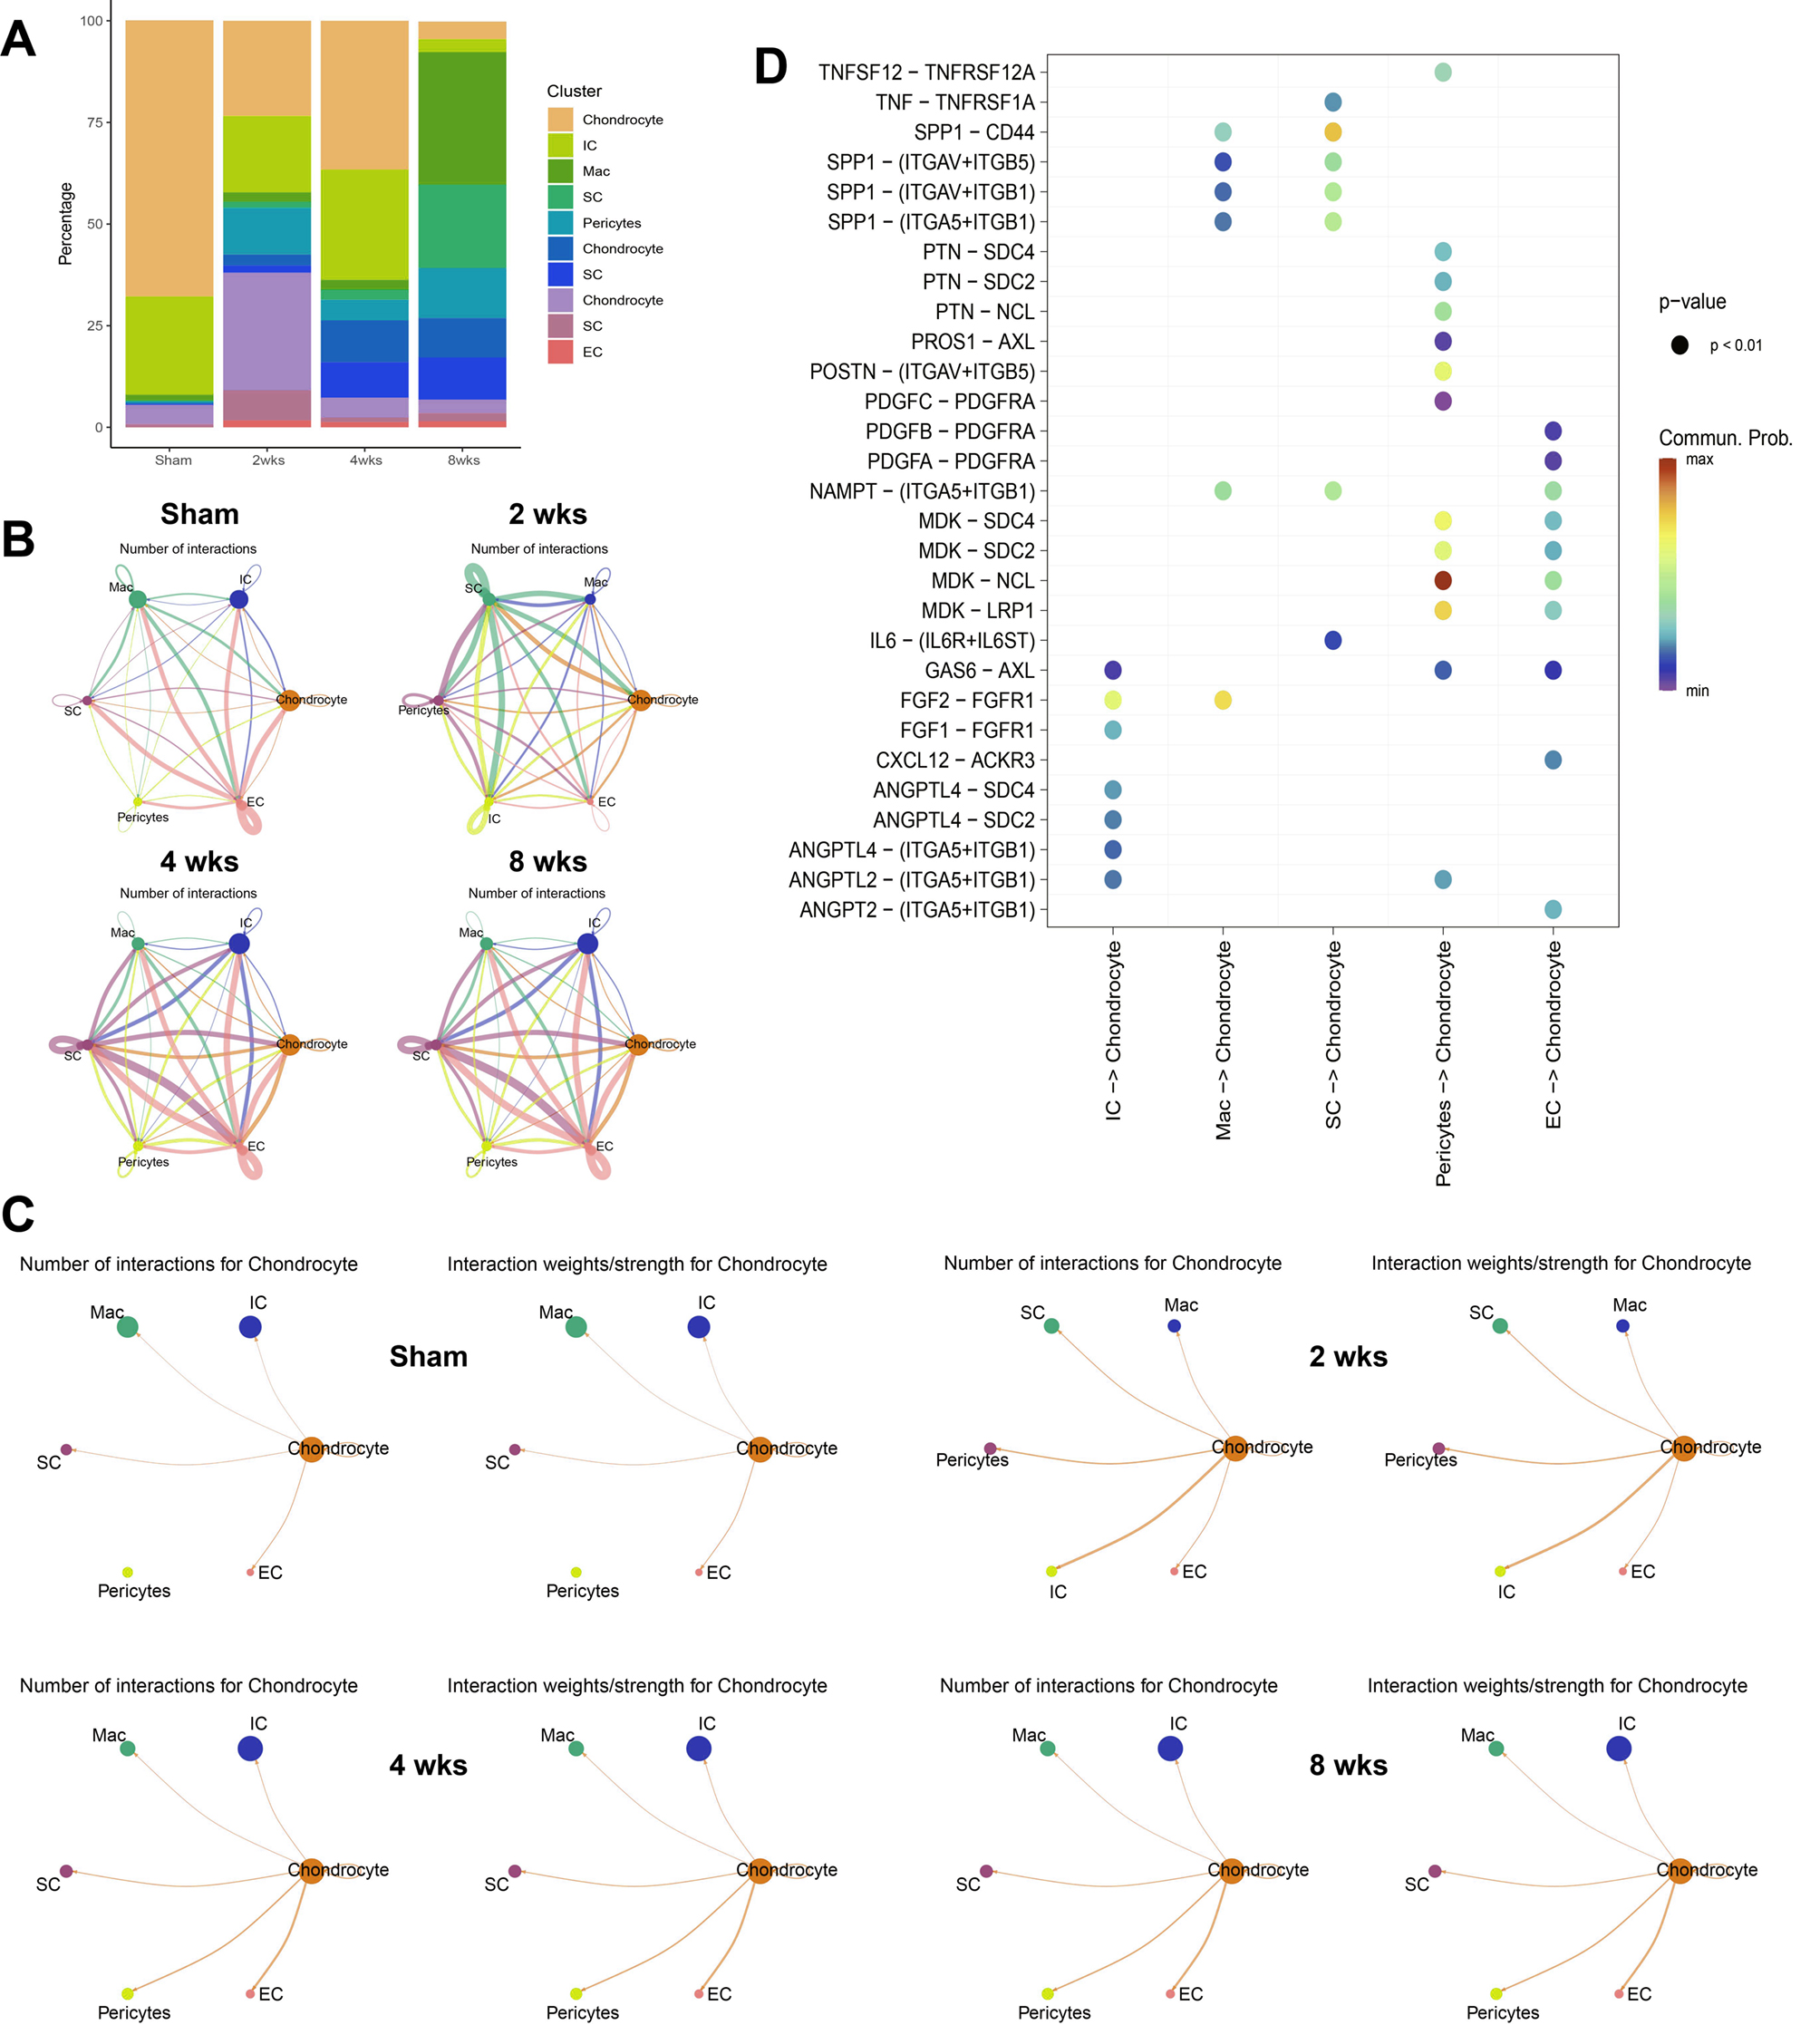
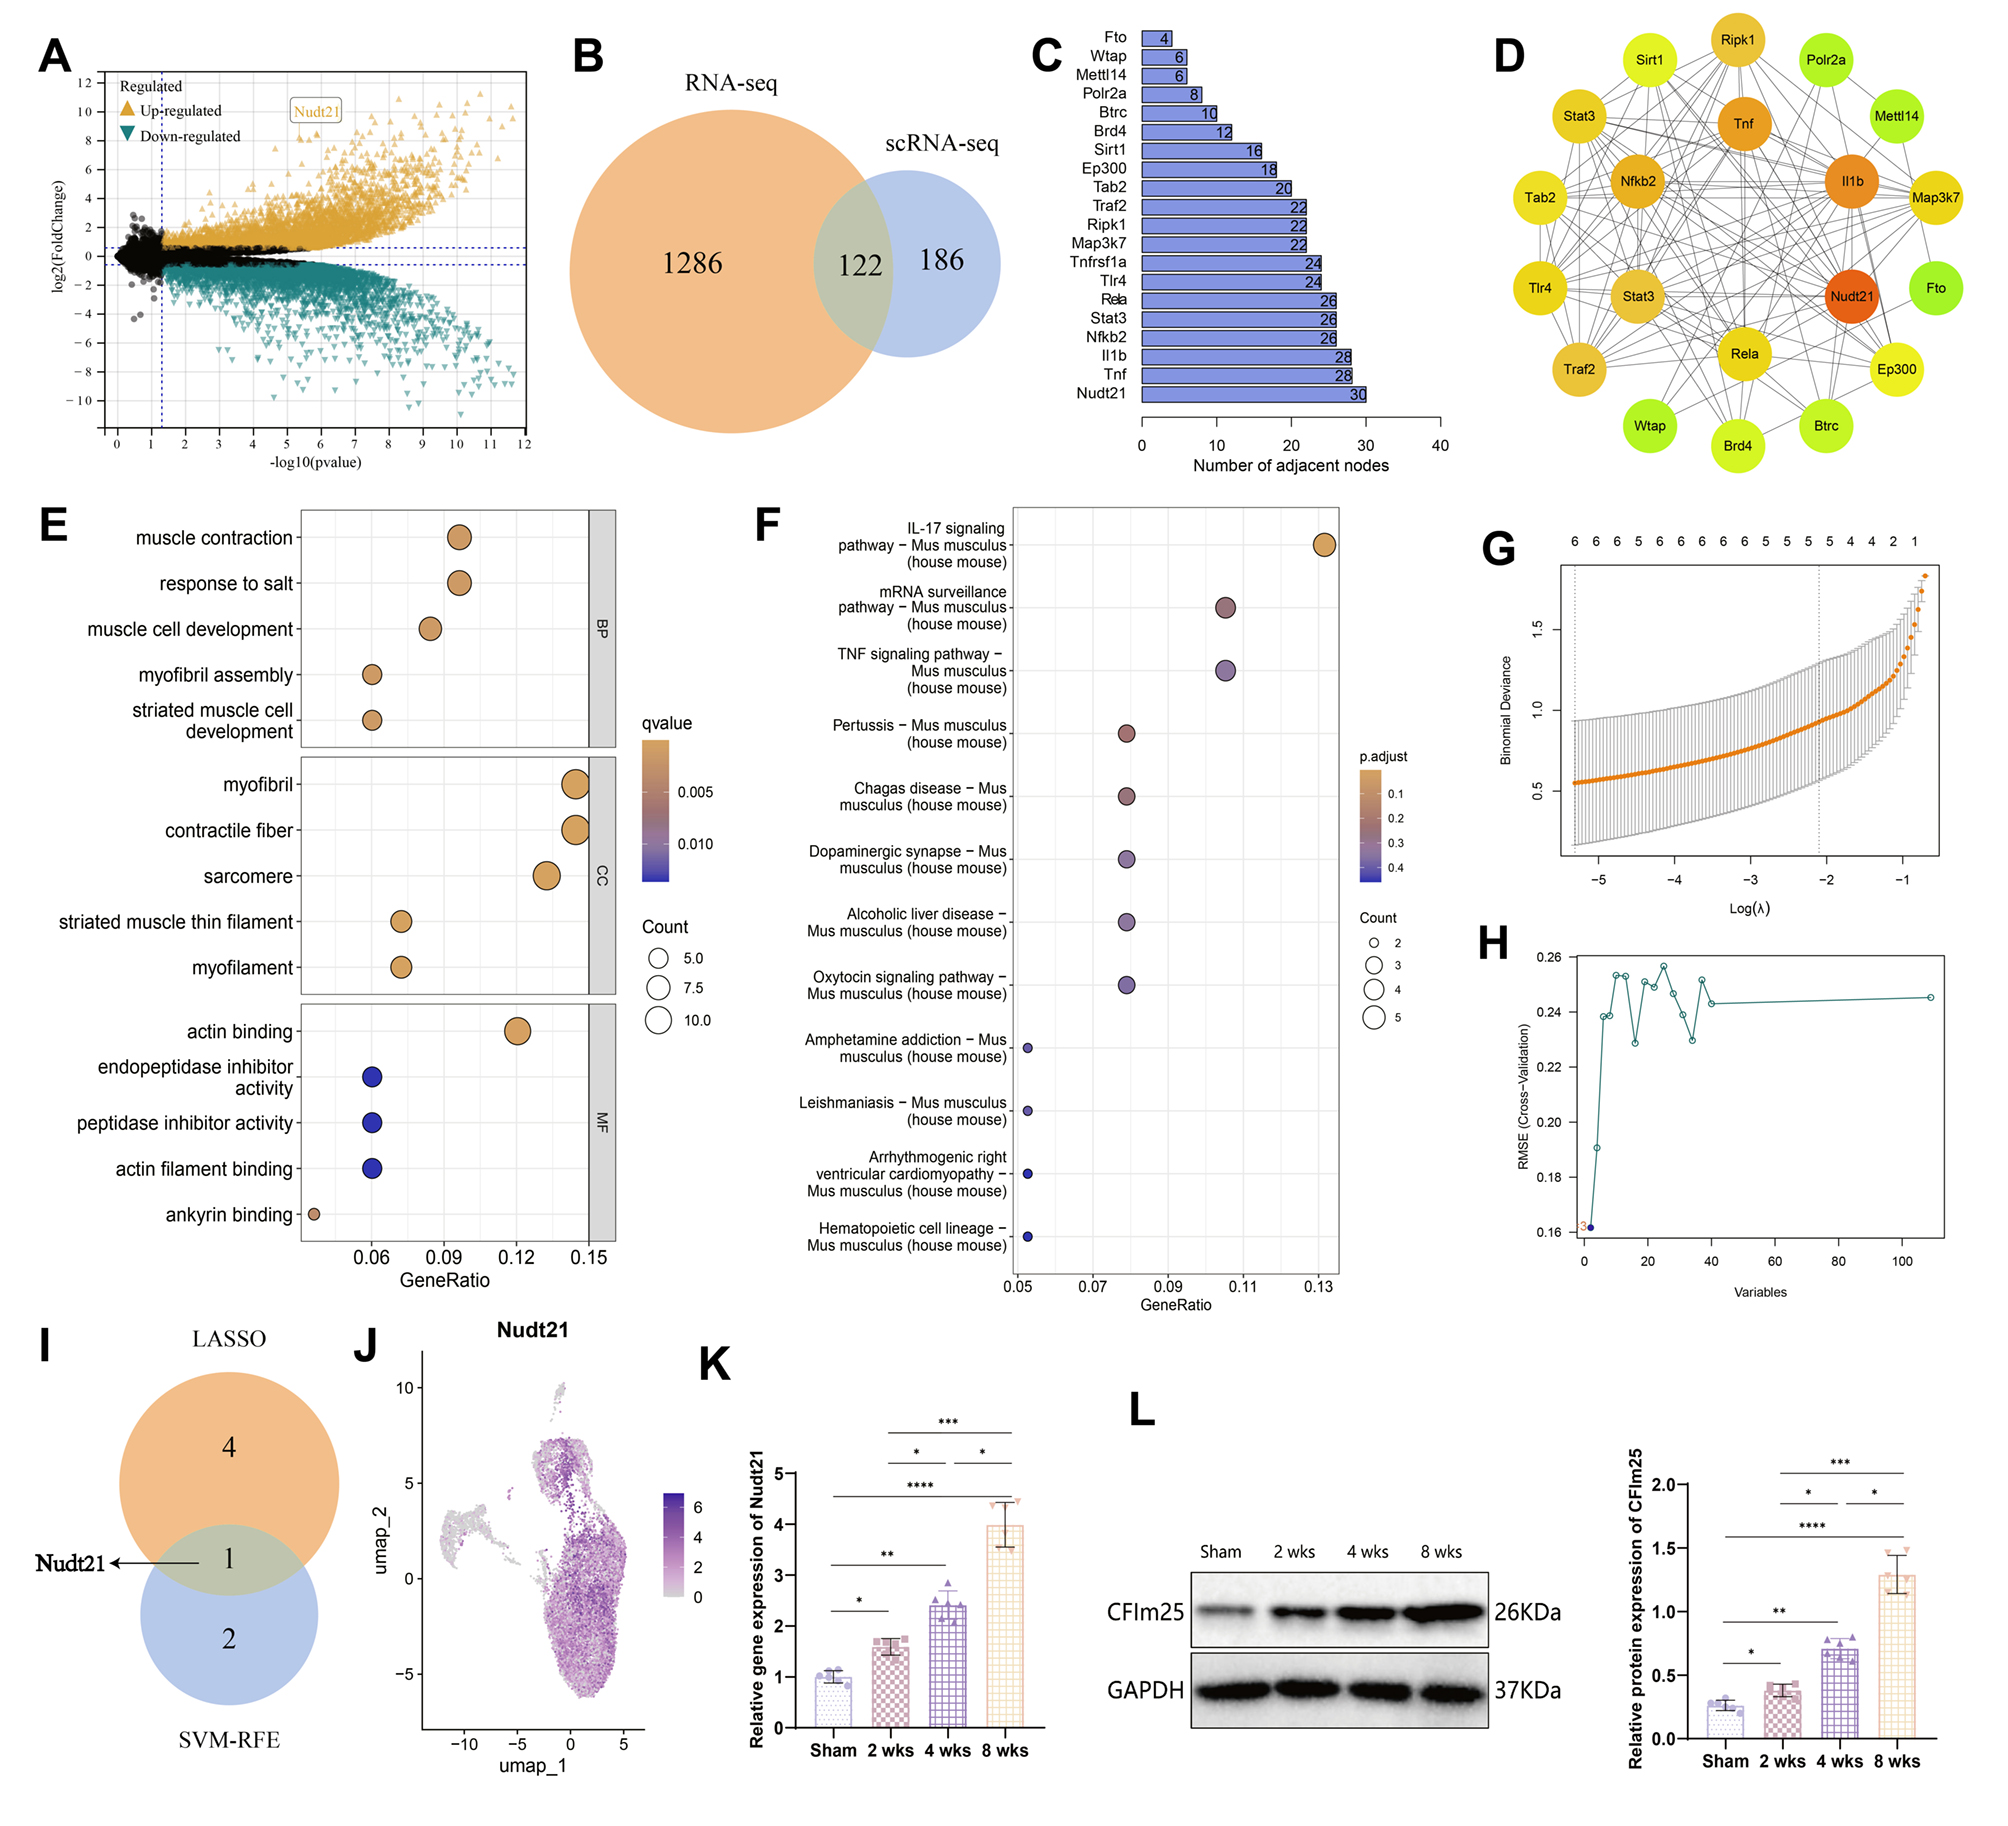
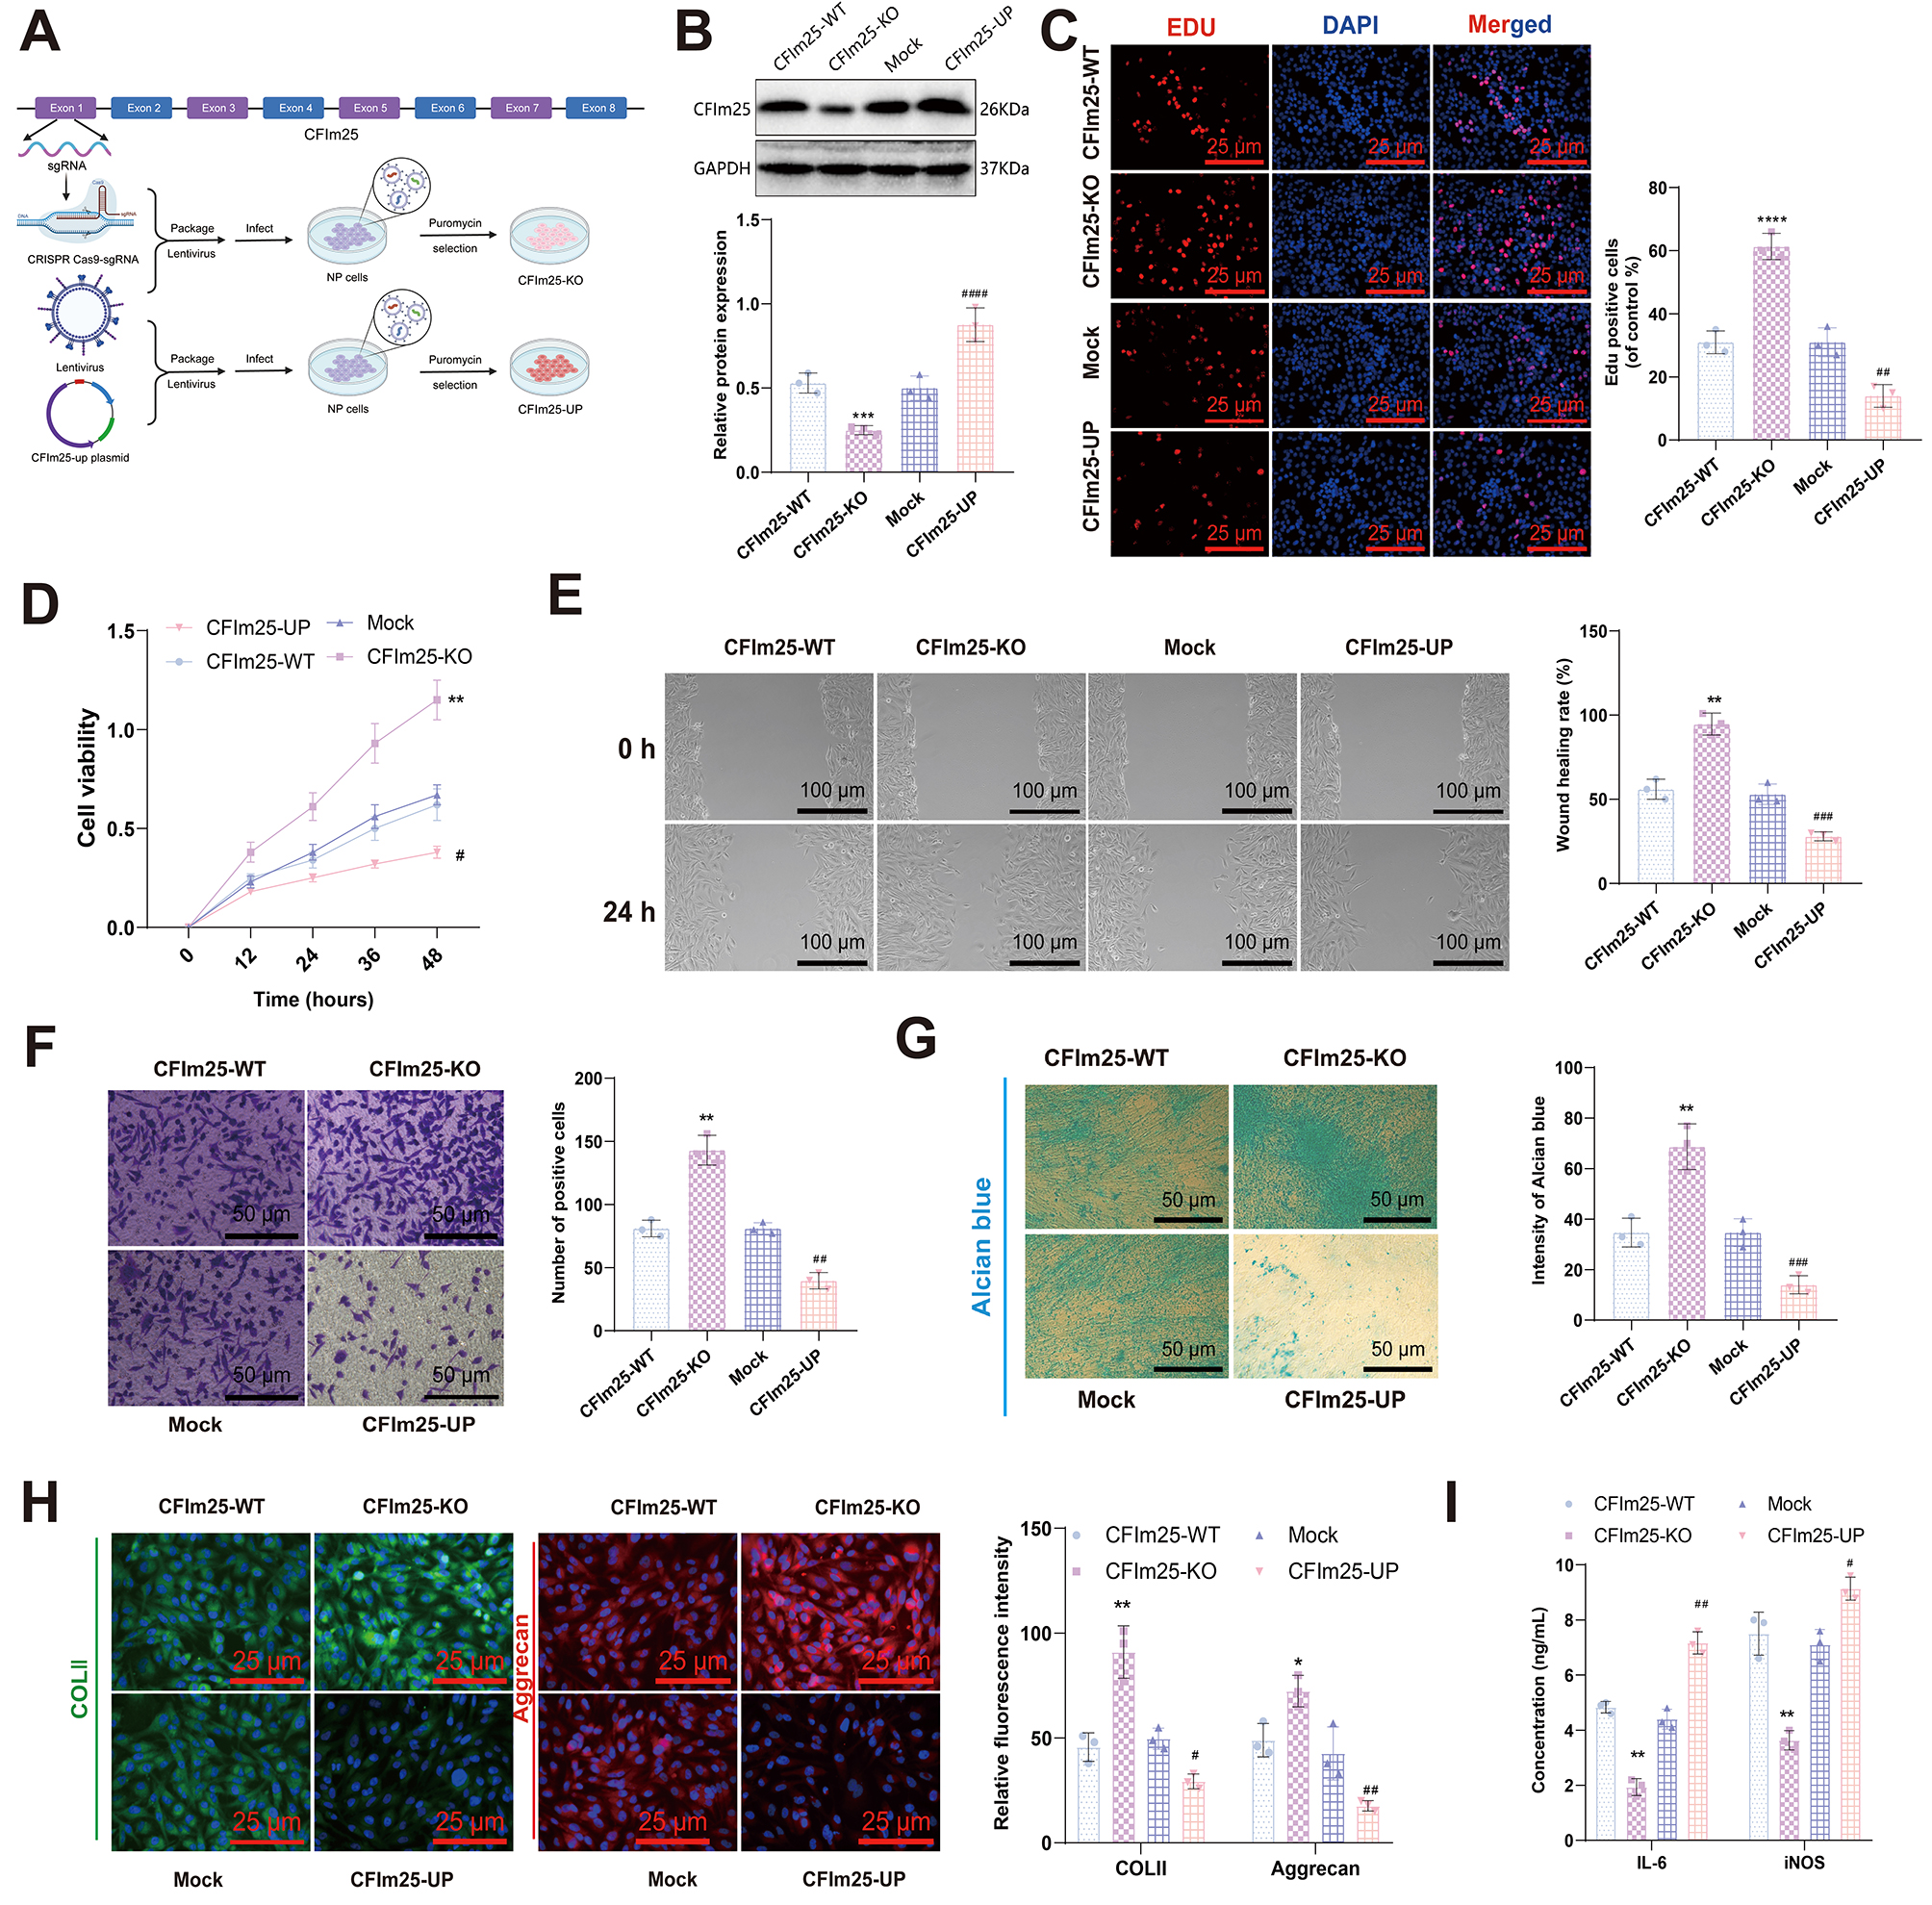
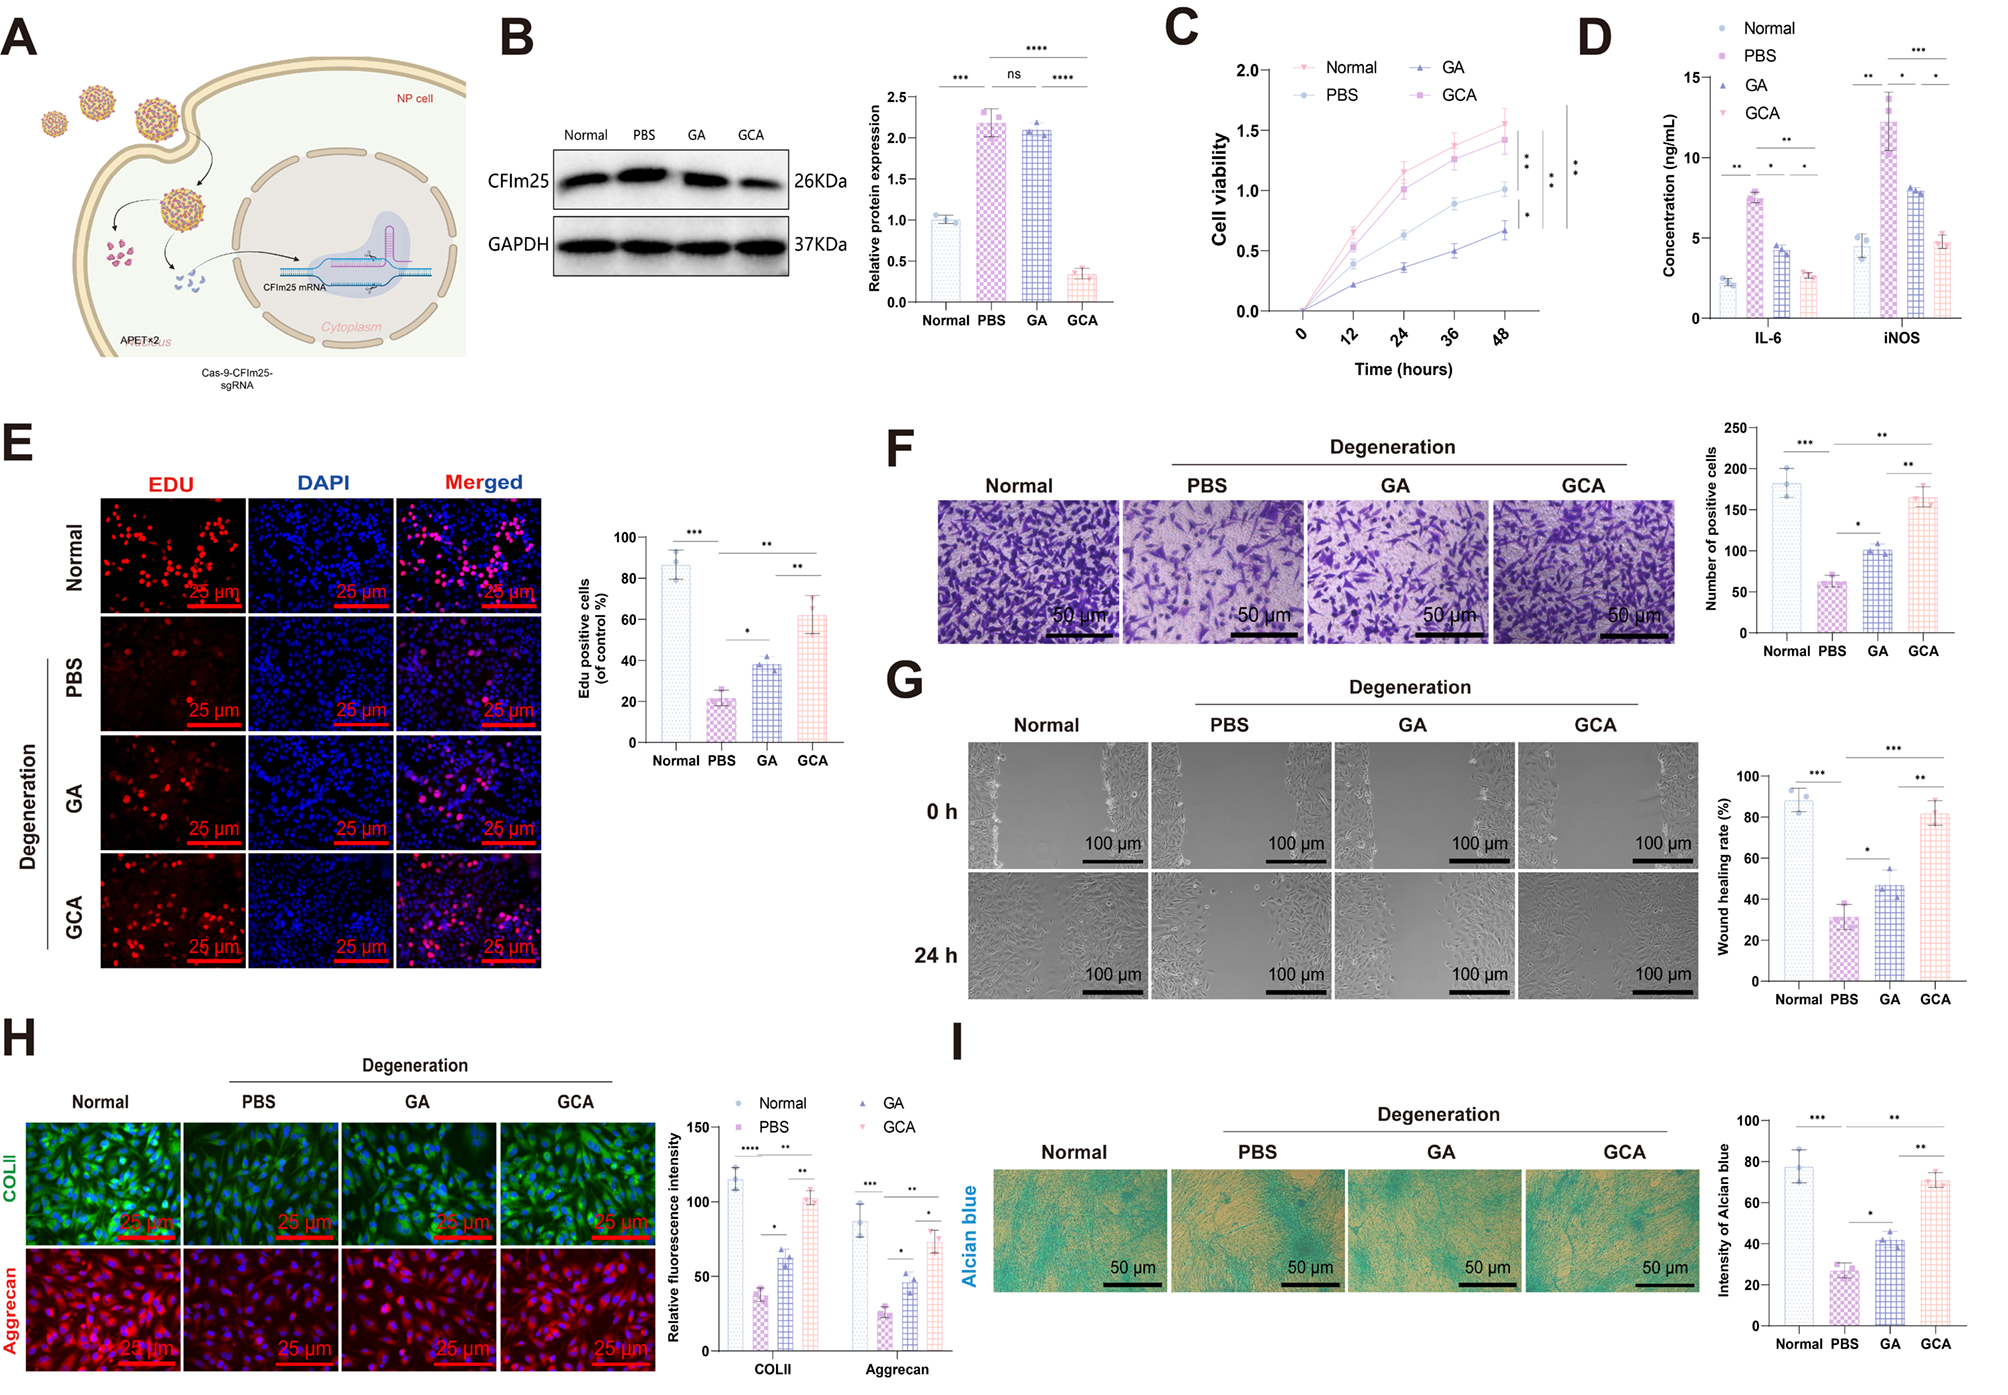
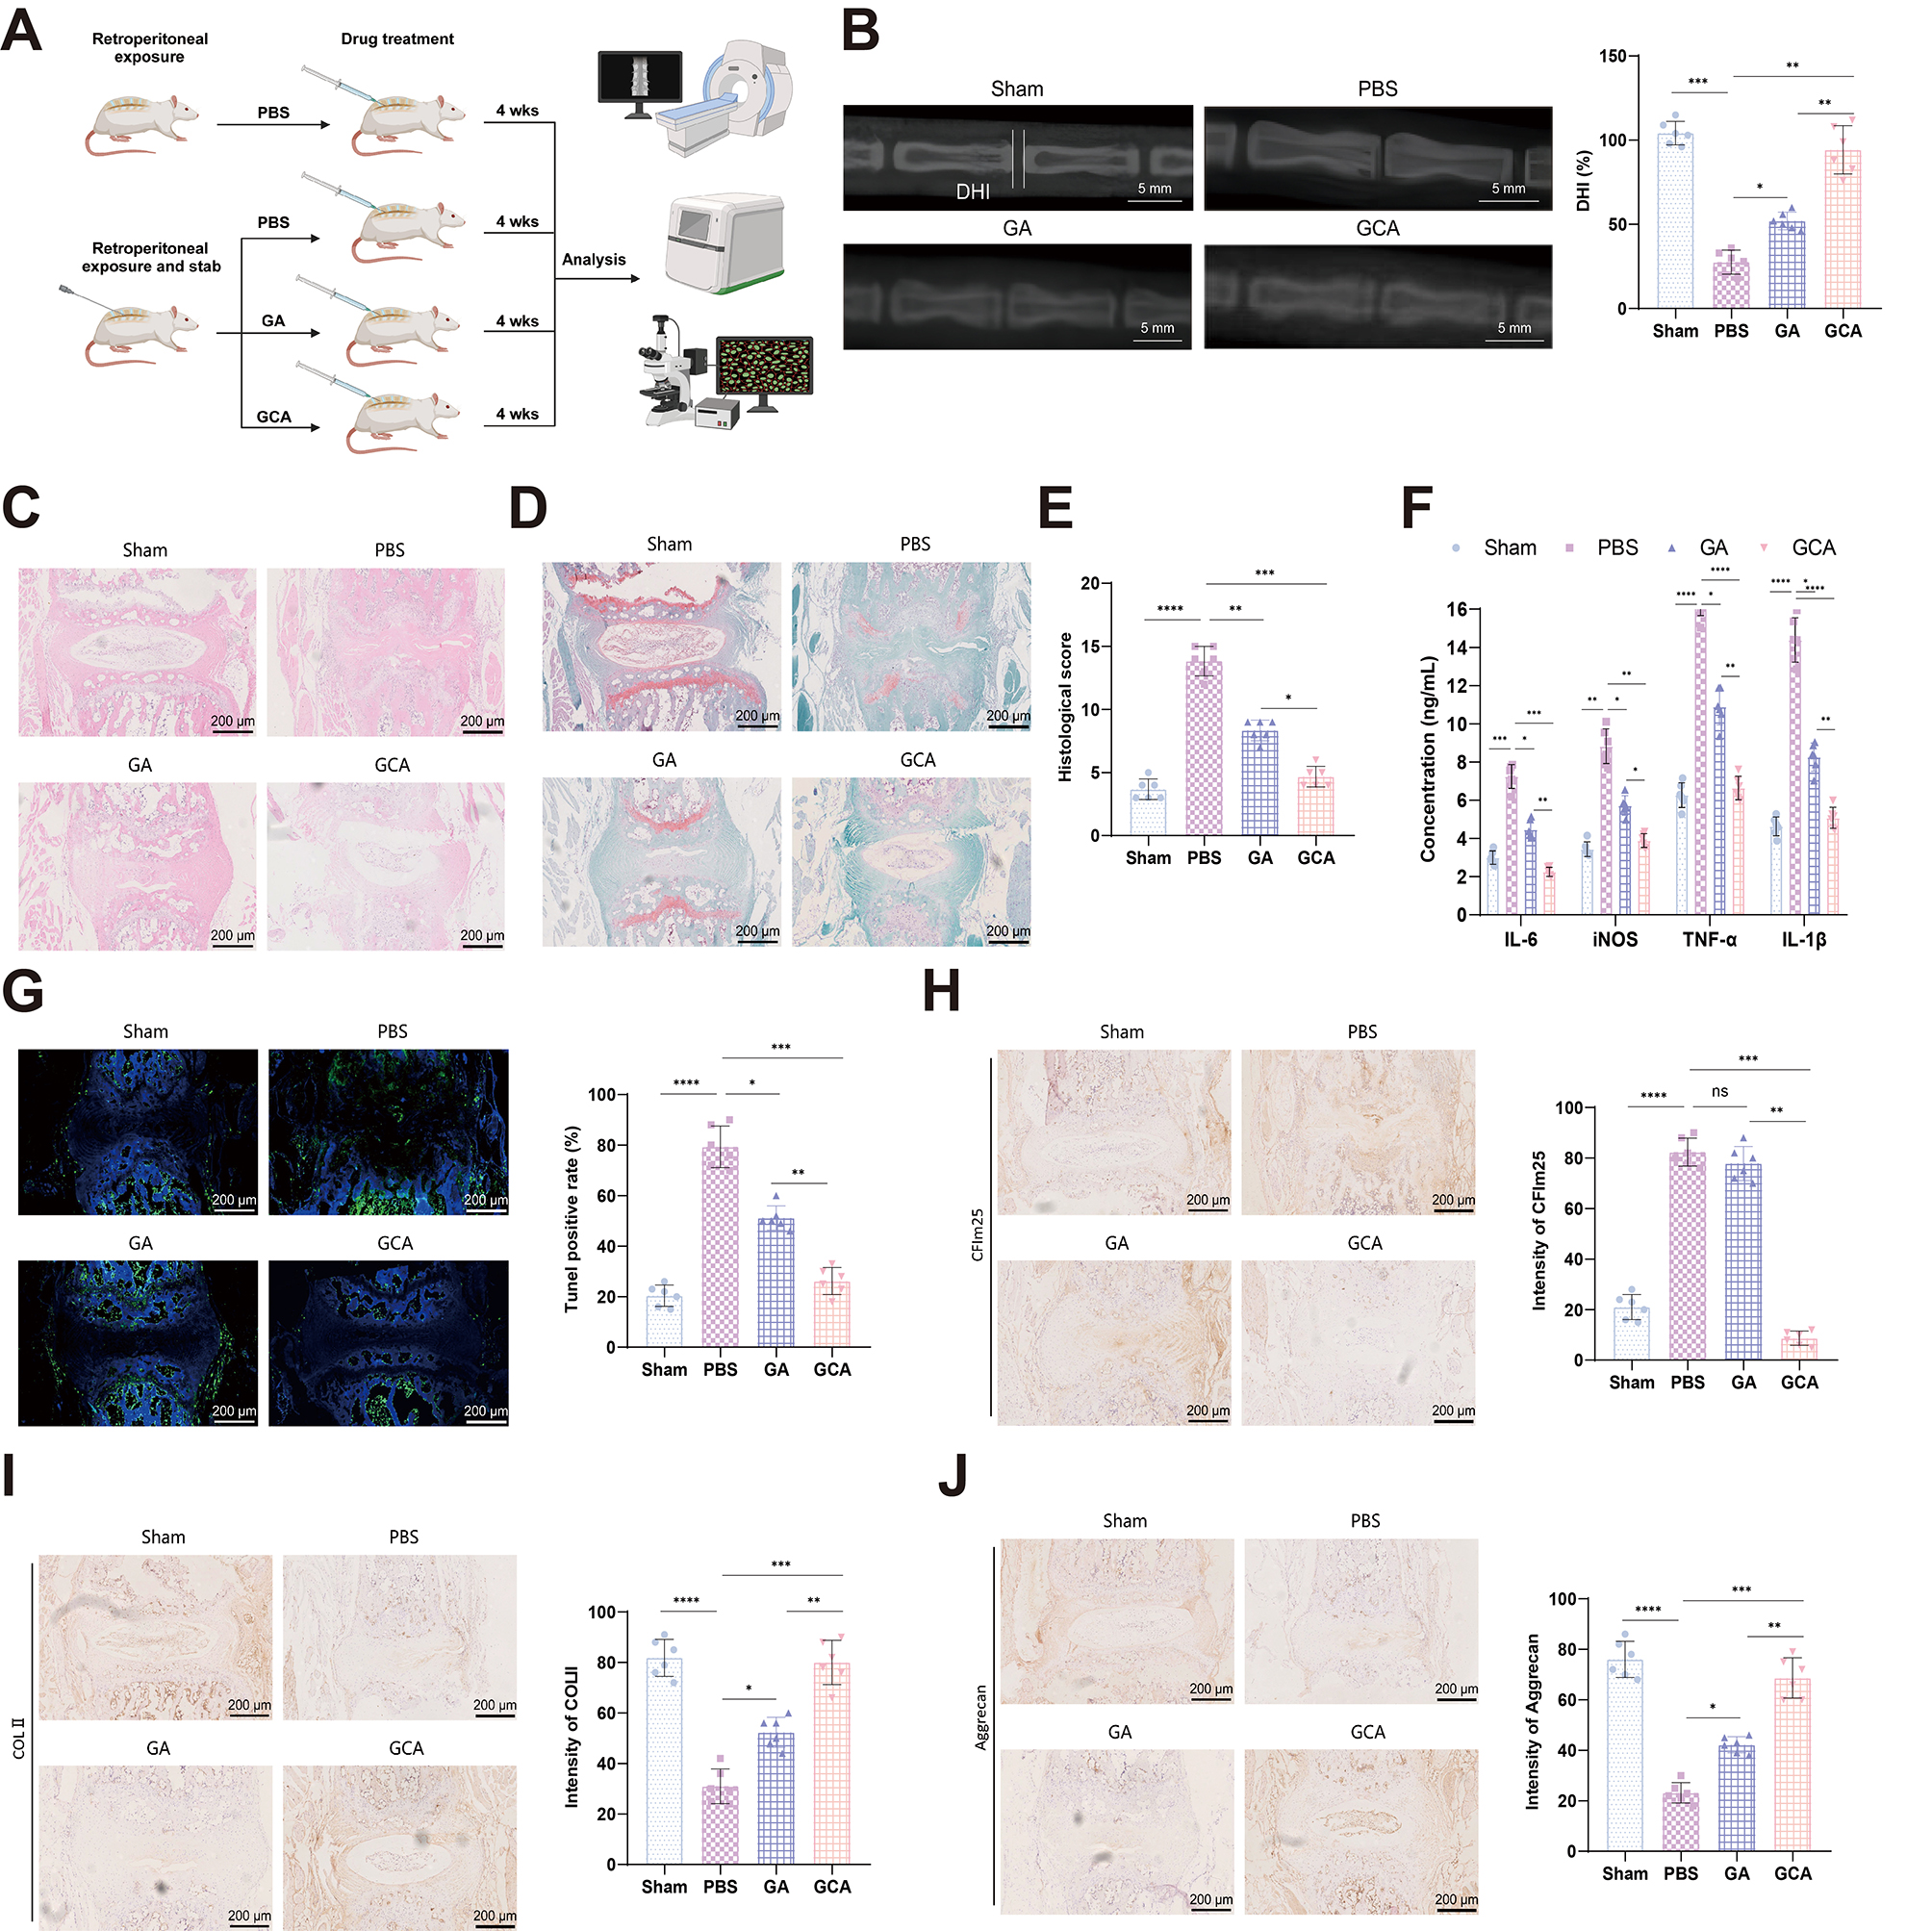
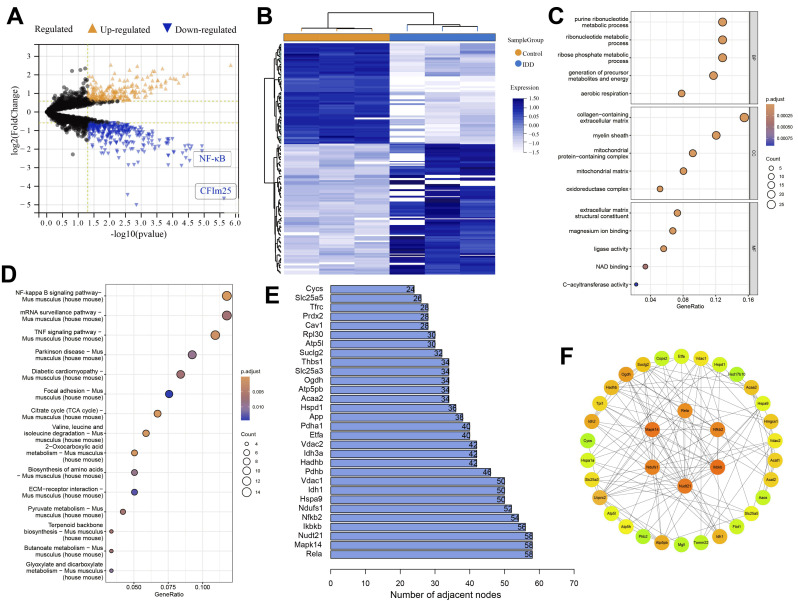
Methods: Single-cell transcriptomics and high-throughput transcriptomics were used to screen factors significantly correlated with intervertebral disc degeneration (IDD). Expression changes of CFIm25 were determined via RT-qPCR and Western blot. NP cells were isolated from mouse intervertebral discs and induced to degrade with TNF-α and IL-1β. CFIm25 was knocked out using CRISPR-Cas9, and CFIm25 knockout and overexpressing nucleus pulposus (NP) cell lines were generated through lentiviral transfection. Proteoglycan expression, protein expression, inflammatory factor expression, cell viability, proliferation, migration, gene expression, and protein expression were analyzed using various assays (alcian blue staining, immunofluorescence, ELISA, CCK-8, EDU labeling, transwell migration, scratch assay, RT-qPCR, Western blot). The GelMA-HAMA hydrogel loaded with APET×2 polypeptide and sgRNA was designed, and its effects on NP regeneration were assessed through in vitro and mouse model experiments. The progression of IDD in mice was evaluated using X-ray, H&E staining, and Safranin O-Fast Green staining. Immunohistochemistry was performed to determine protein expression in NP tissue. Proteomic analysis combined with in vitro and in vivo experiments was conducted to elucidate the mechanisms of hydrogel action.

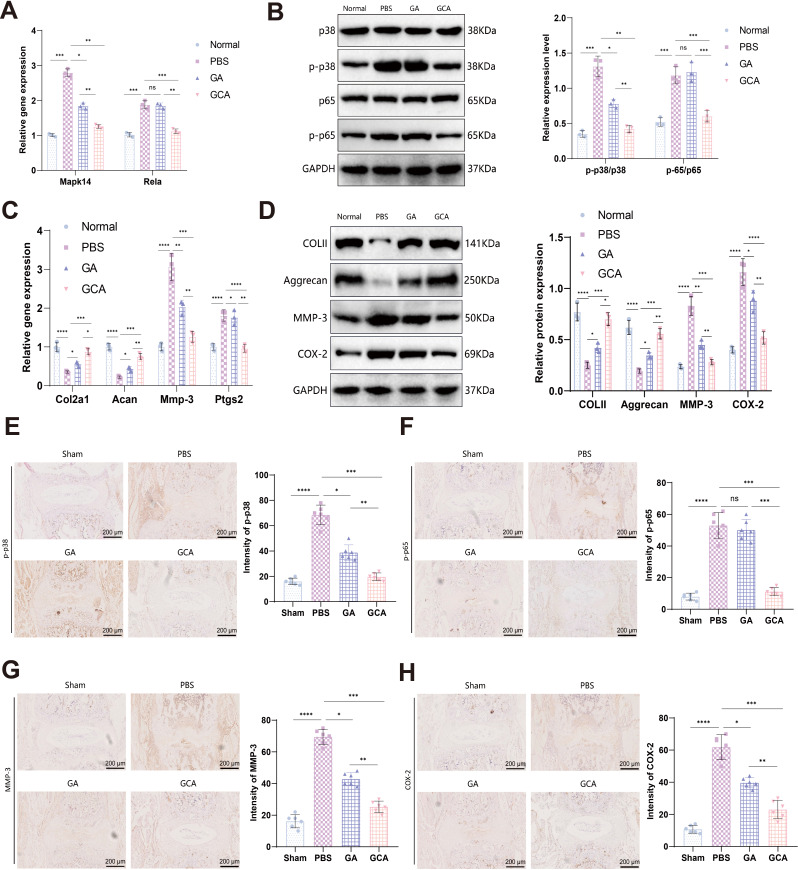
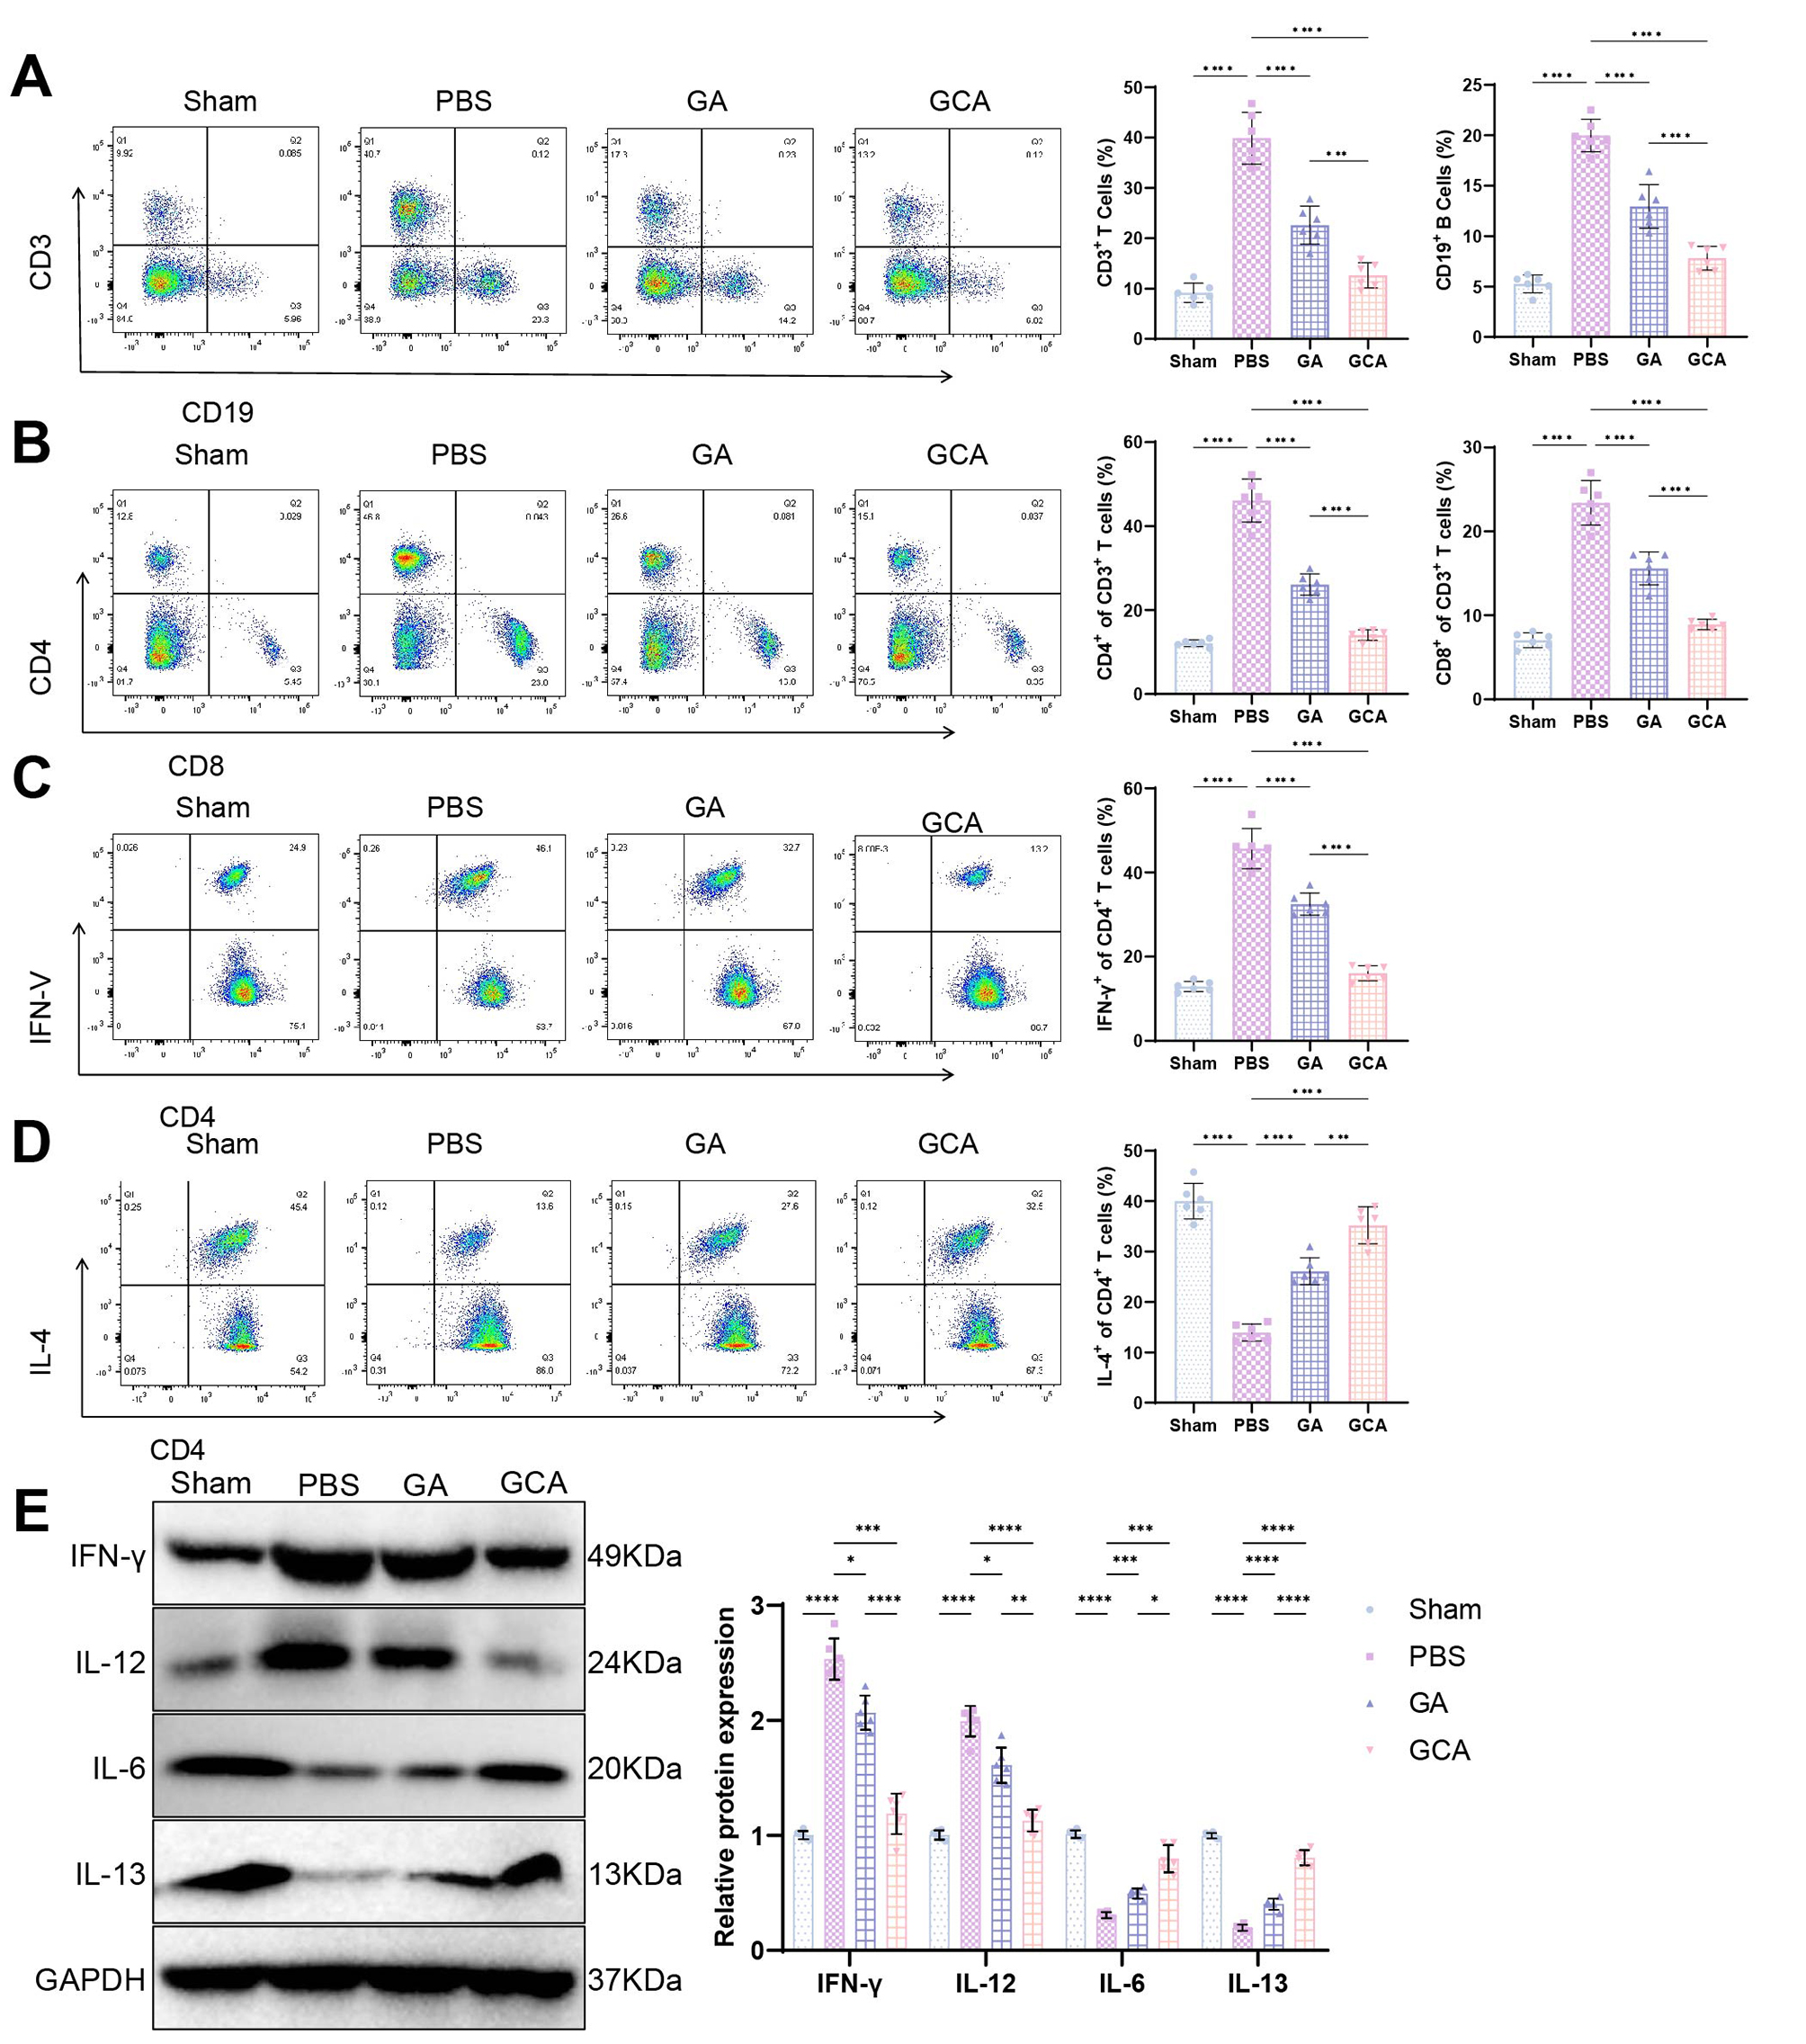
Results: CFIm25 was upregulated in IDD NP tissue and significantly correlated with disease progression. Inhibition of CFIm25 improved NP cell degeneration, enhanced cell proliferation, and migration. The hydrogel effectively knocked down CFIm25 expression, improved NP cell degeneration, promoted cell proliferation and migration, and mitigated IDD progression in a mouse model. The hydrogel inhibited inflammatory factor expression (IL-6, iNOS, IL-1β, TNF-α) by targeting the p38/NF-κB signaling pathway, increased collagen COLII and proteoglycan Aggrecan expression, and suppressed NP degeneration-related factors (COX-2, MMP-3).

Conclusion: The study highlighted the crucial role of CFIm25 in IDD and introduced a promising therapeutic strategy using a porous spherical GelMA-HAMA hydrogel loaded with APET×2 polypeptide and sgRNA. This innovative approach offers new possibilities for treating degenerated intervertebral discs.

Keywords: APET×2 polypeptide; CRISPR-Cas9 protein; Cleavage and polyadenylation specificity factor subunit 5; GelMA-HAMA hydrogel; Immune microenvironment; Intervertebral disc degeneration; Nucleus pulposus regeneration.


Conflict of interest statement

The authors declare no competing interests.

Figures

None
Molecular mechanism of GCA targeting CFIm25 in NP cells to promote regeneration of degenerated intervertebral disc NP
Fig. 1
Fig. 1
Cell clustering of scRNA-seq data. Note (A) Distribution of cells after batch correction in PC_1 and PC_2. Each point represents a cell; (B) UMAP visualization of cell clustering, displaying the clustering and distribution of cells from the Sham group, IDD postoperative 2 weeks, 4 weeks, and 8 weeks samples. Late Sham samples are depicted in purple, IDD postoperative 2 weeks samples in red, IDD postoperative 4 weeks samples in green, and IDD postoperative 8 weeks samples in cyan; (C) UMAP visualization of cell clustering, providing an overall representation of the clustering and distribution of cells from different sources, with each color representing a cluster; (D) Visualization of cell clustering and distribution based on different source samples, with each color representing a cluster; (E) UMAP visualization of cell annotation results based on cell clustering, with each color representing a cell subtype; (F) Expression levels of 6 cell marker genes in different cell subtypes, with darker green indicating higher average expression levels
Fig. 2
Fig. 2
Identification of cell-cell interactions in IDD NP tissue cells. Note (A) Bar plot showing the overall cell composition proportions in the Sham group and IDD postoperative 2, 4, and 8 weeks samples, with cell types color-coded as IC (immune cells), Mac (macrophages), SC (stromal cells), and EC (endothelial cells); (B) Circos plot displaying the number of cell communications in the Sham group and IDD postoperative 2, 4, and 8 weeks groups, with the thickness of the lines indicating the number of pathways; (C) Circos plot showing the number of cell communications between chondrocytes and other cells in the Sham group and IDD postoperative 2, 4, and 8 weeks groups, with the thickness of the lines indicating the number of pathways; (D) Display of ligand-receptor pairs significantly associated with chondrocytes in the Sham group and IDD postoperative 2, 4, and 8 weeks groups
Fig. 3
Fig. 3
Identification of key genes mediating IDD through scRNA-seq and transcriptome sequencing analysis. Note (A) Volcano plot showing the differentially expressed genes between normal IVD NP tissue from three groups of mice and degenerative IVD NP tissue from three groups of mice. Yellow upward triangles represent upregulated genes, green downward triangles represent downregulated genes, and black dots represent non-differentially expressed genes; (B) Venn diagram showing the intersection between RNA-seq differentially expressed genes and scRNA-seq differentially expressed genes; (C) Statistics of interaction sites in the PPI network of proteins encoded by the 122 intersecting genes, shown graphically; (D) PPI interaction network diagram of the proteins encoded by the 122 intersecting genes (combined score = 0.7), with color gradient indicating the degree value of the genes from small to large; (E) Bubble plot showing the GO enrichment analysis of the 122 intersecting genes, with circle color representing the significance of enrichment and circle size representing the number of enriched genes; (F) Bubble plot showing the KEGG enrichment analysis of the 122 intersecting genes, with circle color representing the significance of enrichment and circle size representing the number of enriched genes; (G) LASSO algorithm selected 5 feature genes; (H) SVM-RFE algorithm selected 3 feature genes; (I) Venn diagram showing the intersection of the two machine learning results, resulting in 1 gene; (J) scRNA-seq detection of Nudt21 gene expression; (K) RT-qPCR detection of Nudt21 mRNA expression in mouse IVD NP tissue (n = 3); (L) Western blot detection of CFIm25 protein expression in mouse IVD NP tissue (n = 6). Quantitative data in the figures are represented as Mean ± SD, with *p < 0.05, **p < 0.01, ***p < 0.001, and ****p < 0.0001, indicating statistical significance compared to the Sham group
Fig. 4
Fig. 4
Knockdown of the Nudt21 gene suppresses NP cell degeneration Note (A) Flowchart illustrating the knockdown or overexpression of CFIm25; (B) Western blot analysis of CFIm25 protein expression in degenerated NP cells under different interventions; (C) EDU assay to evaluate the proliferative capacity of degenerated NP cells in different intervention groups (scale bar = 25 μm); (D) CCK-8 assay to measure the viability of degenerated NP cells under different interventions at 12, 24, 36, and 48 h; (E) Cell scratch experiment examining the migration ability of degenerated NP cells in different intervention groups (scale bar = 100 μm); (F) Transwell migration assay investigating the migration ability of degenerated NP cells in different intervention groups (scale bar = 50 μm); (G) Alcian blue staining to detect the expression change of proteoglycan in degenerated NP cells under different interventions (scale bar = 50 μm); (H) Immunofluorescence staining to analyze the expression of COLII and Aggrecan proteins in degenerated NP cells in different intervention groups (scale bar = 25 μm); (I) ELISA assay to measure the expression of inflammatory factors IL-6 and iNOS in degenerated NP cells under different interventions. The quantified data in the figures are presented as Mean ± SD, and each experiment was repeated three times. * indicates comparison with the CFIm25-WT group, the significance levels were as follows: *p < 0.05, **p < 0.01, ***p < 0.001, and ****p < 0.0001. Similarly, compared to the Mock group, the significance levels were: #p < 0.05, ##p < 0.01, ###p < 0.001, and ####p < 0.0001
Fig. 5
Fig. 5
GCA significantly inhibits NP cell degeneration. Note (A) Schematic representation of GCA’s action inside the cell; (B) Western blot analysis of CFIm25 protein expression; (C) CCK-8 assay to measure the viability of NP cells under different interventions at 12, 24, 36, and 48 h; (D) ELISA assay to measure the expression of inflammatory factors IL-6 and iNOS in NP cells; (E) EDU assay to evaluate the proliferative capacity of NP cells (scale bar = 25 μm); (F) Transwell migration experiment investigating the migration ability of NP cells (scale bar = 50 μm); (G) Cell scratch experiment examining the migration ability of NP cells (scale bar = 100 μm); (H) Immunofluorescence staining to analyze the expression of COLII and Aggrecan proteins in NP cells (scale bar = 25 μm); (I) Alcian blue staining to detect the expression change of proteoglycan in NP cells (scale bar = 50 μm). The quantitative data in the figure are expressed as Mean ± SD. * indicates comparison between the two groups, *p < 0.05, *p < 0.01, **p < 0.001, ***p < 0.0001, and each experiment was repeated 3 times per group
Fig. 6
Fig. 6
GCA effectively improves IDD in mice. Note (A) Schematic diagram of the process for treating IDD in mice with GCA (n = 6); (B) Representative X-ray images of IVD in mice from different treatment groups (scale bar = 5 mm); (C) H&E staining of IVD in mice from different treatment groups (scale bar = 200 μm); (D) Safranin O-Fast Green staining of IVD in mice from different treatment groups, with green representing bone tissue and red representing cartilage tissue (scale bar = 200 μm); (E) Histological scoring of intervertebral disc tissue in mice; (F) Expression of inflammatory factors IL-6, iNOS, TNF-α, and IL-1β in mouse serum detected by ELISA; (G) TUNEL staining to detect cell apoptosis in the NP tissue of mice (scale bar = 200 μm); (H) Immunohistochemical staining showing the expression of CFIm25 protein in intervertebral disc NP tissue of mice (scale bar = 200 μm); (I) Immunohistochemical staining showing the expression of COLII protein in intervertebral disc NP tissue of mice (scale bar = 200 μm); (J) Immunohistochemical staining showing the expression of Aggrecan protein in intervertebral disc NP tissue of mice (scale bar = 200 μm). The quantitative data in the figure are expressed as Mean ± SD, with 6 mice in each group. * indicates comparison between the two groups, *p < 0.05, **p < 0.01, ***p < 0.001, ****p < 0.0001
Fig. 7
Fig. 7
Proteomic sequencing analysis of critical signaling pathways mediating IDD. Note (A) Volcano plot showing differentially expressed genes in the IVD NP tissue of mice from the PBS treatment group (3 groups) and the GCA treatment group (3 groups). The yellow triangle represents upregulated genes, blue triangle represents downregulated genes, and black dots represent non-differentially expressed genes; (B) Heatmap of 194 DEPs, with white representing downregulation and blue representing upregulation; (C) Bubble plot of GO enrichment analysis for the 194 DEPs, with the color and size of circles representing the significance and number of enriched genes, respectively; (D) Bubble plot of KEGG enrichment analysis for the 194 DEPs, with the color and size of circles representing the significance and number of enriched genes, respectively; (E) Statistical analysis of PPI network interaction sites for the 194 DEPs, with a corresponding diagram; (F) PPI network graph of the 194 DEPs (Combined score = 0.7), with the color gradient from yellow to orange indicating the degree of the genes from small to large
Fig. 8
Fig. 8
GCA improves IDD through the p38/NF-κB signaling pathway. Note (A) RT-qPCR analysis of Mapk14 and Rela gene expression in NP cells from different treatment groups; (B) Western blot analysis of p38, p-p38, p65, and p-p65 protein expression in NP cells from different treatment groups; (C) RT-qPCR analysis of Col2a1, Acan, Mmp-3, and Ptgs2 gene expression in NP cells from different treatment groups; (D) Western blot analysis of COLII, Aggrecan, MMP-3, and COX-2 protein expression in NP cells from different treatment groups; (E) Immunohistochemistry staining showing the expression of p-p38 protein in mouse intervertebral disc NP tissue (scale bar in the legend = 200 μm); (F) Immunohistochemistry staining showing the expression of p-p65 protein in mouse intervertebral disc NP tissue (scale bar in the legend = 200 μm); (G) Immunohistochemistry staining showing the expression of MMP-3 protein in mouse intervertebral disc NP tissue (scale bar in the legend = 200 μm); (H) Immunohistochemistry staining showing the expression of COX-2 protein in mouse intervertebral disc NP tissue (scale bar in the legend = 200 μm). The quantitative data shown in the figure are presented as Mean ± SD, with cell experiments repeated 3 times per group and animal experiments conducted with 6 mice per group. * indicates comparison between the two groups, with significance levels as follows: *p < 0.05, **p < 0.01, ***p < 0.001, ****p < 0.0001
Fig. 9
Fig. 9
GCA regulation improves immune microenvironment in IDD. Note (A) Changes in the number of T cells and B cells in the NP tissue of mice in different treatment groups; (B) Changes in the number of CD4+ T cells and CD8+ T cells in the NP tissue of mice in different treatment groups; (C) Changes in the number of Th1 cells in the NP tissue of mice in different treatment groups; (D) Changes in the number of Th2 cells in the NP tissue of mice in different treatment groups; (E) Expression changes of cell factors IFN-γ, IL-12, IL-6, and IL-13 in NP tissue of mice in different treatment groups detected by Western blot. Quantitative data shown in the figure are presented as Mean ± SD, with 6 mice included in each animal experiment. * indicates comparison between the two groups, with significance levels as follows: *p < 0.05, **p < 0.01, ***p < 0.001, ****p < 0.0001

Similar articles

Cited by

References

    1. Fine N, Lively S, Séguin CA, Perruccio AV, Kapoor M, Rampersaud R. Intervertebral disc degeneration and osteoarthritis: a common molecular disease spectrum. Nat Rev Rheumatol. 2023;19(3):136–52. 10.1038/s41584-022-00888-z. 10.1038/s41584-022-00888-z - DOI - PubMed
    1. Zhang GZ, Liu MQ, Chen HW, et al. NF-κB signalling pathways in nucleus pulposus cell function and intervertebral disc degeneration. Cell Prolif. 2021;54(7):e13057. 10.1111/cpr.13057. 10.1111/cpr.13057 - DOI - PMC - PubMed
    1. Wang Y, Cheng H, Wang T, Zhang K, Zhang Y, Kang X. Oxidative stress in intervertebral disc degeneration: molecular mechanisms, pathogenesis and treatment. Cell Prolif. 2023;56(9):e13448. 10.1111/cpr.13448. 10.1111/cpr.13448 - DOI - PMC - PubMed
    1. Yabe Y, Hagiwara Y, Tsuchiya M, et al. Factors Associated with Thickening of the Ligamentum Flavum on Magnetic Resonance Imaging in patients with lumbar spinal canal stenosis. Spine (Phila Pa 1976). 2022;47(14):1036–41. 10.1097/BRS.0000000000004341. 10.1097/BRS.0000000000004341 - DOI - PubMed
    1. Yang XX, Yip CH, Zhao S, Ho YP, Chan BP. A bio-inspired nano-material recapitulating the composition, ultra-structure, and function of the glycosaminoglycan-rich extracellular matrix of nucleus pulposus. Biomaterials. 2023;293:121991. 10.1016/j.biomaterials.2022.121991. 10.1016/j.biomaterials.2022.121991 - DOI - PubMed

LinkOut - more resources