Observational Study
. 2024 Sep 12;16(1):202.
doi: 10.1186/s13195-024-01564-y.

Impact of amyloid and cardiometabolic risk factors on prognostic capacity of plasma neurofilament light chain for neurodegeneration

Collaborators, Affiliations
Observational Study

Impact of amyloid and cardiometabolic risk factors on prognostic capacity of plasma neurofilament light chain for neurodegeneration

Keun You Kim et al. Alzheimers Res Ther. .

Abstract

Background: Plasma neurofilament light chain (NfL) is a blood biomarker of neurodegeneration, including Alzheimer's disease. However, its usefulness may be influenced by common conditions in older adults, including amyloid-β (Aβ) deposition and cardiometabolic risk factors like hypertension, diabetes mellitus (DM), impaired kidney function, and obesity. This longitudinal observational study using the Alzheimer's Disease Neuroimaging Initiative cohort investigated how these conditions influence the prognostic capacity of plasma NfL.

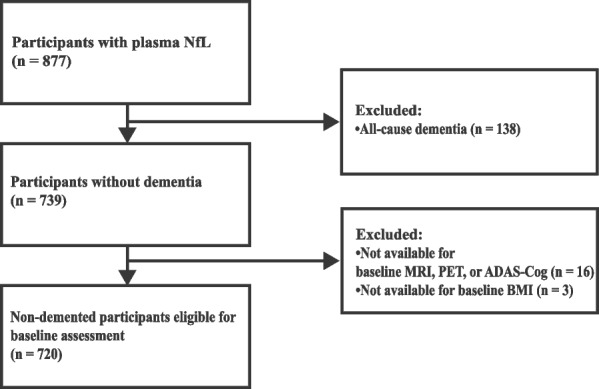
Methods: Non-demented participants (cognitively unimpaired or mild cognitive impairment) underwent repeated assessments including the Alzheimer's Disease Assessment Scale-Cognitive subscale (ADAS-Cog) scores, hippocampal volumes, and white matter hyperintensity (WMH) volumes at 6- or 12-month intervals. Linear mixed-effect models were employed to examine the interaction between plasma NfL and various variables of interest, such as Aβ (evaluated using Florbetapir positron emission tomography), hypertension, DM, impaired kidney function, or obesity.

Results: Over a mean follow-up period of 62.5 months, participants with a mean age of 72.1 years (n = 720, 48.8% female) at baseline were observed. Higher plasma NfL levels at baseline were associated with steeper increases in ADAS-Cog scores and WMH volumes, and steeper decreases in hippocampal volumes over time (all p-values < 0.001). Notably, Aβ at baseline significantly enhanced the association between plasma NfL and longitudinal changes in ADAS-Cog scores (p-value 0.005) and hippocampal volumes (p-value 0.004). Regarding ADAS-Cog score and WMH volume, the impact of Aβ was more prominent in cognitively unimpaired than in mild cognitive impairment. Hypertension significantly heightened the association between plasma NfL and longitudinal changes in ADAS-Cog scores, hippocampal volumes, and WMH volumes (all p-values < 0.001). DM influenced the association between plasma NfL and changes in ADAS-Cog scores (p-value < 0.001) without affecting hippocampal and WMH volumes. Impaired kidney function did not significantly alter the association between plasma NfL and longitudinal changes in any outcome variables. Obesity heightened the association between plasma NfL and changes in hippocampal volumes only (p-value 0.026).

Conclusion: This study suggests that the prognostic capacity of plasma NfL may be amplified in individuals with Aβ or hypertension. This finding emphasizes the importance of considering these factors in the NfL-based prognostic model for neurodegeneration in non-demented older adults.

Keywords: Alzheimer’s disease; Blood-based biomarker; Cardiovascular disease; Dementia; Kidney disease; Metabolic syndrome; Neurofilament light chain; Prognosis.


Conflict of interest statement

The authors declare no competing interests.

Figures

Fig. 1
Fig. 1
Selection of the study population. Abbreviations: ADAS-Cog, Alzheimer’s Disease Assessment Scale-Cognitive subscale; MRI, magnetic resonance imaging; NfL, neurofilament light chain; PET, positron emission tomography
Fig. 2
Fig. 2
Associations between baseline NfL levels and longitudinal changes in ADAS-Cog scores, hippocampal volumes, and WMH volumes. Data show the associations between baseline plasma NfL and longitudinal changes in ADAS-Cog scores (left panel), hippocampal volumes (middle panel), and WMH volumes (right panel). Higher baseline plasma NfL levels were associated with steeper increases in ADAS-cog scores and WMH volumes, and steeper decreases in hippocampal volumes over time (all p-values < 0.001). Of outcome variables, ADAS-Cog score and WMH volume were square root transformed due to non-normal distribution. Continuous variables, including plasma NfL level and outcome variables, were standardized to z-scores. The plotted lines represent estimated z-scores of ADAS-Cog scores, hippocampal volumes, or WMH volumes over time under the condition of baseline plasma NfL at mean -1SD, mean, and mean + 1SD. P-values were calculated to identify the significance of the two-way interaction term including baseline NfL level and time. Models were adjusted for the following covariates: baseline age, sex, years of education, APOE ε4 allele count, ever smoking, alcohol abuse, SGDS, Aβ status, hypertension, DM, impaired kidney function, obesity, and baseline cognitive status (MCI or CU). Abbreviations: ADAS-Cog, Alzheimer’s Disease Assessment Scale-Cognitive subscale; APOE, apolipoprotein E; CU, cognitively unimpaired; DM, diabetes mellitus; MCI, mild cognitive impairment; NfL, neurofilament light chain; SD, standard deviation; SGDS, Short form of Geriatric Depression Scale; SUVR, standard uptake value ratio; WMH, white matter hyperintensity
Fig. 3
Fig. 3
Associations between baseline plasma NfL and longitudinal changes in ADAS-Cog scores, hippocampal volumes, or WMH volumes: stratified by the status of Aβ and cardiometabolic risk factors. Data show how the associations between plasma NfL and longitudinal changes in ADAS-Cog scores (left panel), hippocampal volumes (middle panel), and WMH volumes (right panel) were affected by the Aβ or cardiometabolic risk factors. A Aβ significantly moderated the association between plasma NfL and longitudinal ADAS-Cog scores (p-value 0.005) and hippocampal volumes (p-value 0.004), not WMH volumes (p-value 0.160). Specifically, while higher baseline plasma NfL levels were associated with faster increases in ADAS-Cog scores and decreases in hippocampal volumes, the magnitude of these changes in slopes was more pronounced in Aβ ( +) status compared to Aβ ( −) status. B Similarly, hypertension significantly moderated the association between plasma NfL and longitudinal changes in all outcome variables (all p-values < 0.001). C DM significantly affected the association between plasma NfL and longitudinal ADAS-Cog scores (p-value < 0.001) without affecting hippocampal and WMH volumes. D Impaired kidney function did not affect the association between plasma NfL and any outcome variables (all p-values > 0.05). E Obesity significantly moderated the association between plasma NfL and longitudinal hippocampal volumes (p-value 0.026) without affecting ADAS-Cog scores (p-value 0.112) and WMH volumes (p-value 0.058). Of outcome variables, ADAS-Cog score and WMH volume were square root transformed due to non-normal distribution. Continuous variables, including plasma NfL level and outcome variables, were standardized to z-scores. The plotted lines represent estimated z-scores of ADAS-Cog scores, hippocampal volumes, or WMH volumes over time under the condition of baseline plasma NfL at mean -1SD, mean, and mean + 1SD. Interaction p-values were calculated to identify the significance of the three-way interaction term including baseline NfL, time, and the variable of interest (Aβ, hypertension, DM, impaired kidney function, or obesity). Abbreviations: Aβ, amyloid-β; ADAS-Cog, Alzheimer’s Disease Assessment Scale-Cognitive subscale; DM, diabetes mellitus; NfL, neurofilament light chain; SD, standard deviation; WMH, white matter hyperintensity

References

    1. Teunissen CE, Verberk IMW, Thijssen EH, Vermunt L, Hansson O, Zetterberg H, et al. Blood-based biomarkers for Alzheimer’s disease: towards clinical implementation. Lancet Neurol. 2022;21(1):66–77. 10.1016/S1474-4422(21)00361-6 - DOI - PubMed
    1. Khalil M, Teunissen CE, Lehmann S, Otto M, Piehl F, Ziemssen T, et al. Neurofilaments as biomarkers in neurological disorders — towards clinical application. Nat Rev Neurol. 2024. 10.1038/s41582-024-00955-x. 10.1038/s41582-024-00955-x - DOI - PubMed
    1. Mattsson N, Andreasson U, Zetterberg H, Blennow K, Alzheimers Disease Neuroimaging Initiative. Association of plasma neurofilament light with neurodegeneration in patients with Alzheimer disease. JAMA Neurol. 2017;74(5):557–66. 10.1001/jamaneurol.2016.6117 - DOI - PMC - PubMed
    1. Mazzeo S, Ingannato A, Giacomucci G, Manganelli A, Moschini V, Balestrini J, et al. Plasma neurofilament light chain predicts Alzheimer’s disease in patients with subjective cognitive decline and mild cognitive impairment: a cross-sectional and longitudinal study. Eur J Neurol. 2023. 10.1111/ene.16089. 10.1111/ene.16089 - DOI - PMC - PubMed
    1. Planche V, Bouteloup V, Pellegrin I, Mangin JF, Dubois B, Ousset PJ, et al. Validity and performance of blood biomarkers for Alzheimer disease to predict dementia risk in a large clinic-based cohort. Neurology. 2023;100(5):e473–84. 10.1212/WNL.0000000000201479 - DOI - PMC - PubMed

Publication types