

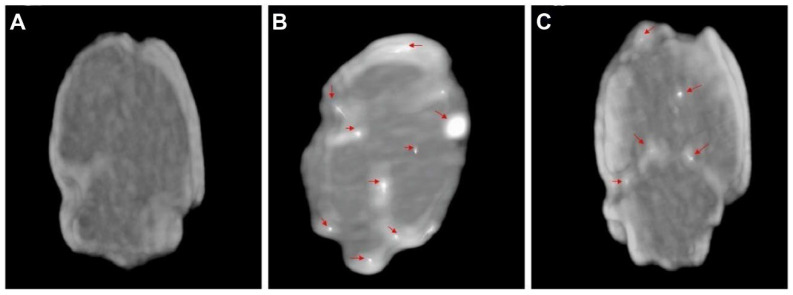
Intranasal delivery of imaging agents to the brain
- PMID: 39267777
- PMCID: PMC11388076
- DOI: 10.7150/thno.98473
Intranasal delivery of imaging agents to the brain
Abstract
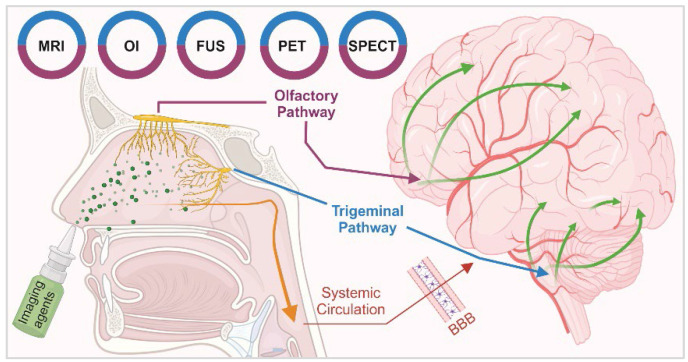
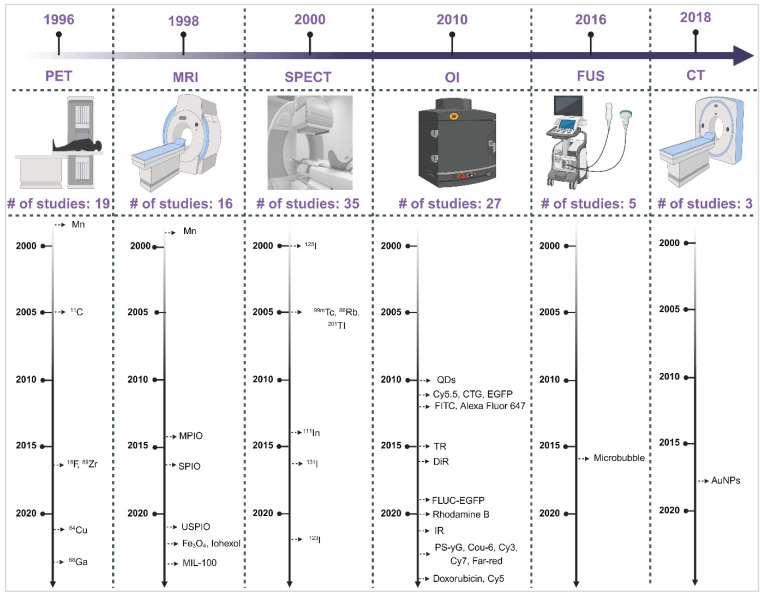
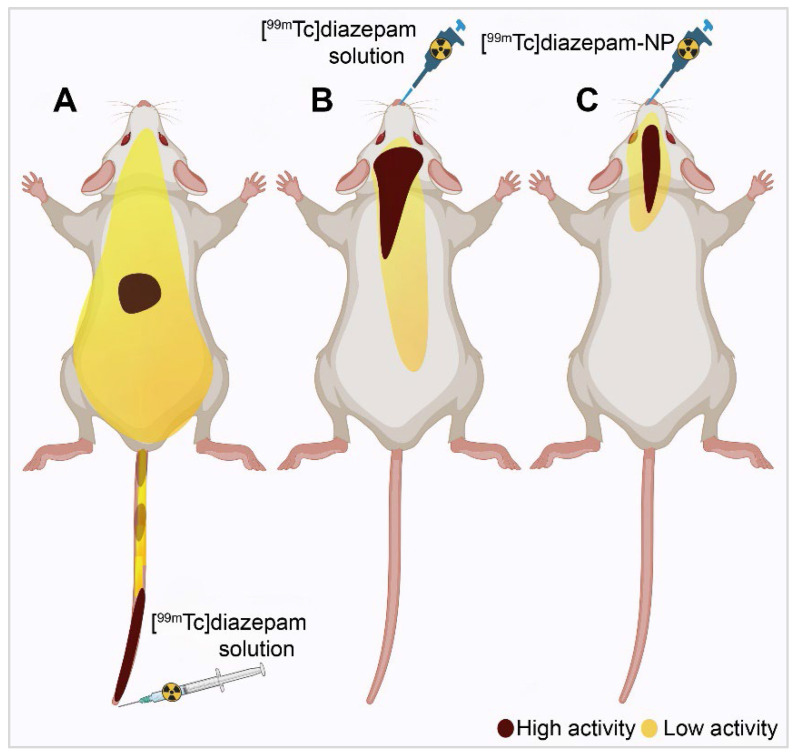
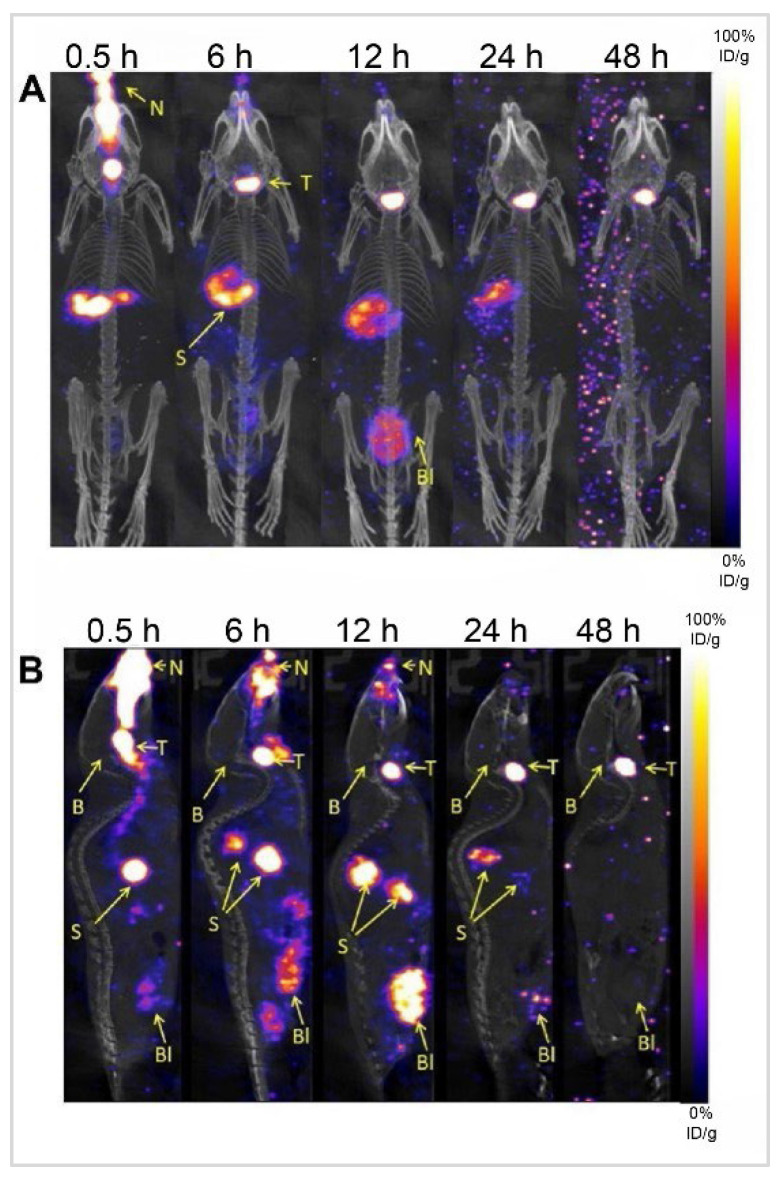
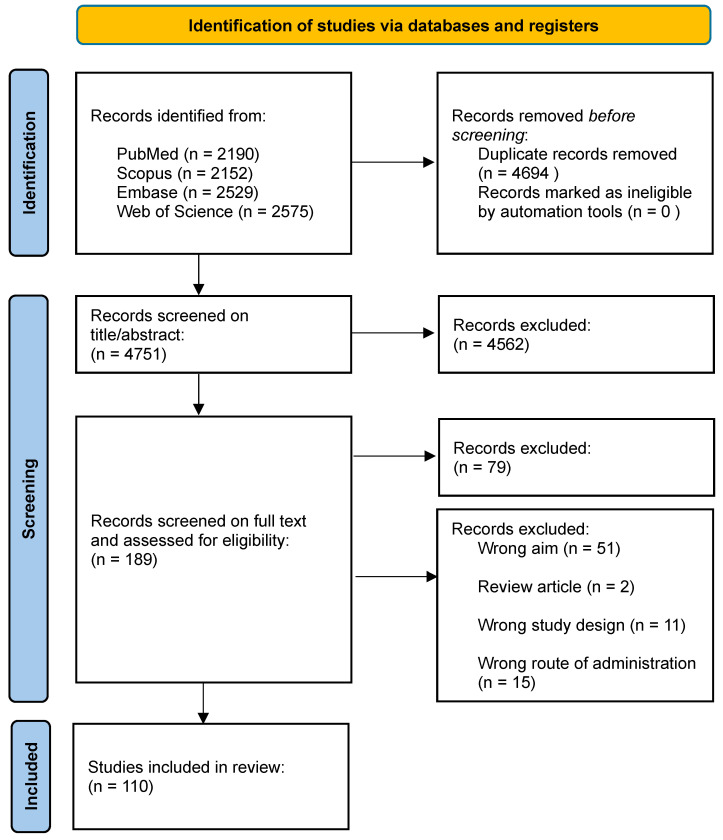
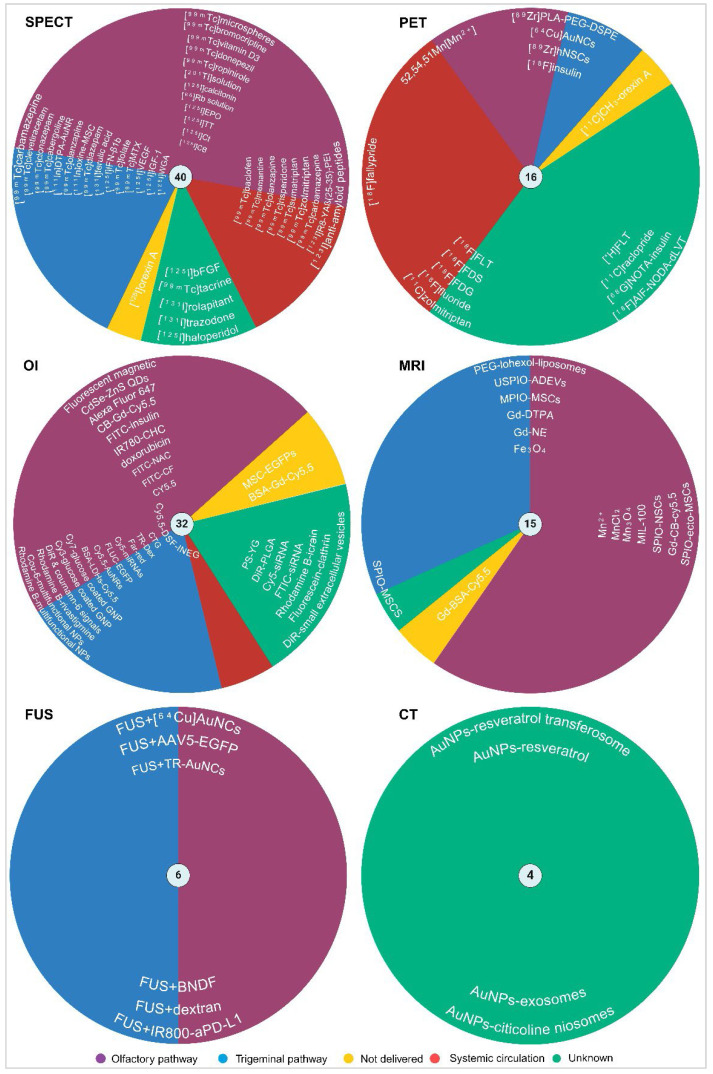
The potential of intranasal administered imaging agents to altogether bypass the blood-brain barrier offers a promising non-invasive approach for delivery directly to the brain. This review provides a comprehensive analysis of the advancements and challenges of delivering neuroimaging agents to the brain by way of the intranasal route, focusing on the various imaging modalities and their applications in central nervous system diagnostics and therapeutics. The various imaging modalities provide distinct insights into the pharmacokinetics, biodistribution, and specific interactions of imaging agents within the brain, facilitated by the use of tailored tracers and contrast agents. Methods: A comprehensive literature search spanned PubMed, Scopus, Embase, and Web of Science, covering publications from 1989 to 2024 inclusive. Starting with advancements in tracer development, we going to explore the rationale for integration of imaging techniques, and the critical role novel formulations such as nanoparticles, nano- and micro-emulsions in enhancing imaging agent delivery and visualisation. Results: The review highlights the use of innovative formulations in improving intranasal administration of neuroimaging agents, showcasing their ability to navigate the complex anatomical and physiological barriers of the nose-to-brain pathway. Various imaging techniques, MRI, PET, SPECT, CT, FUS and OI, were evaluated for their effectiveness in tracking these agents. The findings indicate significant improvements in brain targeting efficiency, rapid uptake, and sustained brain presence using innovative formulations. Conclusion: Future directions involve the development of optimised tracers tailored for intranasal administration, the potential of multimodal imaging approaches, and the implications of these advancements for diagnosing and treating neurological disorders.
Keywords: brain imaging; imaging modalities; intranasal administration; neuroimaging agents; nose-to-brain.
© The author(s).
Conflict of interest statement
Competing Interests: The authors have declared that no competing interest exists.
Figures
References
-
- Lochhead JJ, Thorne RG. Intranasal delivery of biologics to the central nervous system. Adv Drug Deliv Rev. 2012;64:614–28. - PubMed
-
- Kumar H, Mishra G, Sharma AK, Gothwal A, Kesharwani P, Gupta U. Intranasal drug delivery: A non-invasive approach for the better delivery of neurotherapeutics. Pharm Nanotechnol. 2017;5:203–14. - PubMed
-
- Chen Y, Zhang C, Huang Y, Ma Y, Song Q, Chen H. et al. Intranasal drug delivery: The interaction between nanoparticles and the nose-to-brain pathway. Adv Drug Deliv Rev. 2024;207:115196. - PubMed
Publication types
MeSH terms
Substances
LinkOut - more resources
Full Text Sources
