Multicenter Study
. 2024 Aug 19;14(13):5200-5218.
doi: 10.7150/thno.97007. eCollection 2024.

SEMA6B induces macrophage-mediated inflammation and hepatocyte apoptosis in hepatitis B virus-related acute-on-chronic liver failure

Affiliations
Multicenter Study

SEMA6B induces macrophage-mediated inflammation and hepatocyte apoptosis in hepatitis B virus-related acute-on-chronic liver failure

Hui Yang et al. Theranostics. .

Abstract

Rationale: Patients with hepatitis B virus-related acute-on-chronic liver failure (HBV-ACLF) have a high short-term mortality rate. Semaphorin-6B (SEMA6B) plays a crucial role in the pathogenesis of HBV-ACLF, but its molecular basis remains unclear. This study aimed to elucidate the mechanisms of SEMA6B in HBV-ACLF progression. Methods: A total of 321 subjects with HBV-ACLF, liver cirrhosis (LC), chronic hepatitis B (CHB), and normal controls (NC) from a prospective multicenter cohort were studied. 84 subjects (HBV-ACLF, n = 50; LC, n = 10; CHB, n = 10; NC, n = 14) among them underwent mRNA sequencing using peripheral blood mononuclear cells (PBMCs) to clarify the mechanisms of SEMA6B in HBV-ACLF. These mechanisms were validated through in vitro studies with hepatocytes and macrophages, as well as in vivo using SEMA6B knockout mice and mice treated with synthetic SEMA6B siRNA. Results: Transcriptome analysis of PBMCs showed that SEMA6B was among the most differentially expressed genes when comparing patients with HBV-ACLF to those with LC, CHB, or NC. ROC analysis demonstrated the reliable diagnostic value of SEMA6B for HBV-ACLF in both the sequencing cohort and an external validation cohort (AUROC = 0.9788 and 0.9026, respectively). SEMA6B levels were significantly higher in the HBV-ACLF patients, especially in non-survivors, with high expression mainly observed in macrophages and hepatocytes in liver tissue. Genes significantly associated with highly expressed SEMA6B were enriched in inflammation and apoptosis pathways in HBV-ACLF non-survivors. Overexpression of SEMA6B in macrophages activated systemic inflammatory responses, while its overexpression in hepatocytes inhibited proliferation through G0/G1 cell cycle arrest and induced apoptosis. Knocking out SEMA6B rescued mice with liver failure by improving liver functions, reducing inflammatory responses, and decreasing hepatocyte apoptosis. Transcriptome analysis of liver tissue showed that SEMA6B knockout significantly ameliorated the liver failure signature, significantly downregulating inflammation-related pathways. Importantly, therapeutic delivery of synthetic SEMA6B siRNA also improved liver function, and reduced both inflammation and hepatocyte apoptosis in mice with liver failure. Conclusion: SEMA6B, a potential diagnostic biomarker for HBV-ACLF, exacerbates liver failure through macrophage-mediated systemic inflammation and hepatocyte apoptosis. These findings highlight SEMA6B as a promising early treatment target for HBV-ACLF patients.

Keywords: acute-on-chronic liver failure; apoptosis; biomarker; hepatitis B virus; inflammation.


Conflict of interest statement

Competing Interests: The authors have declared that no competing interest exists.

Figures

Figure 1
Figure 1
Identification of SEMA6B as a potential diagnostic biomarker for HBV-ACLF progression. (A) PCA of subjects in the HBV-ACLF, LC, CHB, and NC groups; the gray line indicates the direction of disease progression. (B) Volcano plot showing the top 10 significant DEGs from the pairwise comparisons of HBV-ACLF versus LC, HBV-ACLF versus CHB, and HBV-ACLF versus NC. Significantly differentially expressed genes (|log2-fold change| > 1; adjusted p-value < 0.05) are shown in red (upregulated) and blue (downregulated). (C) The number of significant DEGs in four pairwise comparisons. Red and blue columns represent the significantly upregulated and downregulated DEGs, respectively. (D) Frequencies of the top 10 genes among the top 20 significant DEGs in the three comparisons: HBV-ACLF versus LC, HBV-ACLF versus CHB, and HBV-ACLF versus NC. (E) ROC curves of SEMA6B levels for distinguishing patients with HBV-ACLF from those with LC, CHB, and normal controls (left), and for distinguishing 28-day HBV-ACLF survivors from non-survivors (right). (F) SEMA6B levels in patients from the HBV-ACLF, LC, CHB and NC groups (left) (****p < 0.0001, ns: not significant), and in 28-day HBV-ACLF survivors versus non-survivors (right) (**p < 0.01) in the sequencing cohort. (G) SEMA6B levels in patients with the HBV-ACLF, LC, CHB, and NC groups (left) (****p < 0.0001, ns: not significant), and ROC curves of SEMA6B expression levels for distinguishing patients with HBV-ACLF from those with LC, CHB, and normal controls in the external validation cohort. (H) Immunohistochemical staining for SEMA6B in patients from the HBV-ACLF, LC, CHB, and NC groups. Three subjects per group. Black and red arrows indicate hepatocyte-like and immune cell-like positive staining, respectively (bar = 100 μm). ACLF, acute-on-chronic liver failure; LC, liver cirrhosis; CHB, chronic hepatitis B; NC, normal control; PCA, principal component analysis; DEGs, differentially expressed genes.
Figure 2
Figure 2
SEMA6B expression levels are strongly associated with ACLF disease severity and inflammation. (A) SEMA6B expression levels stratified by ACLF grade. *p < 0.05. (B) SEMA6B expression levels stratified by INR. *p < 0.05. (C) SEMA6B expression levels stratified by coagulation failure status. *p < 0.05. (D) Correlation of SEMA6B expression levels with clinical indicators (INR, ALT) in the ACLF group. Spearman's correlation coefficient (r) and the p-value of each correlation are annotated. (E) Gene set enrichment analysis results using the gene list ranked by Pearson's correlation coefficient values associated with SEMA6B expression. The top 10 significant Gene Ontology (GO) biological processes and KEGG pathways are identified. ACLF, acute-on-chronic liver failure; INR, international normalized ratio; ALT, alanine aminotransferase; GO, Gene Ontology; NES, normalized enrichment score; KEGG, Kyoto Encyclopedia of Genes and Genomes.
Figure 3
Figure 3
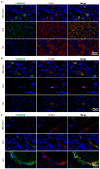
Immunofluorescence staining of human liver tissues depicting the cell types that highly express SEMA6B in HBV-ACLF patients. Co-immunofluorescence staining for hSEMA6B (green) (A) a hepatocyte marker (hALB; red), (B) a macrophage marker (hCD86; red), and (C) an endothelial cell marker (hCD31; red) in liver tissues from patients with HBV-ACLF, CLD and NC. Nuclei stained with DAPI (blue). Scale bars: (A) 50 μm; (B) 20 μm; (C) 20 μm. ALB: albumin; HBV-ACLF, hepatitis virus B related acute-on-chronic liver failure; CLD: chronic liver disease; NC: normal control.
Figure 4
Figure 4
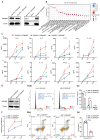
Evidence for the functions of SEMA6B in macrophages and hepatocytes. (A) Western blot showing SEMA6B expression levels in the RAW264.7-SEMA6BOE, RAW264.7-SEMA6BKD, and RAW264.7-SEMA6BWT groups. (B) Gene Ontology analysis of proteins interacting with SEMA6B, highlighting the top 20 significant biological processes. (C) Concentrations of inflammatory cytokines in the supernatants of RAW264.7-SEMA6BOE (red), RAW264.7-SEMA6BKD (blue), and RAW264.7-SEMA6BWT (green) cells at 0 h, 6 h, and 12 h after LPS stimulation. *p < 0.05, **p < 0.01, ***p < 0.001, n = 3/group. (D) Western blot showing SEMA6B expression levels in the AML12-SEMA6BOE and AML12-SEMA6BWT groups. (E) (a-b) Cytometric analysis of the cell cycle in the two groups at 24 h after LPS stimulation. (F) CCK-8 assay of cell proliferation in the two groups at 24 h, 48 h, and 72 h after LPS stimulation. (G) (a-b) Cytometric analysis of apoptosis in the two groups at 24 h after LPS stimulation. Mean ± SEM, *p < 0.05, **p < 0.01, n = 3/group. KD: knockdown; OE: overexpression; WT: wild-type; LPS: lipopolysaccharide; IL: interleukin; CCL: C-C motif chemokine ligand; ICAM: intercellular cell adhesion molecule.
Figure 5
Figure 5
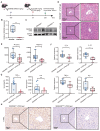
Effects of SEMA6B deficiency in an LPS/D-gal-induced liver failure mouse model. (A) Schematic design for modeling LPS/D-gal-induced liver failure. (B) Relative mRNA expression of SEMA6B in the two groups. Mean ± SEM, **p < 0.01, n = 4/group. (C) Survival analysis of mice in the two groups over 24h, *p < 0.05, n = 16/group. (D) (a-b) Immunohistochemical staining for SEMA6B in liver tissue from the four groups (bar = 50 μm). **p < 0.01, n = 4/group; five random fields analyzed per liver section. (E) (a) H&E staining of liver tissue from the four groups (bar = 50 μm); (b) inflammatory score of H&E staining in the four groups. Mean ± SEM, *p < 0.05, n = 4/group; five random fields analyzed per liver section. (F) Four typical biochemical indices of liver function detected in the four groups, mean ± SEM, *p < 0.05, ***p < 0.001, ns: not significant, n = 5-7/group. LPS: lipopolysaccharide; D-gal: D-galactose; ALT: alanine aminotransferase; AST: aspartate aminotransferase; TBA: total bile acid; TBil: total bilirubin.
Figure 6
Figure 6
Evidence of liver inflammation and hepatocyte apoptosis in SEMA6B-/- mice with liver failure. (A) Relative mRNA expression levels of five inflammatory markers in liver tissues collected from the four groups. Mean ± SEM, *p < 0.05, **p < 0.01, n = 5-7/group, ns: not significant. (B) ELISA detection of TNF-α and IL-6 levels in the serum of mice in the four groups; mean ± SEM, *p < 0.05, **p < 0.01, n = 5-7/group; ns: not significant. (C-a) TUNEL staining of liver tissue collected from the four groups (bar = 50 μm); (C-b) apoptotic cells per field of TUNEL staining in the four groups. Mean ± SEM, **p < 0.01, NA: not available, n = 4/group; five random fields were analyzed per liver section. The red arrow shows positive cells. LPS: lipopolysaccharide; D-gal: D-galactose; IL: interleukin.
Figure 7
Figure 7
Evidence for the functions of SEMA6B in primary macrophages and hepatocytes. (A) Schematic design for isolation, culture and stimulation of BMDMs. (B) Western blot and (C) qRT-PCR showing the SEMA6B expression levels in the BMDM-SEMA6BWT and BMDM-SEMA6BKO groups. (D) The expression levels of the inflammatory cytokines BMDM-SEMA6BWT and BMDM-SEMA6BKO groups at 0 h, 6 h, and 24 h after LPS stimulation. (E) The levels of the inflammatory cytokines in the supernatants of BMDM-SEMA6BWT and BMDM-SEMA6BKO groups at 24 h after LPS stimulation. ns: not significant, *p < 0.05, **p < 0.01, ***p < 0.001, ****p < 0.0001, n = 4-6/group. (F) Schematic design for isolation of PMHs. Western blotting showing the SEMA6B expression levels in the PMH-SEMA6BWT and PMH-SEMA6BKO groups (G) CCK-8 detection of cell proliferation in the two groups at 24 h, 48 h, and 72 h after LPS stimulation. (H) Cytometric analysis of apoptosis in the two groups at 24 h after LPS stimulation. Mean ± SEM, ns: not significant, *p < 0.05, **p < 0.01, n=4/group. BMDMs: bone marrow-derived macrophages; PMHs: primary mouse hepatocytes; KD: knockdown; OE: overexpression; WT: wild-type; LPS: lipopolysaccharide; IL: interleukin; CCL: C-C motif chemokine ligand; ICAM: intercellular cell adhesion molecule.
Figure 8
Figure 8
Transcriptomic characteristics of SEMA6B knockout mice with LPS/D-gal-induced liver failure. (A) Principal component analysis of liver tissues from the four groups (n = 5-7/group). (B) The top 10 significant DEGs from the pairwise comparison of SEMA6B-/--LPS/D-gal versus SEMA6B-/--NC, SEMA6B+/+-ALF versus SEMA6B+/+-NC and SEMA6B-/--LPS/D-gal versus SEMA6B+/+-LPS/D-gal are shown in a volcano plot. Significantly differentially expressed genes (|log2Fold Change| > 3, adjusted p value < 0.05) are shown in red (upregulated) and blue (downregulated). (C) Identification of the top 20 significantly upregulated (red) and downregulated (blue) biological processes and (D) KEGG pathways in three pairwise comparisons between the two groups. Enrichment analysis was performed using gene set enrichment analysis, with red (up) and blue (down) indicating the normalized enrichment score of each gene set. LPS: lipopolysaccharide; D-gal: D-galactose; GO, Gene Ontology; KEGG, Kyoto Encyclopedia of Genes and Genomes; NES, normalized enrichment score.
Figure 9
Figure 9
Effects of treatment of SEMA6B siRNA in liver failure mouse models. (A) Schematic design for administrating SEMA6B siRNA in mouse models of liver failure. (B) qRT-PCR and (C) Western blot showing the SEMA6B expression levels in the SEMA6B+/+ and SEMA6BsiRNA groups. (D) H&E staining of liver tissue from the two groups (bar = 100 μm). (E) Two classical biochemical indexes of liver function detected in the two groups, mean ± SEM, *p < 0.05, n = 6-8/group. (F) Relative mRNA expression levels of four inflammatory markers in liver tissues collected from the two groups. Mean ± SEM, *p < 0.05, ***p < 0.001, n = 8/group. (G) ELISA detection of the TNF-α and IL-6 levels in the serum of mice in the two groups; mean ± SEM, *p < 0.05, ns: not significant, n = 6/group. (H) TUNEL staining of liver tissue collected from the two groups (bar = 100 μm), n = 6-8/group.

References

    1. Bernal W, Jalan R, Quaglia A, Simpson K, Wendon J, Burroughs A. Acute-on-chronic liver failure. Lancet. 2015;386:1576–87. - PubMed
    1. Wu T, Li J, Shao L, Xin J, Jiang L, Zhou Q. et al. Development of diagnostic criteria and a prognostic score for hepatitis B virus-related acute-on-chronic liver failure. Gut. 2018;67:2181–91. - PubMed
    1. Li J, Liang X, You S, Feng T, Zhou X, Zhu B. et al. Development and validation of a new prognostic score for hepatitis B virus-related acute-on-chronic liver failure. J Hepatol. 2021;75:1104–15. - PubMed
    1. Hernaez R, Solà E, Moreau R, Ginès P. Acute-on-chronic liver failure: an update. Gut. 2017;66:541–53. - PMC - PubMed
    1. Arroyo V, Angeli P, Moreau R, Jalan R, Clària J, Trebicka J. et al. The systemic inflammation hypothesis: Towards a new paradigm of acute decompensation and multiorgan failure in cirrhosis. J Hepatol. 2021;74:670–85. - PubMed

Publication types

MeSH terms

LinkOut - more resources