. 2024 Aug 19;14(13):5001-5021.
doi: 10.7150/thno.100321. eCollection 2024.

Mitochondria-encoded peptide MOTS-c participates in plasma membrane repair by facilitating the translocation of TRIM72 to membrane

Affiliations

Mitochondria-encoded peptide MOTS-c participates in plasma membrane repair by facilitating the translocation of TRIM72 to membrane

Hong Jia et al. Theranostics. .

Abstract

Rationale: An impairment of plasma membrane repair has been implicated in various diseases such as muscular dystrophy and ischemia/reperfusion injury. MOTS-c, a short peptide encoded by mitochondria, has been shown to pass through the plasma membrane into the bloodstream. This study determined whether this biological behavior was involved in membrane repair and its underlying mechanism. Methods and Results: In human participants, the level of MOTS-c was positively correlated with the abundance of mitochondria, and the membrane repair molecule TRIM72. In contrast to high-intensity eccentric exercise, moderate-intensity exercise improved sarcolemma integrity and physical performance, accompanied by an increase of mitochondria beneath the damaged sarcolemma and secretion of MOTS-c. Furthermore, moderate-intensity exercise increased the interaction between MOTS-c and TRIM72, and MOTS-c facilitated the trafficking of TRIM72 to the sarcolemma. In vitro studies demonstrated that MOTS-c attenuated membrane damage induced by hypotonic solution, which could be blocked by siRNA-TRIM72, but not AMPK inhibitor. Co-immunoprecipitation study showed that MOTS-c interacted with TRIM72 C-terminus, but not N-terminus. The dynamic membrane repair assay revealed that MOTS-c boosted the trafficking of TRIM72 to the injured membrane. However, MOTS-c itself had negligible effects on membrane repair, which was recapitulated in TRIM72-/- mice. Unexpectedly, MOTS-c still increased the fusion of vesicles with the membrane in TRIM72-/- mice, and dot blot analysis revealed an interaction between MOTS-c and phosphatidylinositol (4,5) bisphosphate [PtdIns (4,5) P2]. Finally, MOTS-c blunted ischemia/reperfusion-induced membrane disruption, and preserved heart function. Conclusions: MOTS-c/TRIM72-mediated membrane integrity improvement participates in mitochondria-triggered membrane repair. An interaction between MOTS-c and plasma lipid contributes to the fusion of vesicles with membrane. Our data provide a novel therapeutic strategy for rescuing organ function by facilitating membrane repair with MOTS-c.

Keywords: Ischemia/reperfusion injury; MOTS-c; Membrane repair; Mitochondria; TRIM72.


Conflict of interest statement

Competing Interests: The authors have declared that no competing interest exists.

Figures

Figure 1
Figure 1
Moderate to vigorous physical activity (MVPA) increases both MOTS-c and TRIM72 in the skeletal muscle of the human participants. (A) Representative Western blotting along with densitometric analysis of MOTS-c. (B) qPCR detection of MOTS-c. The results are expressed relative to the light-intensity physical activity (LPA) group. (C-D. Grouped results of qPCR for mtDNA and intracellular ATP content. (E) Representative Western blotting along with densitometric analysis of TRIM72. (F) qPCR analysis of TRIM72. The results are expressed relative to the LPA group. (G) A correlation analysis between the abundance of MOTS-c and TRIM72 mRNA. Data were analyzed by the 2-ΔΔCt method, and an arbitrary unit (A. U.) was expressed by a ratio of the value in each sample to the mean value for all the participants. The data are expressed as the mean ± SEM using bars with scatter dot plots. Each dot represents an individual human participant. *P < 0.05, **P < 0.01 vs. LPA.
Figure 2
Figure 2
MOTS-c treatment ameliorates high-intensity exercise-induced membrane disruption. (A) Treadmill performance. The left panel is the total distance traveled; the right panel is the latency to the first shock (FS) to stimulate running. (B) Grouped results of the levels of creatine kinase (CK, left panel) and lactate (right panel) in the plasma. (C-D) Representative confocal images of Evans blue staining and group results of the percentage of Evans blue-positive cells. The columns left to right are the sedentary (SE), high-intensity exercise (HIE), moderate-intensity exercise (MIE), and HIE with MOTS-c (HIE+M) groups. Scale bar, 20 μm. (E-F) Representative transmission electron micrographs and group results of the length of the damaged membrane. The columns left to right are SE, HIE, MIE, and HIE+M groups. Arrows indicate the nanopores of the plasma membrane; stars symbolize mitochondria. Scale bar, 200 nm. All mice received a 23 m/min exercise challenge at a declination of 15º for 30 min on the day after finishing the exercise regimen. MOTS-c was administered intraperitoneally at a dose of 15 mg/kg/d during acclimation and high-intensity exercise. The data are expressed as the mean ± SEM using bars with scatter dot plots. Each dot represents an individual animal. *P < 0.05, **P < 0.01 vs. SE, #P < 0.05, ##P < 0.01 vs. HIE. For morphological examination, three separate regions per muscle were examined, and experiments were repeated in 8 animals.
Figure 3
Figure 3
Moderate-intensity exercise increases the abundance of mitochondria in skeletal muscle and the level of MOTS-c in plasma. (A) The concentration of MOTS-c in plasma. (B) Grouped results of the abundance of mtDNA (Cytb) and the ratio of mtDNA to nuclear DNA (cyclophilin A) with qPCR. (C) Transmission electron micrography showing the morphology of the interfibrillar mitochondria. Scale bar, 200 nm. (D) Transmission electron micrography showing the mitochondria underneath the plasma membrane. Scale bar, 200 nm. (E) Quantification of the number of mitochondria underneath the damaged membrane. The specimen was from gastrocnemius. Three separate regions per muscle were examined, and experiments were repeated in 8 animals. The data are expressed as the mean ± SEM using bars with scatter dot plots. Each dot represents an individual animal. *P < 0.05 vs. SE, #P < 0.05, ##P < 0.01 vs. HIE.
Figure 4
Figure 4
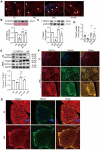
SiRNA-TRIM72 blocks the beneficial effects of MOTS-c in cell viability and membrane deformability. (A) Grouped results of the cell viability without (left panel) or with (middle and right panels) siRNA-TRIM72. The blocking potency of siRNA-TRIM72 is presented in the right panel, in which the loss of cell viability is calculated as a percentage of the difference between siRNA- and scRNA-treated group relative to the value in the corresponding scRNA-treated group, as shown in the middle panel. The cells were exposed to isotonic or hypotonic solution for 30 min. (B) Representative immunoblot of TRIM72. (C) Representative confocal images with or without siRNA-TRIM72 treatment. The differentiated C2C12 cells were transfected with siRNA-TRIM72 for 6 h, and scramble RNA (scRNA) was used as a control. Scale bar 20 μm. (D) Fluorescence lifetime τ1 images of Flipper-TR under isotonic solution or exposed to hypotonic solution in the presence or absence of 1 μM MOTS-c. The color bar corresponds to the lifetime in nanoseconds. MOTS-c at 1 μM was administered 5 min before and together with hypotonic solution exposure. Scale bar, 100 μm. (E) Representative time course tracing of lifetime τ1 when C2C12 cells were exposed to hypotonic solution in the absence or presence of 1 μM MOTS-c. (F) Grouped results of lifetime τ1 mean values. The data are expressed as the mean ± SEM using bars with scatter dot plots. Each dot represents one round of experiment or an individual cell. *P < 0.05, **P < 0.01 vs. Iso, ##P < 0.01 vs. corresponding group without MOTS-c. ++P < 0.01 vs. the corresponding group with scRNA. NS, no significant difference. Iso, Isotonic solution; Hypo, Hypotonic solution; M, MOTS-c; Mut, mutant of MOTS-c; SiRNA, siRNA-TRIM72.
Figure 5
Figure 5
Inhibition of AMPK fails to antagonize MOTS-c-triggered membrane repair. (A) Measurement of intracellular ATP at different times after addition of MOTS-c. The cells were exposed to hypotonic solution in the absence or presence of 1 μM MOTS-c. #P < 0.05, **P < 0.01. (B-C) Representative confocal images and group results on the percentage of propidium iodide-positive nuclei after treatment with MOTS-c or 10 μM Compound C. The cells were exposed to hypotonic solution for 15 min in the presence of 100 μg/ml propidium iodide. MOTS-c and Compound C were administered 5 min before hypotonic solution exposure. **P < 0.01 vs. Iso, #P < 0.05 vs. Hypo+V. NS, no significant difference. (D) Representative immunoblot of AMPKα. (E-F) Representative confocal images and group results on the percentage of propidium iodide-positive nuclei after treatment with siRNA-AMPKα. **P < 0.01 vs. siRNA. Scramble RNA (scRNA) was used as a control. Scale bar 20 μm. The data are expressed as the mean ± SEM using bars with scatter dot plots. Each dot represents one round of experiment. V, vehicle (saline); Hypo, Hypotonic solution; PI, propidium iodide; M, MOTS-c; CC, Compound C.
Figure 6
Figure 6
Replenishment of MOTS-c increases the trafficking of TRIM72 to the plasma membrane via interacting with TRIM72 and enhancing the expression of TRIM72. (A) Representative immunofluorescence staining of TRIM72 in each group. Arrows indicate the membrane-positive staining. Scale bar, 20 μm. (B-C) Representative Western blotting of TRIM72 in the membrane fraction (M-TRIM72) and in total lysates (T-TRIM72) along with densitometric analysis. The data are expressed as the fold change relative to the sedentary group. (D) Grouped results of qPCR measurements of TRIM72 mRNA. (E) Representative Co-IP and input blots from tissue lysates, along with grouped analysis of total binding amounts of TRIM72 targeted to MOTS-c, which are indicated by IP level of TRIM72, and expressed with respect to that in sedentary group (SE). IB, immunoblot; IP, immunoprecipitation. (F) Immunofluorescence staining showing the colocalization of MOTS-c (red) and TRIM72 (green) in the plasma membrane and cytosol. Scale bar, 20 μm. The bottom exhibited a 3.5-fold enlargement from the dashed areas in the moderate-intensity exercise group. (G) Immunofluorescence staining showing both clathrin and TRIM72-positive particles. Scale bar, 5 μm. The data are expressed as the mean ± SEM using bars with scatter dot plots. Each dot represents an individual anmial. *P < 0.05, **P < 0.01 vs. SE, ##P < 0.01 vs. HIE. For immunofluorescence analysis, three separate regions per muscle were examined, and experiments were repeated in 6 animals.
Figure 7
Figure 7
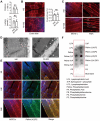
MOTS-c interacted with TRIM72 at C-terminus. (A) Representative Co-IP of TRIM72-flag and MOTS-c-myc in lysates of HEK293T cells overexpressing MOTS-c and TRIM72, N-terminus (TRIM72-N) or C-terminus (TRIM72-C). (B) Grouped results on cell viability. Before exposing to hypotonic solution, cells were transfected with vector (Vec), MOTS-c (M), TRIM72, TRIM72-N and TRIM72-C. (C) Representative time-lapse images showing membrane repair process. C2C12 cells were transfected with ZsGreen-tagged TRIM72, and damaged using a pulsed laser in the presence of the FM4-64 fluorescent dye (red color). The green circle lines indicate the location of the damaged membrane. The injury intensity is indicated by FM4-64 accumulation. Scale bar, 10 μm. (D) Quantification of the ZsGreen-TRIM72 signal at the injury site. (E) Plot showing membrane repair kinetics monitored by ZsGreen intensity. (F) Quantification of the FM4-64 accumulation at the injury site at the end of experiments. The data are expressed as the mean ± SEM using bars with scatter dot plots. Each dot represents one round of experiment or an individual cell. *P < 0.05, **P < 0.01 vs. Vec. ##P < 0.01 vs. TRIM72.
Figure 8
Figure 8
Replenishment of MOTS-c fails to improve membrane integrity in TRIM72-/- mice but stimulates the translocation of intracellular vesicles to the membrane via binding to lipids. (A) Group results of total distance traveled and lactate in plasma at the end of exercise challenge in TRIM72-/- mice. (B) Representative images of fluorescent probing of Evans blue in TRIM72-/- mice. Scale bar, 20 μm. (C) Representative immunostaining of MOTS-c and WGA in TRIM72-/- mice. Scale bar, 20 μm. Solid circles indicate WGA-positive vesicles passing across membrane, which is different from that in the dashed circle. (D) Representative transmission electron micrographs in TRIM72-/- mice. Red stars denote the aggregation of many intracellular vesicles beneath the plasma membrane in the HIE group. White arrows indicate the fusion of vesicles to the plasma membrane in the M+HIE group. The gastrocnemius muscles were exercised for examination. Scale bar, 200 nm. (E) Representative immunofluorescent double staining of MOTS-c (red) and PtdIns (4,5) P2 (green). Scale bar, 20 μm. (F) Dot blotting showing the interactions between MOTS-c and membrane lipids. All TRIM72 KO mice received high-intensity exercise for 7 days. The exercise protocols, the regimen for treadmill performance examination, and MOTS-c treatment were identical to those in Figure 2. The data are expressed as the mean ± SEM using bars with scatter dot plots. Each dot represents an individual animal. NS, no significant difference. For immunofluorescence analysis, three separate regions per muscle were examined, and experiments were repeated in 6 animals.
Figure 9
Figure 9
MOTS-c blunts myocardial ischemia/reperfusion injury. (A) Grouped results on effects of MOTS-c on cell viability, ATP content, and LDH leak in hypoxia-reoxygenated neonatal rat cardiomyocytes. (B) Representative tracings of left ventricular pressure (LVP) and the corresponding ± dp/dtmax, and grouped results of left ventricular developed pressure (LVDP) and ± dp/dtmax. (C) Grouped results of cardiac troponin I (cTnI) and lactate dehydrogenase (LDH) in plasma at the end of reperfusion. (D) Representative images of heart slices stained with triphenyl tetrazolium chloride (TTC) and grouped results of infarct size, which was expressed as a percentage of area at risk (AAR). (E) Representative confocal images showing the intracellular accumulation of Evans blue and grouped results of the positive area which was expressed as a percentage of the total area. Scale bar, 25 μm. (F) Representative images of fluorescent probing of TRIM72. White arrows indicate an increase of membrane- recruited TRIM72 in the I/R+MOTS-c group. Scale bar, 20 μm. The data are expressed as the mean ± SEM using bars with scatter dot plots. Each dot represents one round of experiment or an individual animal. *P < 0.05, **P < 0.01 vs. H/R or I/R. H/R, hypoxia/reoxygenation. I/R, ischemia/reperfusion.

References

    1. McNeil PL, Khakee R. Disruptions of muscle fiber plasma membranes. Role in exercise-induced damage. Am J Pathol. 1992;140:1097–109. - PMC - PubMed
    1. Mahmassani ZS, Son K, Pincu Y, Munroe M, Drnevich J, Chen J. et al. α7β1 Integrin regulation of gene transcription in skeletal muscle following an acute bout of eccentric exercise. Am J Physiol Cell Physiol. 2017;312:C638–50. - PMC - PubMed
    1. Sahebkar A, Cicero AFG, Di Giosia P, Pomilio I, Stamerra CA, Giorgini P. et al. Pathophysiological mechanisms of statin-associated myopathies: possible role of the ubiquitin-proteasome system. J Cachexia Sarcopenia Muscle. 2020;11:1177–86. - PMC - PubMed
    1. Friedrich EE, Hong Z, Xiong S, Zhong M, Di A, Rehman J. et al. Endothelial cell Piezo1 mediates pressure-induced lung vascular hyperpermeability via disruption of adherens junctions. Proc Natl Acad Sci USA. 2019;116:12980–5. - PMC - PubMed
    1. Wang S, Wang B, Shi Y, Moller T, Stegmeyer RI, Strilic B. et al. Mechanosensation by endothelial PIEZO1 is required for leukocyte diapedesis. Blood. 2022;140:171–83. - PMC - PubMed

Publication types

LinkOut - more resources