. 2024 Aug 19;14(13):5102-5122.
doi: 10.7150/thno.99563. eCollection 2024.

Extrachromosomal circular DNA orchestrates genome heterogeneity in urothelial bladder carcinoma

Affiliations

Extrachromosomal circular DNA orchestrates genome heterogeneity in urothelial bladder carcinoma

Wei Lv et al. Theranostics. .

Abstract

Rationale: Extrachromosomal circular DNA is a hallmark of cancer, but its role in shaping the genome heterogeneity of urothelial bladder carcinoma (UBC) remains poorly understood. Here, we comprehensively analyzed the features of extrachromosomal circular DNA in 80 UBC patients. Methods: We performed whole-genome/exome sequencing (WGS/WES), Circle-Seq, single-molecule real-time (SMRT) long-read sequencing of circular DNA, and RNA sequencing (RNA-Seq) on 80 pairs of tumor and AT samples. We used our newly developed circular DNA analysis software, Circle-Map++ to detect small extrachromosomal circular DNA from Circle-Seq data. Results: We observed a high load and significant heterogeneity of extrachromosomal circular DNAs in UBC, including numerous single-locus and complex chimeric circular DNAs originating from different chromosomes. This includes highly chimeric circular DNAs carrying seven oncogenes and circles from nine chromosomes. We also found that large tumor-specific extrachromosomal circular DNAs could influence genome-wide gene expression, and are detectable in time-matched urinary sediments. Additionally, we found that the extrachromosomal circular DNA correlates with hypermutation, copy number variation, oncogene amplification, and clinical outcome. Conclusions: Overall, our study provides a comprehensive extrachromosomal circular DNA map of UBC, along with valuable data resources and bioinformatics tools for future cancer and extrachromosomal circular DNA research.

Keywords: cancer genetics; ecDNA; eccDNA; extrachromosomal circular DNA; urothelial bladder carcinoma.


Conflict of interest statement

Competing Interests: The authors have declared that no competing interest exists.

Figures

Figure 1
Figure 1
Experimental workflow and comprehensive ecDNAprofiling in CCGA-UBC samples (n = 80 patients). (A) Experimental workflow. A total of 80 pairs of freshly snap-frozen tumor tissues and Adjacent Tumor Tissues (ATs) were collected from UBC patients. Each sample underwent WGS, WES, Circle-Seq, SMRT of eccDNA, and RNA-seq for comprehensive extrachromosomal circular DNA analysis. WGS, WES, and Circle-Seq, were performed for all 80 pairs of tumor-AT samples. SMRT of eccDNA was performed on 9 pairs of tumor-AT samples. RNA samples from 9 tumor tissues and 24 ATs were excluded due to low RNA quality. (B) Model illustrating rapid accumulation of ecDNAs in cancer. Unlike chromosomes, ecDNA lacks centromeres, meaning their separation during mitosis is not controlled by the mitotic spindle. Consequently, ecDNAs are randomly distributed into daughter cells during cell division. This non-Mendelian inheritance pattern causes intra-tumoral heterogeneity. ecDNAs were detected using AA software based on copy number data and discordant reads inferred from WGS data. Abbreviations: HSR, homogenously staining region. (C) Number of UBC patients with indicated amplicon types in the CCGA-UBC cohort. Amplicons were classified as ecDNA, BFB, Heavily-rearranged, and Linear. Among these, Linear and Heavily-rearranged types are classified as HSR-like amplification. (D) Frequency of each focal amplification type between the TCGA-BLCA cohort and CCGA-UBC cohort. The frequency of non-HSR-like amplification (ecDNA and BFB) was compared using Fisher's exact test. (E-G) Comparison of size (E), copy count (F), and breakpoint count (G) for each type of focal amplification (Linear, n = 124; Heavily-rearranged, n = 49; BFB, n = 30; ecDNA, n = 68; Wilcoxon rank-sum test). The median absolute deviation (MAD) score is indicated.
Figure 2
Figure 2
ecDNA is common in urine sediment samples of patients with ecDNA+ tumors (n = 19 patients). (A) ecDNAs present in the urine sediment samples. The left panel illustrates the workflow for detecting ecDNA in urine sediment samples. WGS was performed on time-matched urine samples from 19 patients with ecDNA+ tumors. The right panel shows the overlap of ecDNA detected in tumors and the corresponding urine samples. (B) Analysis of AA-generated structural variant (SV) and breakpoint graphs: Examples of ecDNA detected in tumors and corresponding time-matched urine samples from patient CCGA-UBC-074 are shown. The P value was calculated based on similarity scores among genomic overlapped ecDNA from tumors and matched urine samples using a beta-distribution model.
Figure 3
Figure 3
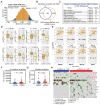
Differential patterns of small extrachromosomal circular DNA (eccDNA) between tumors and ATs (n = 80 patients). (A) Comparison of eccDNA counts per million mapped reads (EPM) between CCGA-UBC tumors and ATs (80 pairs; Paired t-test). eccDNAs were identified using a combination of Circle-Seq and Circle-Map++ methods. (B) Percentage of eccDNA mapped to protein-coding genes relative to all detected eccDNAs in tumors and ATs (80 pairs; Paired t-test). (C) Percentage of repeats in eccDNA-enriched datasets from tumors and ATs (80 pairs; Paired t-test). (D-E) Scatter plots showing the relationship between the EPM and the percentage of eccDNA mapped to protein-coding genes in ATs (D) and Tumors (E) (Pearson correlation test, n = 80). (F) A brief model depicting changes in the eccDNA profile during bladder carcinogenesis. (G) Overview of the eccDNA profile in CCGA-UBC samples. The graph illustrates the dynamics of eccDNA abundance of protein-coding genes in ATs (blue) and tumors (red). The eccDNA abundance for each protein-coding gene was calculated based on the unique junction (start point) counts, normalized by gene length and the number of detected eccDNAs. (H) Heatmap showing differential eccDNA abundance levels in protein-coding genes between tumors and ATs (80 pairs; absolute log2 fold change > 0.5; Wilcoxon rank-sum test, P < 0.01). (I) Genomic annotation of tumor-derived eccDNAs. The left panel shows the fraction of genomic elements affected by eccDNA, while the right panel shows the relative enrichment of eccDNA in each genomic element. The bottom panel briefly illustrates the location of genomic elements on the gene body. (J) Length distribution of eccDNAs (< 2 kb) detected in tumors and ATs (Pooled data from all cases in each group). (K) Comparison of the percentage of eccDNA across length ranges (< 2 kb; 2-10 kb; > 10 kb) in tumors and ATs (80 pairs; Paired t-test). (L) Distribution of alternative-B-allele frequency (BAF) in sequencing reads from WGS and Circle-Seq (n = 80 tumors). Most eccDNAs are of mono-allelic origin. (M) Pie chart showing the number of chimeric eccDNA in tumors and ATs. Chimeric eccDNAs refer to eccDNAs consisting of multiple fragments from one or more chromosomes. (N) Assembled sequence of a nine-fragment eccDNA (9f eccDNA) in CCGA-UBC-016N. (O) Comparison of the percentage of chimeric eccDNA among the total unique eccDNAs in tumors and ATs (9 pairs; Paired t-test). (P) Comparison of the percentage of single-event eccDNAs in tumors and ATs (9 pairs; Paired t-test). Single-event eccDNA refers to eccDNA that was sequenced from only a single long-read.
Figure 4
Figure 4
Correlation between ecDNA/eccDNA and gene expression. (A) Workflow for mRNA expression analysis. (B) Relative mRNA expression (Z-scores) of genes encoded on eccDNA and ecDNA (Wilcoxon rank-sum test). (C) Ranked mRNA expression in the CCGA-UBC-016 tumor sample. Red dot indicates genes carried on ecDNA. Oncogenes are marked with an asterisk (“*”). (D) Allele-specific analysis and genome browser tract at the PABPC1 gene locus from WGS, RNA-Seq, and Circle-Seq. The circular amplicon region is highlighted in yellow. Abbreviations: AF, allele frequency. (E-F). Comparison of gene expression levels (Transcripts Per Million; TPM) (E) and gene expression levels normalized by copy number (TPM/CN) (F) between genes encoded on ecDNA and HSR-like amplification (Heavily-rearranged and Linear) (Wilcoxon rank-sum test).
Figure 5
Figure 5
Characteristics of hypermutations on ecDNAs. (A) Rainfall plot illustrating the inter-mutation distances and the identified kataegis events (marked with black arrows) in sample CCGA-UBC-001T. (B) Proportions of kataegis events overlapping structural variants (SVs) and different types of focal amplifications. (C-D) Distance to the nearest SV (C) and ecDNA (D) breakpoints for non-clustered mutations and Kataegis mutations. (E) Mutational spectrum of kataegis on ecDNAs (kyklonas). (F) Comparison of the expression levels of APOBEC3A and APOBEC3B between ecDNA- (n = 32) and ecDNA+ tumors (n = 38), and between tumors with (n = 11) and without (n = 27) kyklonas (Wilcoxon rank-sum test). (G-H) Distributions of the variant allele frequencies (VAFs) for non-ecDNA kataegis (Kyklonas-) and kyklonas+ (G), and kyklonic ecDNA with and without oncogenes (H). (I) Comparison of the kyklonas mutation burden between ecDNAs with (n = 3) and without (n = 23) oncogenes (Wilcoxon rank-sum test).
Figure 6
Figure 6
Genetic background associated with ecDNA/eccDNA formation. (A) Correlation between gene expression levels and the EPM in the UBC tumor samples (Spearman correlation test). (B) Overlap of genes significantly correlated with the EPM and genes differentially expressed between ecDNA+ and ecDNA- UBC tumors. (C) Pathway enrichment analysis of genes correlated with ecDNA/eccDNA formation in UBC. (D) Expression levels of genes related to DNA repair and replication in ecDNA- and ecDNA+ tumors (Wilcoxon rank-sum test). (E) Correlation analysis between the expression level of genes related to DNA repair and replication and the EPM in 80 UBC tumor samples (Pearson correlation test). (F-G) Comparison of the mutation load in the whole genome and exonic regions between ecDNA- (n = 35) and ecDNA+ (n = 45) tumors (Wilcoxon rank-sum test). (H) Gene alterations in ecDNA- and ecDNA+ tumors. Genes with significant differences in mutation frequency between ecDNA- (n = 35) and ecDNA+ (n = 45) tumors (Fisher's exact test, P < 0.05) are marked in red.
Figure 7
Figure 7
Association of ecDNA/eccDNA and clinical features. (A) Comparison of ecDNA frequency across different clinical groups (Fisher's exact test). (B) Survival analysis for CCGA-NMIBC patients with tumors with (n = 12) or without (n = 10) ecDNA (log-rank test). (C) Overall survival (OS) analysis for patients with tumors with or without ecDNA from 13 cancer types in TCGA datasets (log-rank test). (D) Comparison of EPM values among different clinical groups (Wilcoxon rank-sum test). (E) Survival analysis for CCGA-UBC patients with tumors with low (n = 42) and high (n = 38) levels of eccDNA (log-rank test). The mean EPM value was used as the cutoff value to define the high and low EPM groups. (F) Gene Set Enrichment Analysis (GSEA) identified the pathways that were significantly enriched in the EPM groups.

References

    1. Xu N, Yao Z, Shang G, Ye D, Wang H, Zhang H. et al. Integrated proteogenomic characterization of urothelial carcinoma of the bladder. J Hematol Oncol. 2022;15:76. - PMC - PubMed
    1. Sanli O, Dobruch J, Knowles MA, Burger M, Alemozaffar M, Nielsen ME. et al. Bladder cancer. Nat Rev Dis Primers. 2017;3:17022. - PubMed
    1. Dyrskjøt L, Hansel DE, Efstathiou JA, Knowles MA, Galsky MD, Teoh J. et al. Bladder cancer. Nat Rev Dis Primers. 2023;9:58. - PMC - PubMed
    1. Robertson AG, Kim J, Al-Ahmadie H, Bellmunt J, Guo G, Cherniack AD. et al. Comprehensive molecular characterization of muscle-invasive bladder cancer. Cell. 2017;171:540–56.e25. - PMC - PubMed
    1. Cancer Genome Atlas Research Network. Comprehensive molecular characterization of urothelial bladder carcinoma. Nature. 2014;507:315–22. - PMC - PubMed

Publication types