. 2024 Aug 12;14(13):4948-4966.
doi: 10.7150/thno.99633. eCollection 2024.

Oncofetal TRIM71 drives liver cancer carcinogenesis through remodeling CEBPA-mediated serine/glycine metabolism

Affiliations

Oncofetal TRIM71 drives liver cancer carcinogenesis through remodeling CEBPA-mediated serine/glycine metabolism

Ying Su et al. Theranostics. .

Abstract

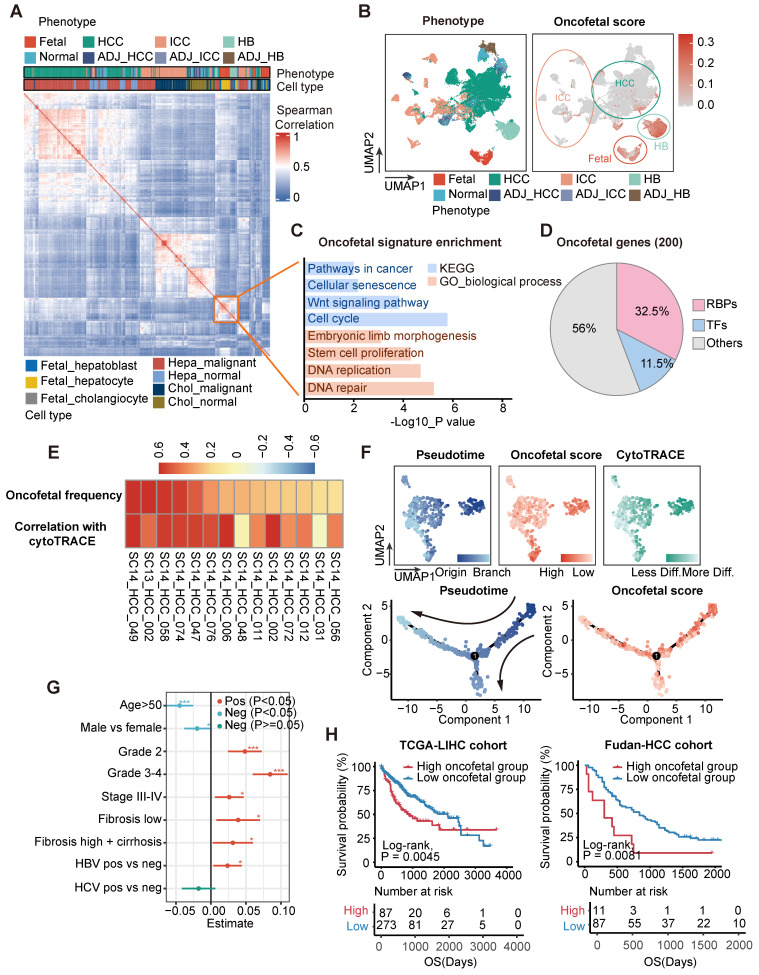
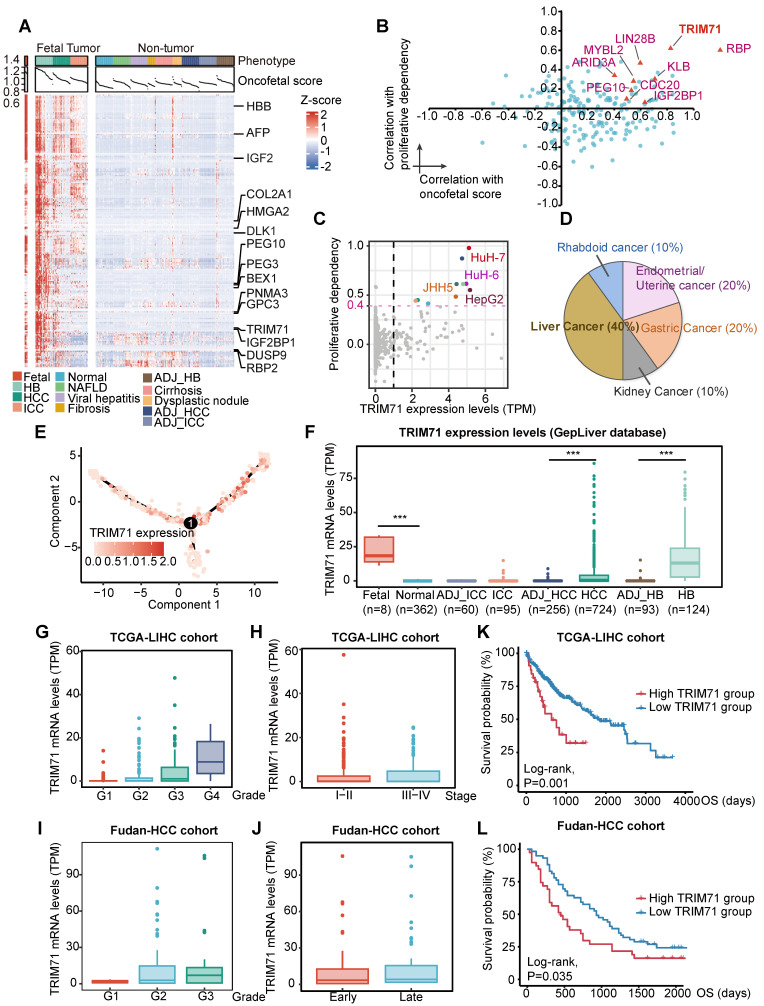
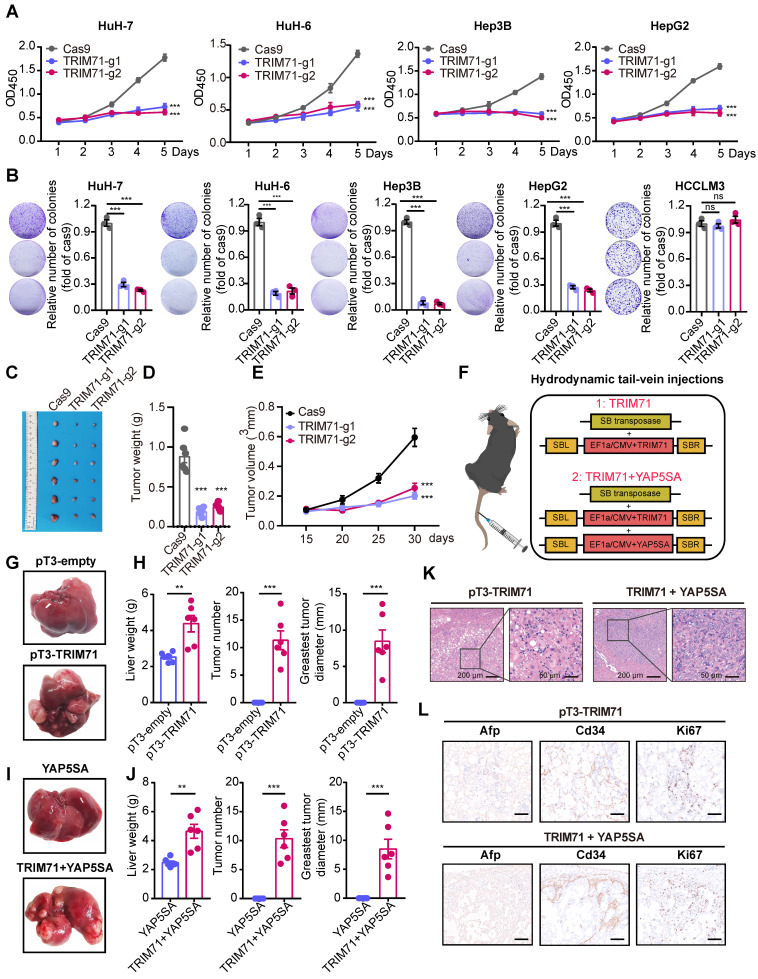
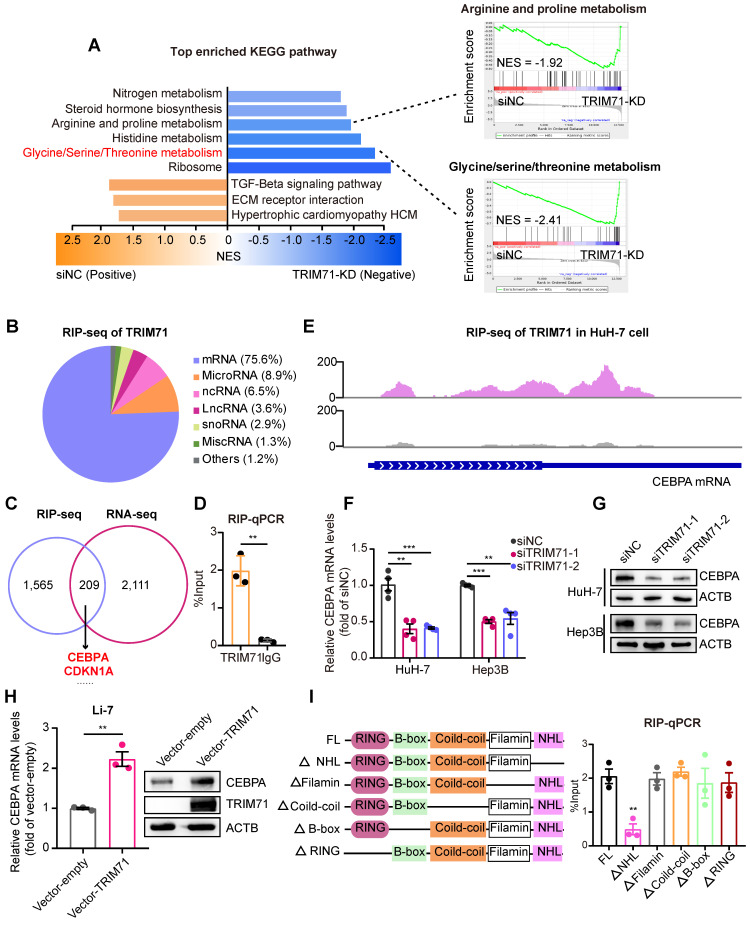
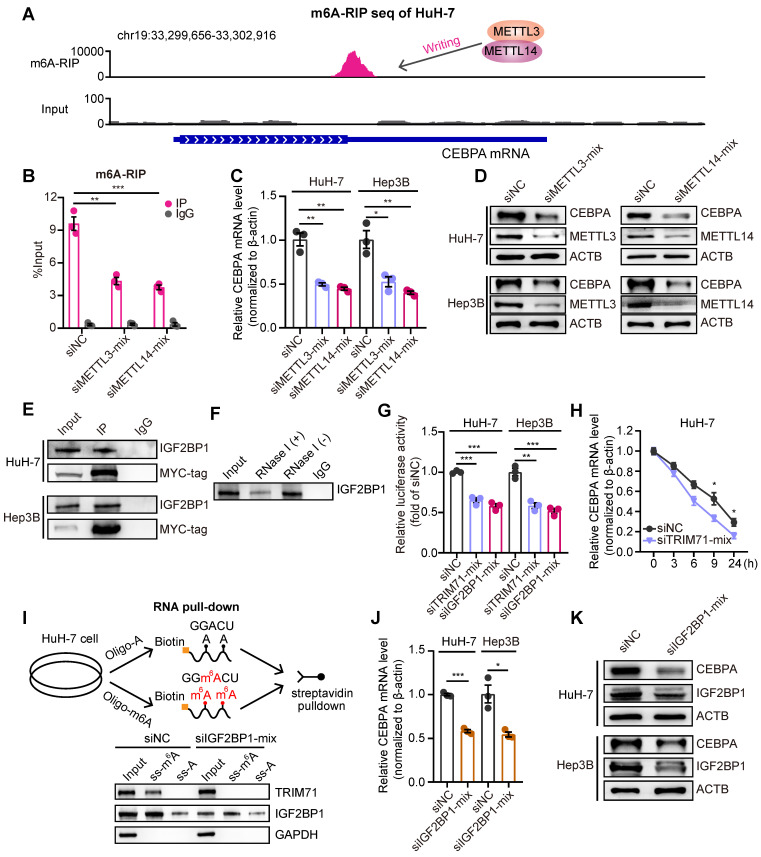
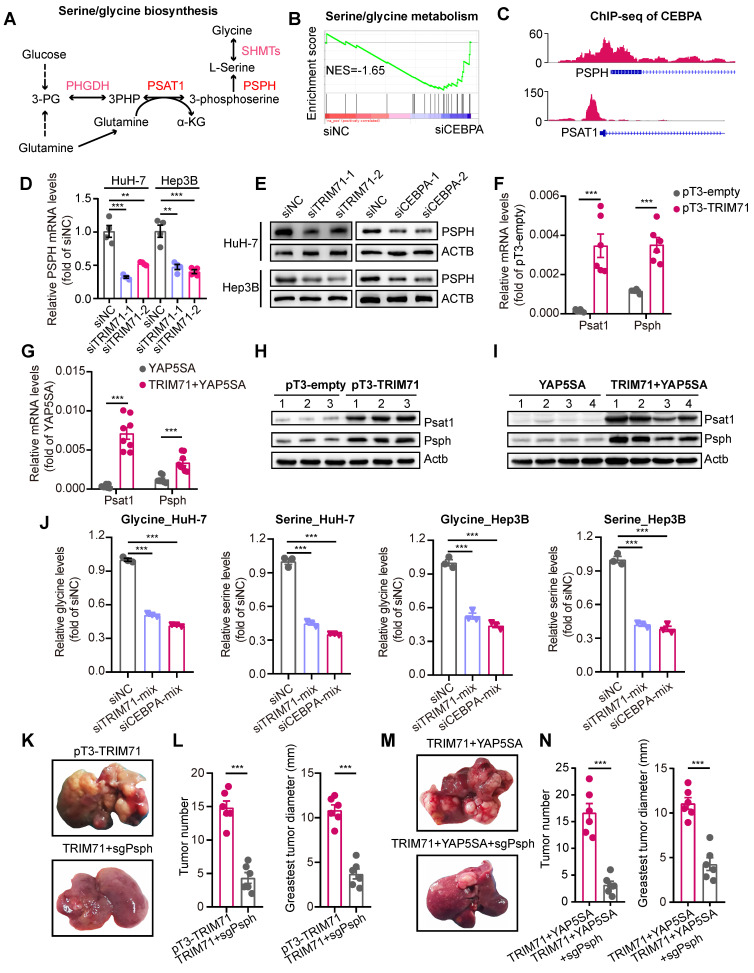
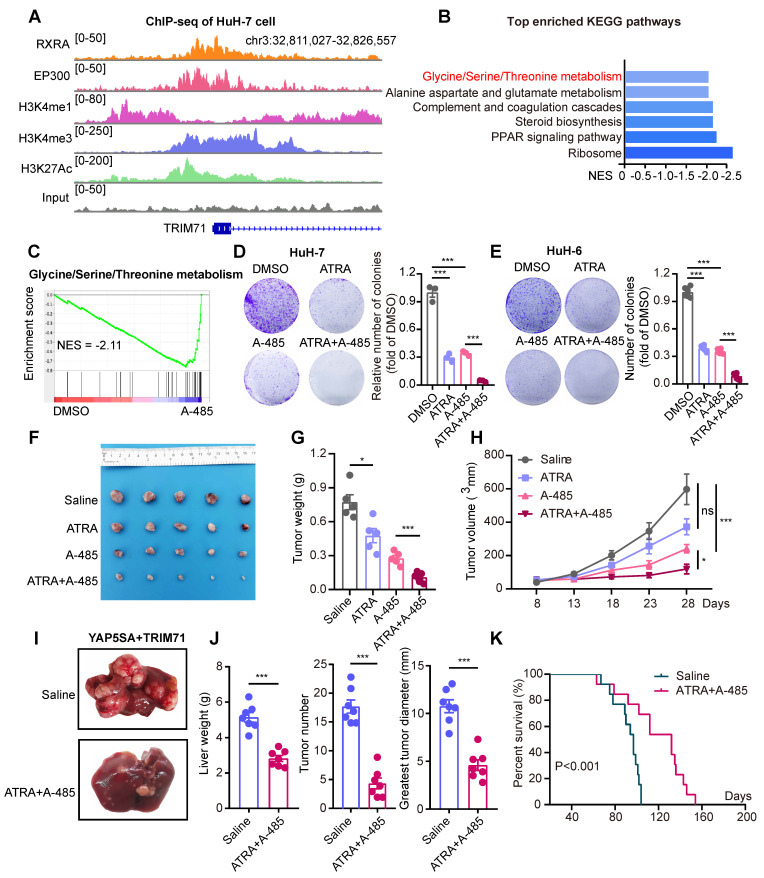
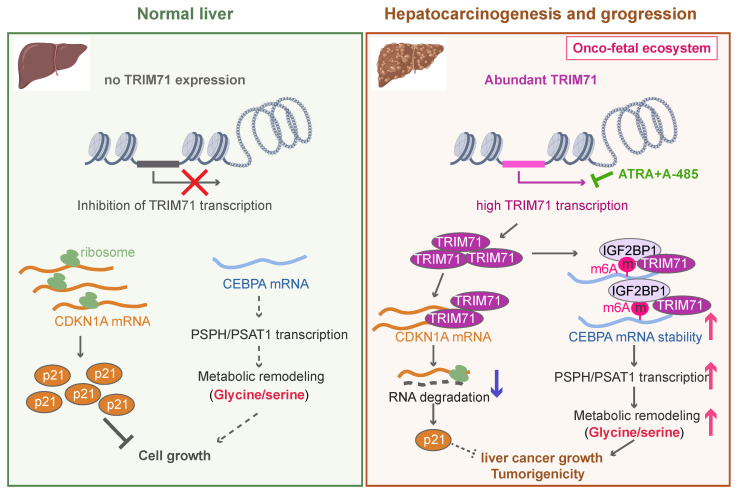
Rationale: Tumor cells remodel transcriptome to construct an ecosystem with stemness features, which maintains tumor growth and highly malignant characteristics. However, the core regulatory factors involved in this process still need to be further discovered. Methods: Single cell RNA-sequncing (scRNA-seq) and bulk RNA-sequencing profiles derived from fetal liver, normal liver, liver tumors, and their adjacent samples were collected to analyze the ecosystem of liver cancer. Mouse models were established to identify molecular functions of oncofetal-related oncogenes using hydrodynamic tail vein injection. Results: We found that liver cancer rebuilt oncofetal ecosystem to maintain malignant features. Interestingly, we identified a group of RNA-binding proteins (RBPs) that were highly overexpressed with oncofetal features. Among them, TRIM71 was specifically expressed in liver cancers and was associated with poor outcomes. TRIM71 drove the carcinogenesis of hepatocellular carcinoma (HCC), and knockdown of TRIM71 significantly abolished liver cancer cell proliferation. Mechanistically, TRIM71 formed a protein complex with IGF2BP1, bound to and stabilized the mRNA of CEBPA in an m6A-dependent manner, enhance the serine/glycine metabolic pathway, and ultimately promoted liver cancer progression. Furthermore, we identified that all-trans-retinoic acid (ATRA) combined with e1A binding protein p300 (EP300) inhibitor A-485 repressed TRIM71, attenuated glycine/serine metabolism, and inhibited liver cancer cell proliferation with high TRIM71 levels. Conclusions: We demonstrated the oncofetal status in liver cancer and highlighted the crucial role of TRIM71 and provided potential therapeutic strategies and liver cancer-specific biomarker for liver cancer patients.

Keywords: CEBPA; RNA-binding proteins; TRIM71; m6A; serine/glycine metabolism.


Conflict of interest statement

Competing Interests: The authors have declared that no competing interest exists.

Figures

Figure 1
Figure 1
Deciphering the oncofetal features of liver cancer and enriching them with abundant RNA-binding proteins. (A) Heatmap demonstrating pair-wise correlations among epithelial pseudobulks. The yellow box represented the module formed by the co-clustering of epithelial cells from fetal liver, HB and HCC which denoted similar transcriptional pattern shared among these cells. (B) UMAP layout of all epithelial cells colored by liver phenotype (Left panel) and oncofetal score (Right panel). Oncofetal scores below 95% percent of normal cells were reset as zero. Color scheme of liver phenotype was the same as that in (A). (C) KEGG and gene ontology analysis of 200 oncofetal related genes. (D) The proportion of RBPs and TFs genes among the 200 oncofetal related genes. (E) Heatmap showing the positive correlation between oncofetal scores and cell developmental potential in the individual HCC samples with higher abundance of fetal-like cells. (F) UMAP layout and cell differentiation trajectory inferred for SC14_HCC_058 displaying the substantial agreement between cells with higher oncofetal scores and originating cells characterized by higher CytoTRACE scores and earlier pseudotime. (G) Correlation between oncofetal scores and clinicopathological variables in HCC samples of GepLiver bulk meta-cohort. Linear regression was performed for each parameter with dataset included as covariate. Lines represented 95% confidence intervals. (H) Kaplan-Meier plots demonstrating the association between oncofetal score and worse survival outcome in TCGA-LIHC (Left panel) and Fudan-HCC cohort (Right panel). Optimal cutpoint defined by the surv_cutpoint function of the survminer R package to delineate the most significant survival relationships for the oncofetal score was employed. For the TCGA-HCC cohort, the cut-off value was set at 1.04, defining the top 24% of HCCs as oncofetal high tumor group (n = 87) and 76% as low group (n = 273). For the Fudan-HCC cohort, the cut-off value was set at 1.87, defining the top 11% of HCCs as oncofetal high tumor group (n = 11) and 89% as low group (n = 87). *P<0.05, ***P < 0.001.
Figure 2
Figure 2
TRIM71 serves as a liver cancer specific oncogene with oncofetal phenotype. (A) The expression pattern of oncofetal signature consisting of 200 genes in GepLiver bulk meta-cohort. For each liver phenotype, bulk tissues were downsampled to 50 for optimal figure clarity. Top 15 features most elevated in fetal-like cells versus not group were marked in the heatmap. (B) Core oncofetal genes filtered by the associations of gene expression with both proliferative dependency score (y axis) and oncofetal score (x axis) in liver cancer cell lines. RBPs favoring the oncofetal phenotype as well as essential in liver cancer cell lines were shown as triangles with gene name annotated aside. (C) Scatterplot showing the relationship between TRIM71 expression and proliferative dependency scores in CCLE pan-cancer cell lines. Black dashed lines represented the TRIM71 TPM value as 1 and cell dependency score as -0.4. Liver cancer cell lines with TRIM71 TPM > 1 and dependency score < -0.4 were colored red and annotated aside. (D) Pie chart demonstrated the lineage distribution of top 10 cell lines with highest TRIM71 expression and proliferative dependency scores, suggesting TRIM71 is specifically vital for liver cancer proliferation. (E) Cell differentiation trajectory of SC14_HCC_058 colored by TRIM71 expression presenting the marked overlap between TRIM71-expressing cells and originating cells. (F) TRIM71 expression among liver phenotypes in GepLiver bulk meta-cohort. (G-H) TRIM71 expression grouped by tumor grade (G) and tumor stage (H) in TCGA-LIHC cohort. (I-J) TRIM71 expression grouped by tumor grade (I) and tumor stage (J) in Fudan-HCC cohort. (K-L) Kaplan-Meier survival curve showing TRIM71 as a prognostic factor associated with worse overall survival in TCGA-LIHC cohort (K) and Fudan-HCC cohort (L). Significance was determined with log-rank test. For box plots in (F-J), center line represents the median whereas limits show upper and lower quartiles. Data extend beyond the 1.5 times of the interquartile range from box limits were shown as outlier points. ***P < 0.001.
Figure 3
Figure 3
TRIM71 drives liver cancer initiation and progression. (A) Effects of TRIM71 knockdown on cell proliferation in HuH-7, HuH-6, Hep3B and HepG2 cells infected with sgTRIM71 specific gRNAs and Cas9 lentiviruses and determined by cell-counting kit 8 (CCK-8) assay. (B) Colony formation assays of HuH-7, HuH-6, Hep3B, HepG2 and HCCLM3 cells infected with sgTRIM71 specific gRNAs and Cas9 lentiviruses. (C) Images of the xenograft mouse models implanted with HuH-7 cells with or without TRIM71 knockdown infected with sgTRIM71 specific gRNAs and Cas9 lentiviruses. (D-E) Effects of TRIM71 knockdown on the tumor weight (D) and tumor volume (E) of HuH-7 xenograft tumors. (F) The experimental scheme for the generation of liver tumor mouse models using hydrodynamic tail-vein injection technology. (G) Representative images of tumors dissected from pT3-empty and pT3-TRIM71 liver tumor mouse models. (H) Liver weight, tumor number and greatest tumor diameter in pT3-empty and pT3-TRIM71 liver tumor mouse models. (I) Representative images of tumors dissected from YAP5SA and TRIM71 + YAP5SA liver tumor mouse models. (J) Liver weight, tumor number and greatest tumor diameter of YAP5SA and TRIM71 + YAP5SA liver tumor mouse models. (K) The HE staining in TRIM71 and TRIM71 + YAP5SA liver tumor mouse models. (L) Immunohistochemistry staining showing Afp, Cd34 and Ki67 protein expression in tumor tissues of TRIM71 and TRIM71 + YAP5SA liver tumor mouse models. Values represent the mean ± SEM. *P<0.05, **P < 0.01, ***P < 0.001.
Figure 4
Figure 4
TRIM71 controls metabolic pathways and CEBPA mRNA levels. (A) KEGG pathway enrichment analysis of differentially expressed genes in HuH-7 cells transfected with siNC or siRNAs targeting TRIM71 (Left). GSEA showing down-regulated pathways after TRIM71 knockdown including glycine/serine/threonine metabolism pathway and arginine and proline metabolism (Right). (B) Pie chart showing transcript types binding to TRIM71 by RIP-seq analysis of HuH-7 cells. (C) Venn diagram showing the overlap between the differentially expressed transcripts in TRIM71-KD cells and transcripts bound by TRIM71. (D) RIP-qPCR analysis showing the dramatic enrichment of TRIM71 on CEBPA mRNA. (E) The binding peaks of TRIM71 on CEBPA mRNA in HuH-7 cells. (F) The CEBPA mRNA levels in HuH-7 and Hep3B cells transfected with siNC or siTRIM71 siRNAs. (G) Immunoblot analysis of CEBPA protein levels in HuH-7 and Hep3B cells transfected with siNC or siTRIM71 siRNAs. (H) The CEBPA mRNA levels and protein levels in Li-7 cells with infected with control or TRIM71 overexpression lentiviruses. (I) Schematic description of TRIM71 mutants (left). RIP-qPCR analysis showing enrichment of NHL domain of TRIM71 on CEBPA mRNA (right). Values represent the mean ± SEM. **P < 0.01, ***P < 0.001.
Figure 5
Figure 5
TRIM71-IGF2BP1 protein complex stabilizes CEBPA mRNA in a m6A-dependent manner. (A) m6A-RIP-seq data analysis showing the m6A modification signal were presented nearby stop codon region of CEBPA mRNA. (B) m6A-RIP-qPCR analysis showing the enrichment of m6A modification signal on CEBPA mRNA in HuH-7 cells transfected with siNC, siMETTL3 or siMETTL14 mixed siRNAs. (C) The CEBPA mRNA levels in HuH-7 and Hep3B cells transfected with siNC, siMETTL3 or siMETTL14 mixed siRNAs. (D) Immunoblot of CEBPA protein levels in HuH-7 and Hep3B cells transfected with siNC, siMETTL3 or siMETTL14 mixed siRNAs. (E) Co-IP assay showing the interaction between TRIM71 and IGF2BP1. (F) Co-IP assay showing the interaction between TRIM71 and IGF2BP1 with or without RNase I treatment in HuH-7 cells. (G) The relative luciferase activity in HuH-7 and Hep3B cells transfected with siNC, siTRIM71 or siIGF2BP1 mixed siRNAs. (H) The CEBPA mRNA levels in HuH-7 cells transfected with siNC or siTRIM71 mixed siRNAs at the indicated time point. (I) Schematic depicting RNA pull-down in HuH-7 cells using oligonucleotides containing with or without m6A modification in adenosine (upper). Immunoblot of TRIM71 and IGF2BP1 protein level in HuH-7 cells transfected with siNC or siIGF2BP1 mixed siRNAs (lower). (J) The CEBPA mRNA levels in HuH-7 and Hep3B cells transfected with siNC or siIGF2BP1 mixed siRNAs. (K) Immunoblot of CEBPA protein level in HuH-7 and Hep3B cells transfected with siNC or siIGF2BP1 mixed siRNAs. Values represent the mean ± SEM. *P<0.05, **P < 0.01, ***P < 0.001.
Figure 6
Figure 6
“TRIM71-CEBPA” axis controls serine and glycine biosynthesis in liver cancer cells. (A) Schematic diagram depicting serine and glycine biosynthesis pathways. (B) GSEA results showing the enrichment of serine/glycine biosynthesis pathway after CEBPA knockdown. (C) The binding peaks of CEBPA in PSPH and PSAT1 promoter regions. (D) The PSPH mRNA levels in HuH-7 and Hep3B cells transfected with siNC or siTRIM71 mixed siRNAs. (E) Immunoblot analysis of PSPH protein levels in HuH-7 and Hep3B cells transfected with siNC, siTRIM71 or siCEBPA mixed siRNAs. (F) The Psph and Psat1 mRNA levels in mouse liver cancer tissues of pT3-empty or pT3-TRIM71 models. (G) The Psph and Psat1 mRNA levels in mouse liver cancer tissues of YAP5SA or YAP5SA + TRIM71 models. (H) Immunoblot showing the Psph and Psat1 protein levels in mouse liver cancer tissues of pT3-empty or pT3-TRIM71 models. (I) Immunoblot showing the Psph and Psat1 protein levels in mouse liver cancer tissues of YAP5SA or YAP5SA + TRIM71 models. (J) The intracellular serine and glycine levels in HuH-7 and Hep3B cells transfected with siNC, siTRIM71 or siCEBPA mixed siRNAs. (K) Representative images of tumors dissected from liver tumor mouse models of pT3-TRIM71 or pT3-TRIM71combined with knocking down of Psph. (L) Tumor number and greatest tumor diameter in liver tumor mouse models of pT3-TRIM71 or pT3-TRIM71 combined with knocking down of Psph. (M) Representative images of tumors dissected from liver tumor mouse models of TRIM71 + YAP5SA or TRIM71 + YAP5SA combined with knocking down of Psph. (N) Tumor number and greatest tumor diameter in liver tumor mouse models of TRIM71 + YAP5SA or TRIM71 + YAP5SA combined with knocking down of Psph. Values represent the mean ± SEM. **P < 0.01, ***P < 0.001.
Figure 7
Figure 7
ATRA combined with A-485 hamper serine and glycine biosynthesis in TRIM71/CEBPA high-expressed liver cancer cells. (A) The ChIP-seq peaks of RXRA, EP300, H3K4me1, H3K4me3 and H3k27Ac in TRIM71 promoter regions of HuH-7 cells. (B) Top enriched KEGG pathway analysis of differentially expressed genes in HuH-7 cells treated with DMSO or A-485. (C) GSEA analysis displaying down-regulated pathways including Glycine/Serine/Threonine metabolism in HuH-7 cells treated with A-485. (D-E) The colony formation assay in HuH-7 (D) and HuH-6 (E) cells treated with DMSO, ATRA (2 μM/L), A-485 (1 μM/L), ATRA (2 μM/L) + A-485 (1 μM/L). (F) Images of the xenograft mouse models implanted with HuH-6 cells and treated with saline, ATRA (20 mg/kg), A-485 (10 mg/kg), ATRA (20 mg/kg) + A-485 (10 mg/kg). (G-H) Effects of saline, ATRA, A-485, ATRA + A-485 on the tumor weight (G) and tumor volume (H) of HuH-6 xenograft tumors. (I) Images of liver tumor mouse models (YAP5SA + TRIM71) using hydrodynamic tail-vein injection and treated with saline or ATRA (20 mg/kg) + A-485 (10 mg/kg). (J) Liver weight, tumor number and greatest tumor diameter in YAP5SA + TRIM71 liver tumor mouse models treated with saline or ATRA (20 mg/kg) + A-485 (10 mg/kg). (K) Survival curve of YAP5SA + TRIM71 liver tumor mouse models treated with saline or ATRA (20 mg/kg) + A-485 (10 mg/kg). Values represent the mean ± SEM. ns: no significance. *P<0.05, ***P < 0.001.
Figure 8
Figure 8
The working model of TRIM71 in manipulating liver cancer initiation and progression. In normal liver, the transcription of TRIM71 is inhibited, which accompanied by the low CEBPA mRNA levels and high CDKN1A mRNA levels. CDKN1A translates abundant p21 proteins and glycine/serine metabolism is inhibited, resulted in restricted cell growth (Left). In liver cancer, TRIM71 is specifically and highly expressed, and established the oncofetal ecosystem. TRIM71 degradates CDKN1A mRNA to decrease p21 protein. More importantly, TRIM71 forms protein complex with IGF2BP1, which binds to and stabilize CEBPA mRNA levels through m6A dependent manner. High expression of CEBPA remodels glycine/serine metabolism through enhancing PSPH/PSAT1 transcription, and ultimately promotes liver cancer growth and tumorigenicity. Targeting inhibition of TRIM71 using ATRA combined with A-485 may offer potentially therapeutic strategies for liver cancer patients with high TRIM71 levels (Right).

Similar articles

Cited by

References

    1. Hanahan D. Hallmarks of cancer: New dimensions. Cancer Discov. 2022;12:31–46. - PubMed
    1. Cancer Genome Atlas Research Network. Electronic address wbe, Cancer Genome Atlas Research N. Comprehensive and integrative genomic characterization of hepatocellular carcinoma. Cell. 2017;169:1327–41. e23. - PMC - PubMed
    1. Juhling F, Hamdane N, Crouchet E, Li S, El Saghire H, Mukherji A. et al. Targeting clinical epigenetic reprogramming for chemoprevention of metabolic and viral hepatocellular carcinoma. Gut. 2021;70:157–69. - PMC - PubMed
    1. Sharma A, Seow JJW, Dutertre CA, Pai R, Bleriot C, Mishra A. et al. Onco-fetal reprogramming of endothelial cells drives immunosuppressive macrophages in hepatocellular carcinoma. Cell. 2020;183:377–94. e21. - PubMed
    1. Liu M, Yan Q, Sun Y, Nam Y, Hu L, Loong JH. et al. A hepatocyte differentiation model reveals two subtypes of liver cancer with different oncofetal properties and therapeutic targets. Proc Natl Acad Sci U S A. 2020;117:6103–13. - PMC - PubMed

Publication types

MeSH terms