

Non-invasive ultrasound localization microscopy (ULM) in azoospermia: connecting testicular microcirculation to spermatogenic functions
- PMID: 39267788
- PMCID: PMC11388075
- DOI: 10.7150/thno.99668
Non-invasive ultrasound localization microscopy (ULM) in azoospermia: connecting testicular microcirculation to spermatogenic functions
Abstract
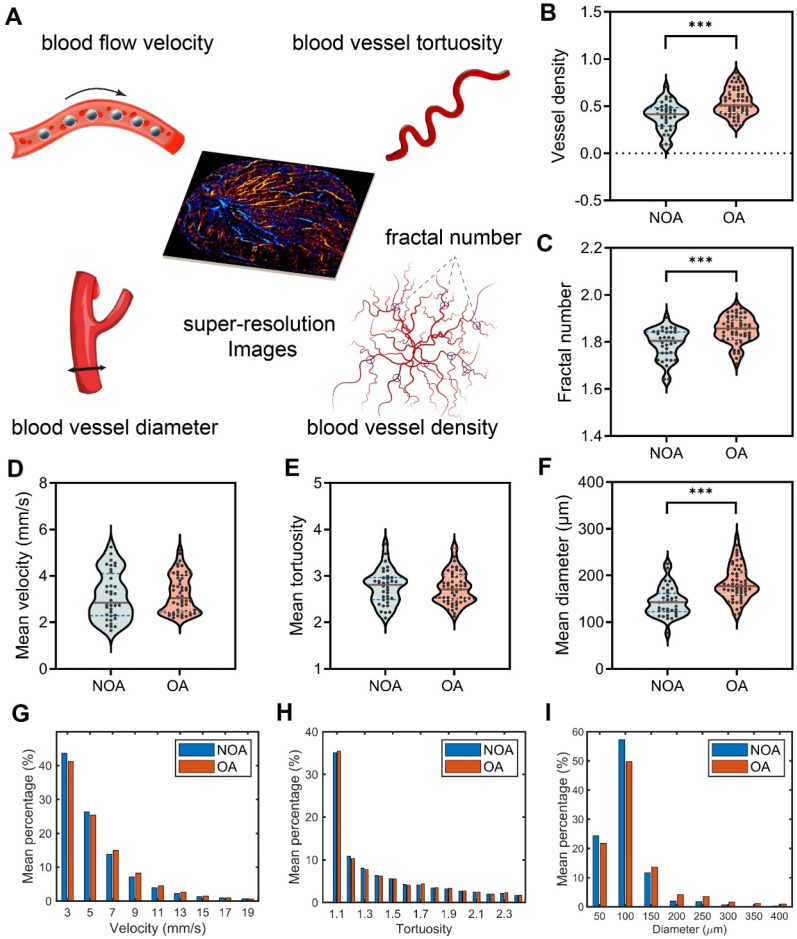
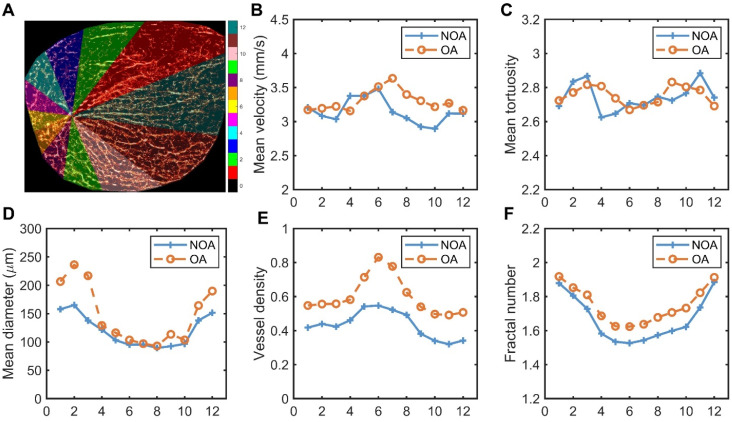
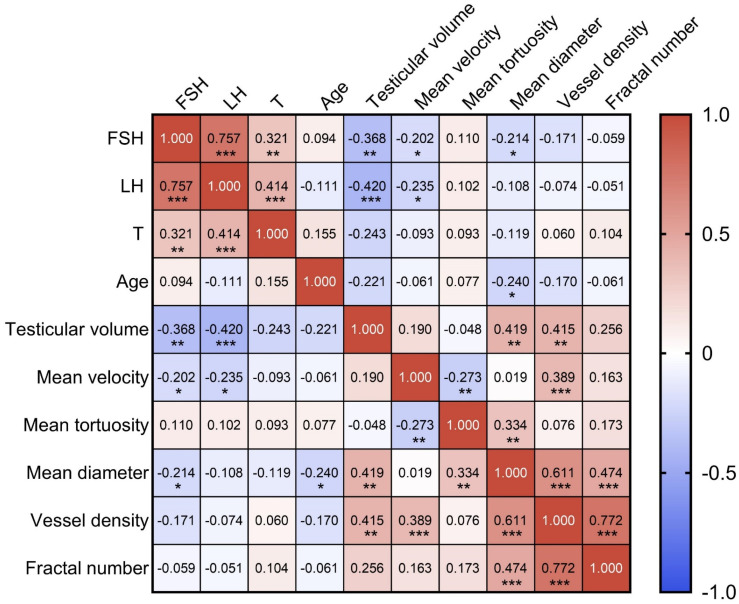
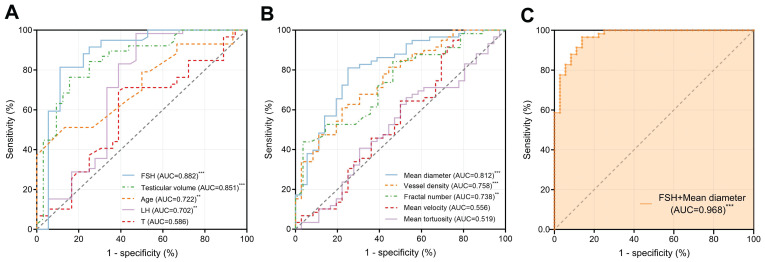
Rationale: Azoospermia is a significant reproductive challenge. Differentiating between non-obstructive azoospermia (NOA) and obstructive azoospermia (OA) is crucial as each type requires distinct management strategies. Testicular microcirculation plays a profound role in spermatogenic functions. However, current diagnostic methods are limited in their ability to effectively elucidate this crucial connection. Methods: We employed ultrasound localization microscopy (ULM) to visualize testicular microcirculation in NOA and OA patients and quantified the testicular hemodynamic parameters. Pearson correlation analysis was conducted to investigate the inner connection between parameters of testicular microcirculation and clinical spermatogenic functions. We conducted multiple logistic regression analysis to establish a new diagnostic model that integrates follicle-stimulating hormone (FSH) and mean vascular diameter to distinguish NOA from OA. Results: Our findings demonstrated significant differences in vascular parameters between NOA and OA, with NOA characterized by lower mean vascular diameter (p < 0.001), vessel density (p < 0.001), and fractal number (p < 0.001). Testicular volume showed a moderate positive correlation with mean vascular diameter (r = 0.419, p < 0.01) and vessel density (r = 0.415, p < 0.01); Mean vascular diameter exhibited negative correlations with both FSH (r = -0.214, p < 0.05) and age (r = -0.240, p < 0.05); FSH (r = -0.202, p < 0.05) and luteinizing hormone (LH) (r = -0.235, p < 0.05) were negatively correlated with mean blood flow velocity. The diagnostic model demonstrated an area under the curve (AUC) of 0.968. We also reported a method to map the vascular pressure distribution derived from the blood flow velocity generated by ULM. Conclusions: ULM provides a non-invasive and detailed assessment of testicular microvascular dynamics. The ULM-derived vascular parameters are able to connect testicular microcirculation to spermatogenic functions. The combination of FSH and mean vascular diameter enhances diagnostic precision and holds potential for distinguishing NOA from OA.
Keywords: azoospermia; pressure distribution maps; spermatogenic functions; testicular microcirculation; ultrasound localization microscopy (ULM).
© The author(s).
Conflict of interest statement
Competing Interests: The authors have declared that no competing interest exists.
Figures
Similar articles
-
Ultrasonographic caput epididymis diameter is reduced in non-obstructive azoospermia compared with normozoospermia but is not predictive for successful sperm retrieval after TESE.Hum Reprod. 2014 Jul;29(7):1368-74. doi: 10.1093/humrep/deu092. Epub 2014 May 7. Hum Reprod. 2014. PMID: 24812316
-
[Serum anti-Müllerian hormone level for differential diagnosis of obstructive and non-obstructive azoospermia].Zhonghua Nan Ke Xue. 2019 Sep;25(9):823-827. Zhonghua Nan Ke Xue. 2019. PMID: 32233210 Chinese.
-
Over-expression of hsa_circ_0000116 in patients with non-obstructive azoospermia and its predictive value in testicular sperm retrieval.Andrology. 2020 Nov;8(6):1834-1843. doi: 10.1111/andr.12874. Epub 2020 Aug 28. Andrology. 2020. PMID: 32735753
-
The role of ultrasound in assessment of male fertility.Eur J Obstet Gynecol Reprod Biol. 2009 May;144 Suppl 1:S192-8. doi: 10.1016/j.ejogrb.2009.02.034. Epub 2009 Mar 20. Eur J Obstet Gynecol Reprod Biol. 2009. PMID: 19303691 Review.
-
Are hormone measurements and ultrasounds really predictors of sperm retrieval in testicular sperm extraction? A case report and literature review.Andrologia. 2018 Sep;50(7):e13022. doi: 10.1111/and.13022. Epub 2018 Apr 23. Andrologia. 2018. PMID: 29687503 Review.
Cited by
-
Predicting Semen Analysis Parameters from Testicular Ultrasonography Images Using Deep Learning Algorithms: An Innovative Approach to Male Infertility Diagnosis.J Clin Med. 2025 Jan 15;14(2):516. doi: 10.3390/jcm14020516. J Clin Med. 2025. PMID: 39860522 Free PMC article.
-
Large-scale super-resolution optoacoustic imaging facilitated by FeNP/ICG-loaded coreless polyelectrolyte microcapsules.Theranostics. 2025 May 25;15(13):6412-6427. doi: 10.7150/thno.112050. eCollection 2025. Theranostics. 2025. PMID: 40521194 Free PMC article.
-
Hyperbaric oxygen therapy for male infertility: a systematic review and meta-analysis on improving sperm quality and fertility outcomes.Med Gas Res. 2025 Dec 1;15(4):529-534. doi: 10.4103/mgr.MEDGASRES-D-24-00153. Epub 2025 Apr 29. Med Gas Res. 2025. PMID: 40300888 Free PMC article.
-
Analysing the Renal Vasculature Using Super-Resolution Ultrasound Imaging: Considerations for Clinical and Research Applications.Diagnostics (Basel). 2025 Jun 14;15(12):1515. doi: 10.3390/diagnostics15121515. Diagnostics (Basel). 2025. PMID: 40564835 Free PMC article.
References
-
- Takeshima T, Karibe J, Saito T, Kuroda S, Komeya M, Uemura H. et al. Clinical management of nonobstructive azoospermia: An update. Int J Urol. 2024;31:17–24. - PubMed
-
- Minhas S, Bettocchi C, Boeri L, Capogrosso P, Carvalho J, Cilesiz NC. et al. European Association of Urology Guidelines on Male Sexual and Reproductive Health: 2021 Update on Male Infertility. Eur Urol. 2021;80:603–20. - PubMed
-
- Practice Committee of American Society for Reproductive M. Multiple gestation associated with infertility therapy: an American Society for Reproductive Medicine Practice Committee opinion. Fertil Steril. 2012;97:825–34. - PubMed
-
- Esteves SC, Miyaoka R, Agarwal A. Sperm retrieval techniques for assisted reproduction. Int Braz J Urol. 2011;37:570–83. - PubMed
Publication types
MeSH terms
Substances
Supplementary concepts
LinkOut - more resources
Full Text Sources
