. 2024 Jul;17(4):2430001.
doi: 10.1142/s1793545824300015. Epub 2024 Feb 24.

Spatial Sensitivity to Absorption Changes for Various Near-Infrared Spectroscopy Methods: A Compendium Review

Affiliations

Spatial Sensitivity to Absorption Changes for Various Near-Infrared Spectroscopy Methods: A Compendium Review

Giles Blaney et al. J Innov Opt Health Sci. 2024 Jul.

Abstract

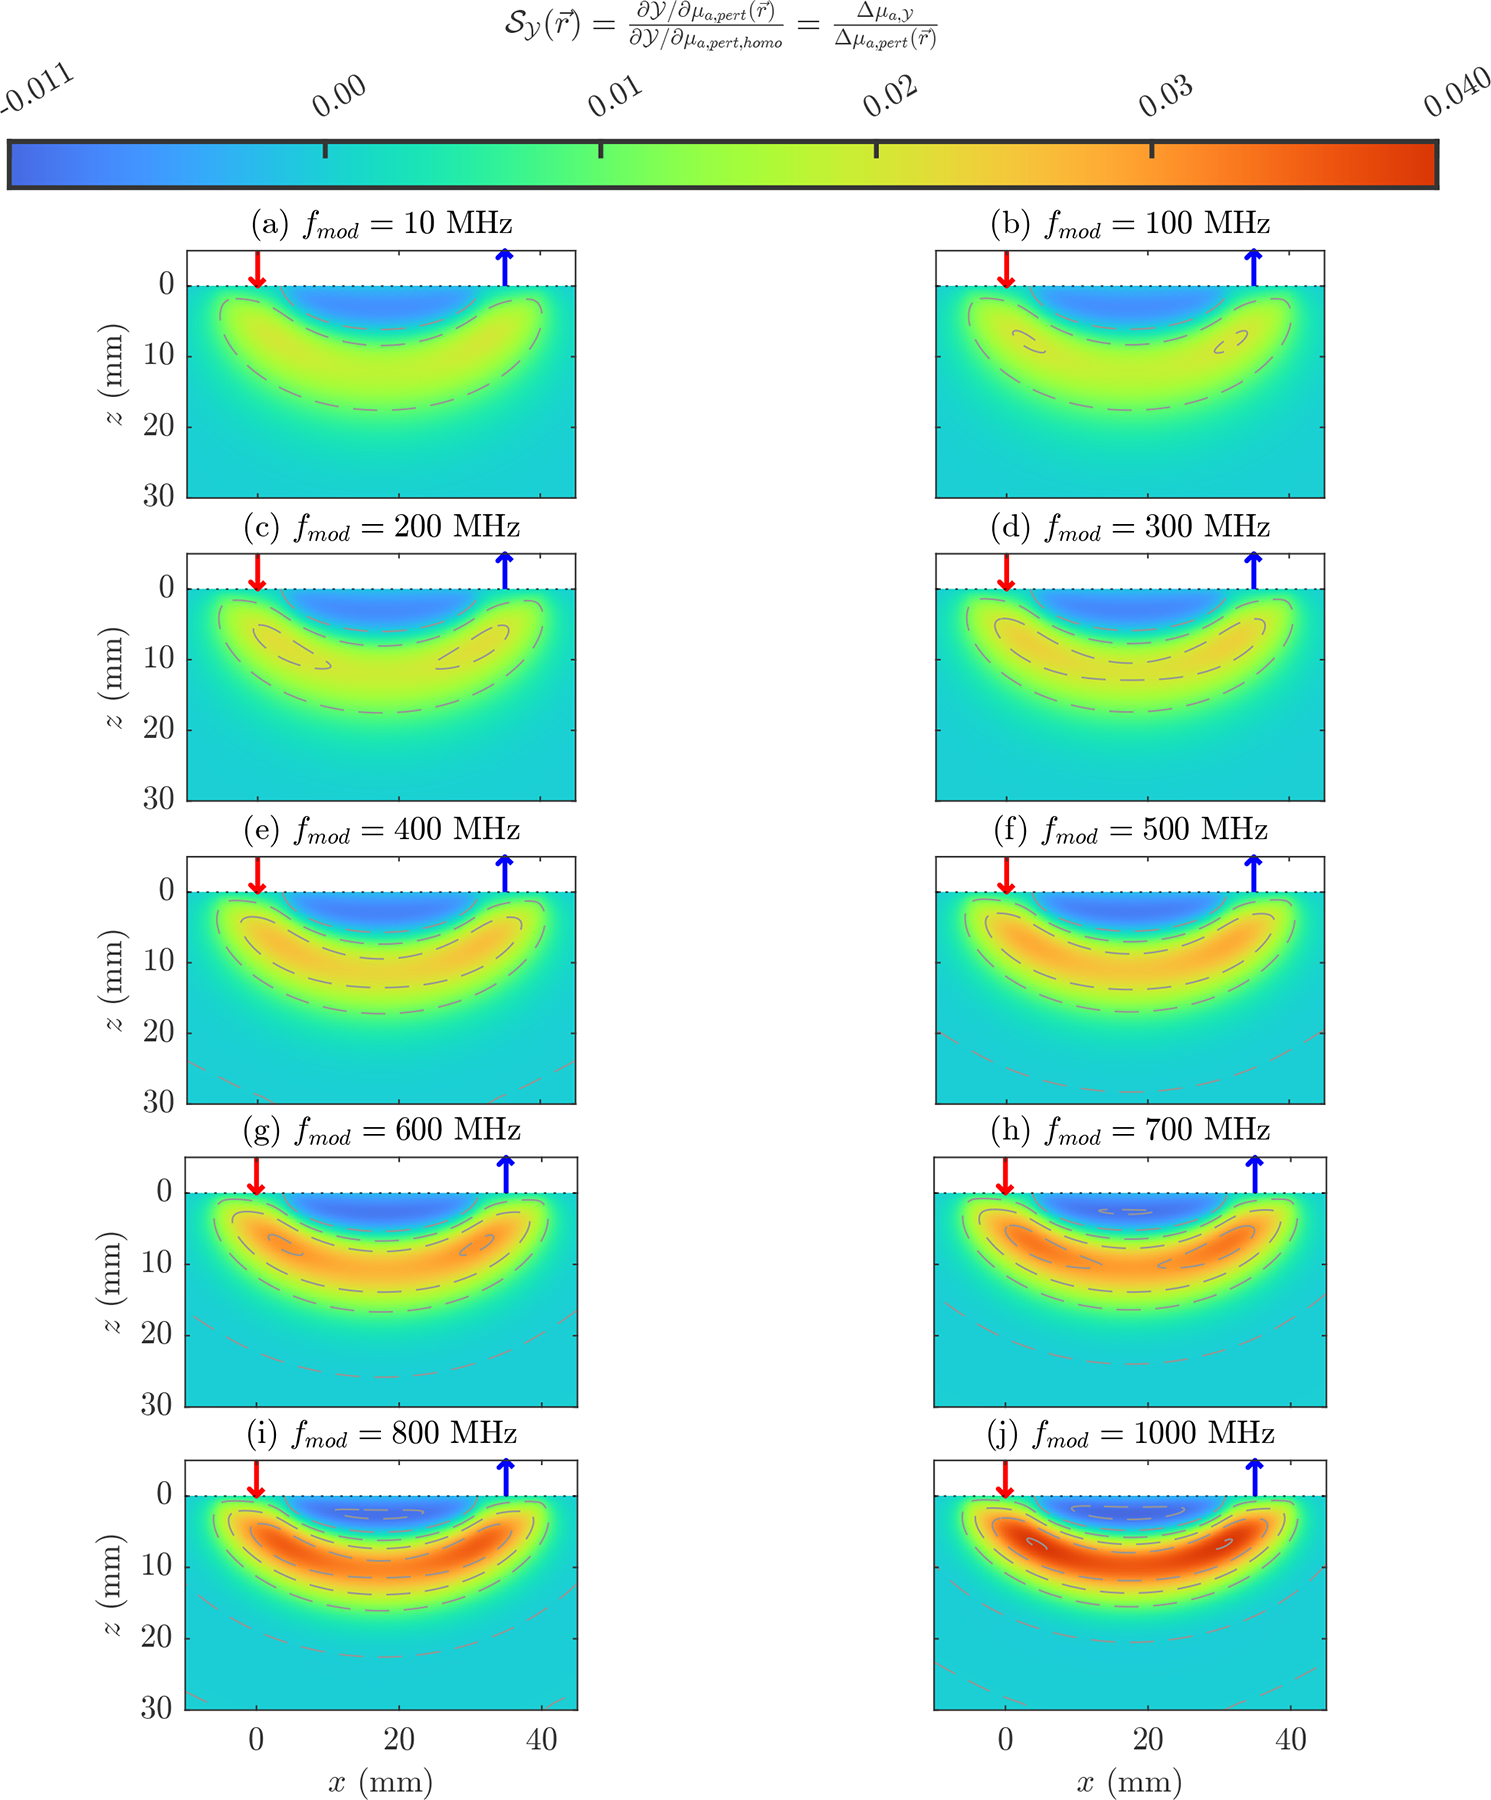
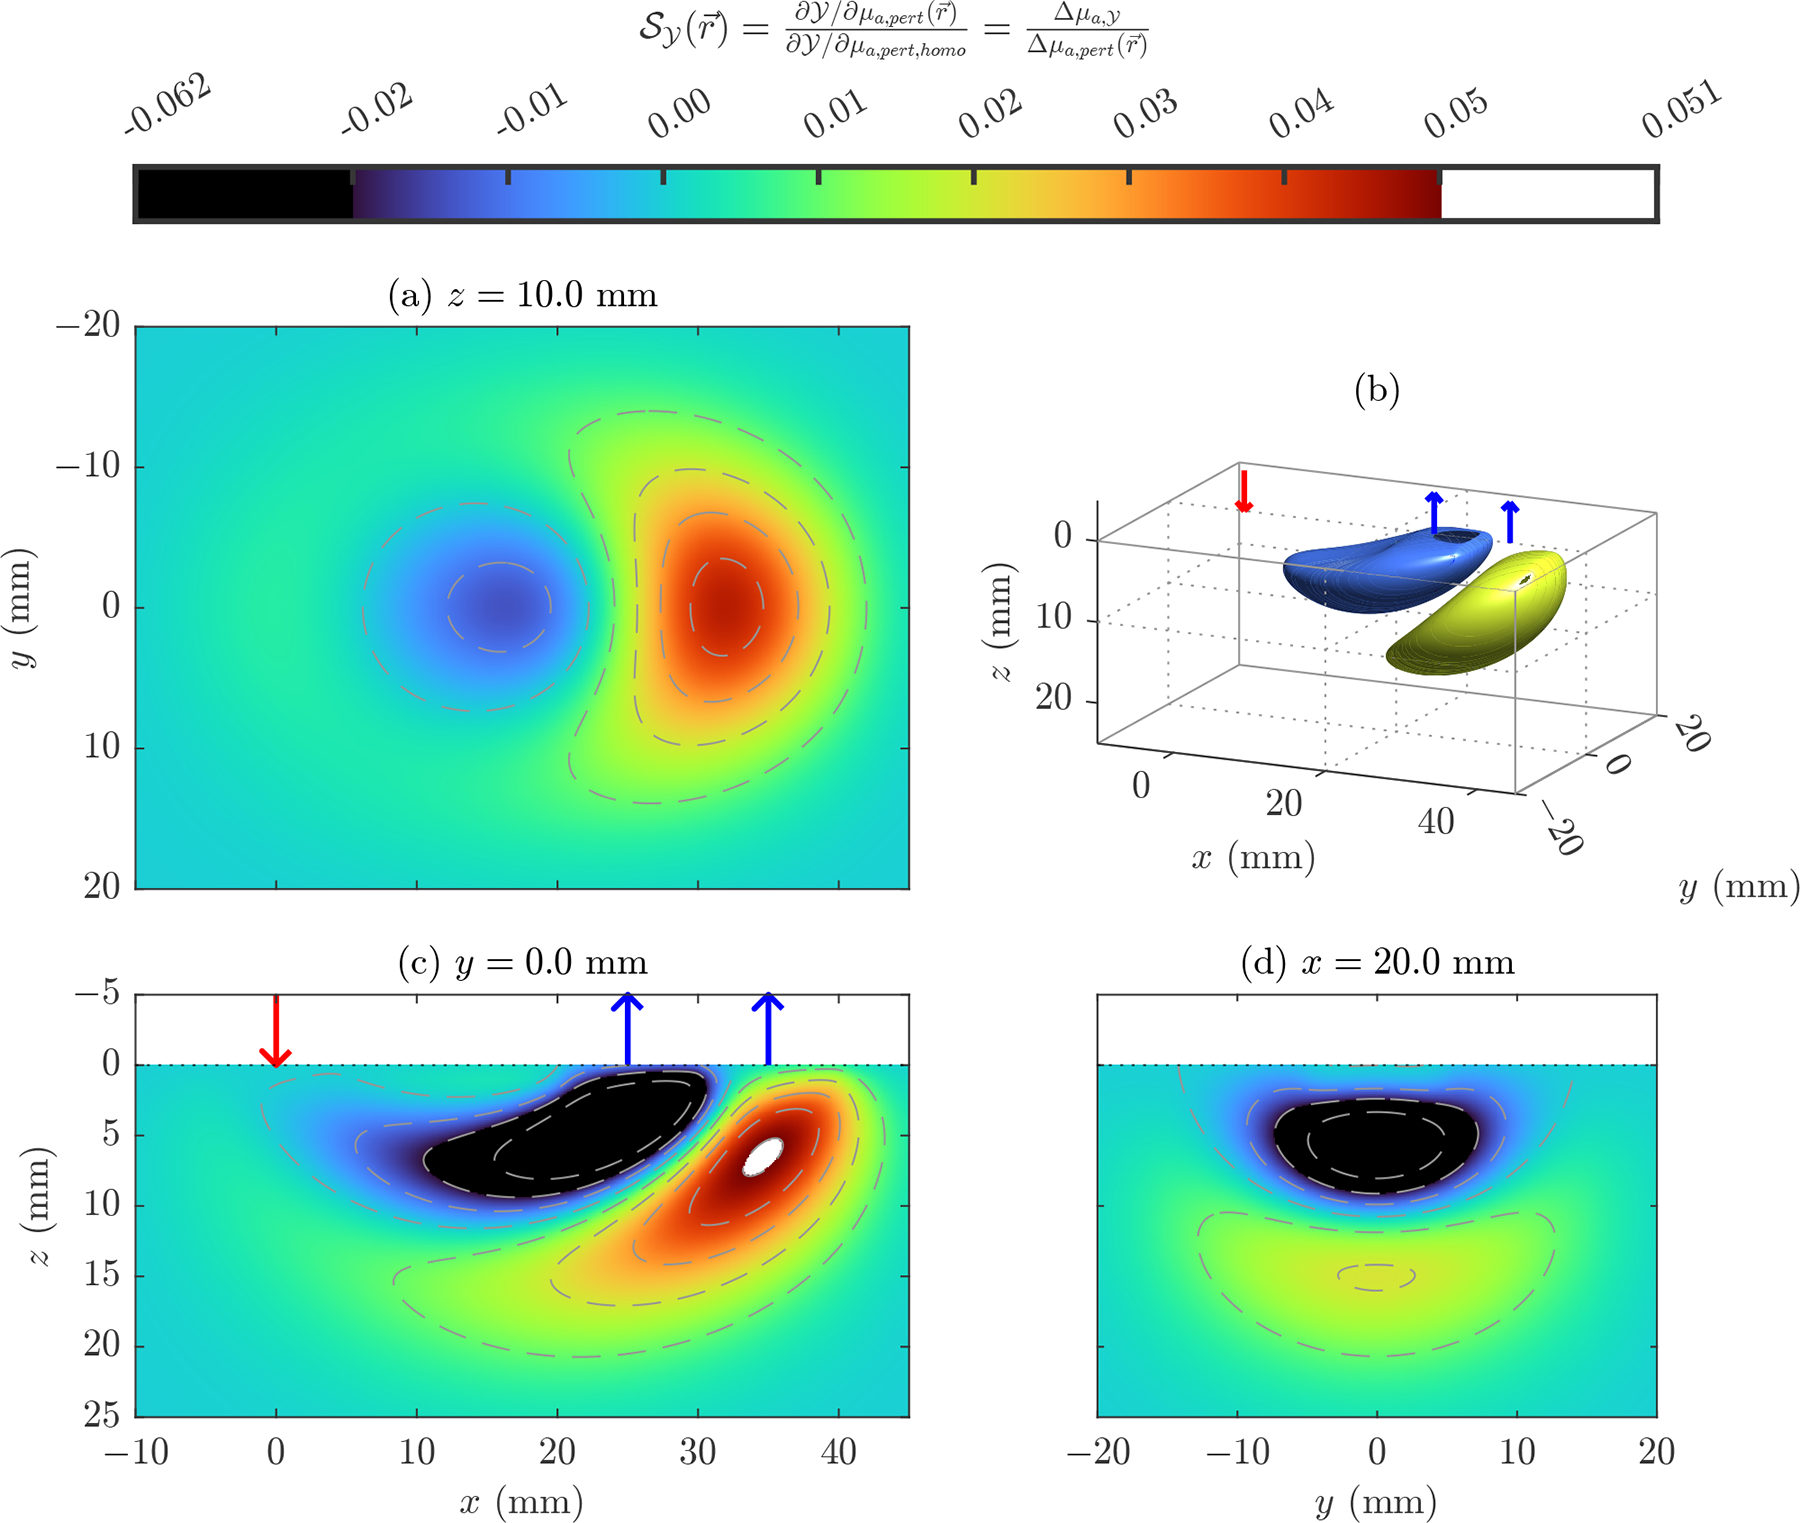
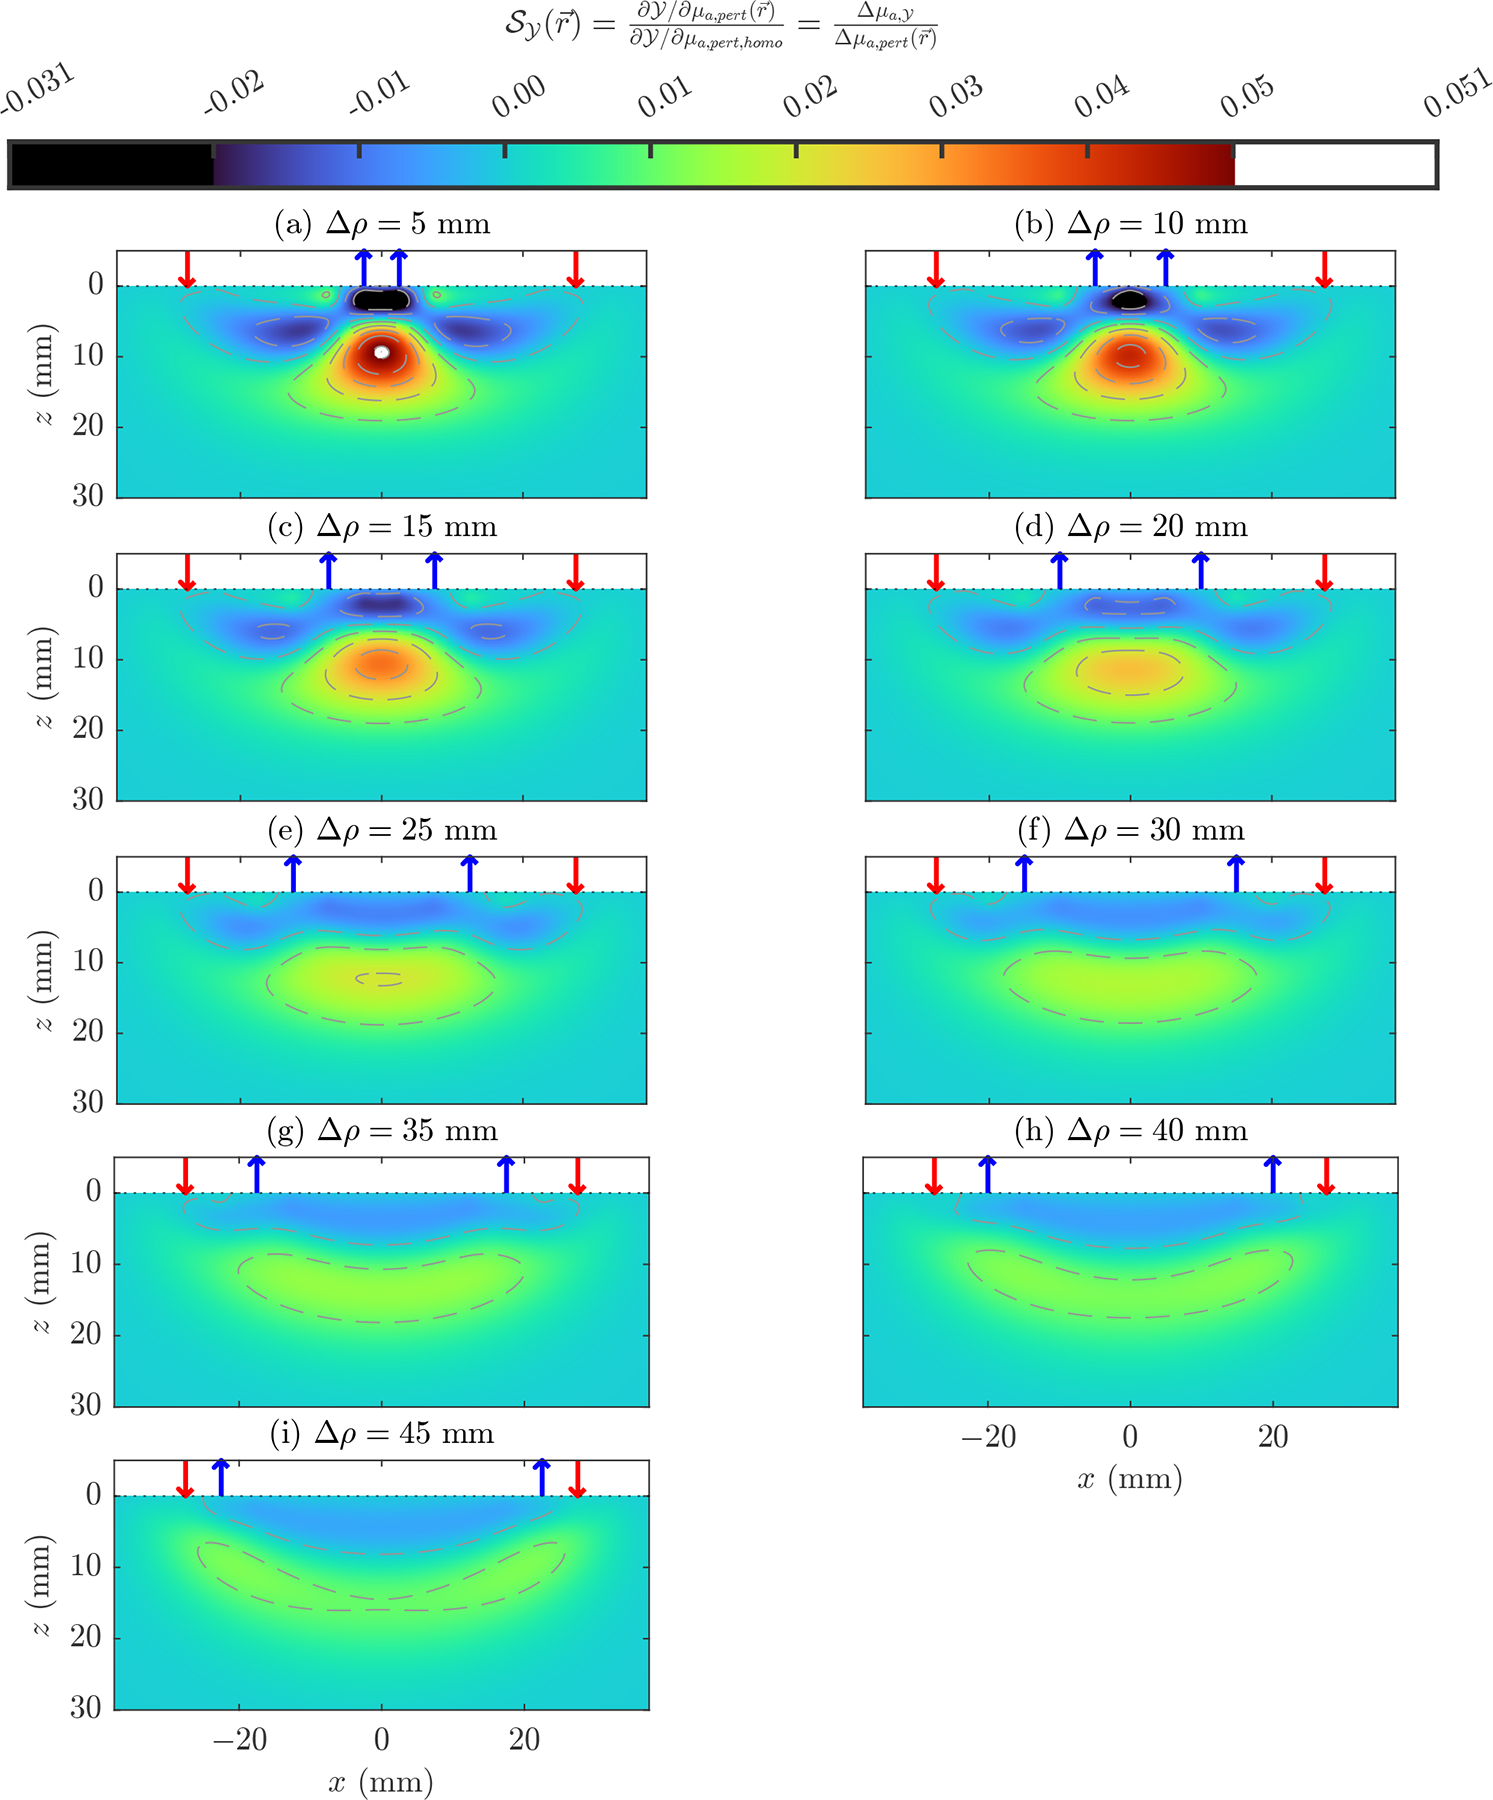
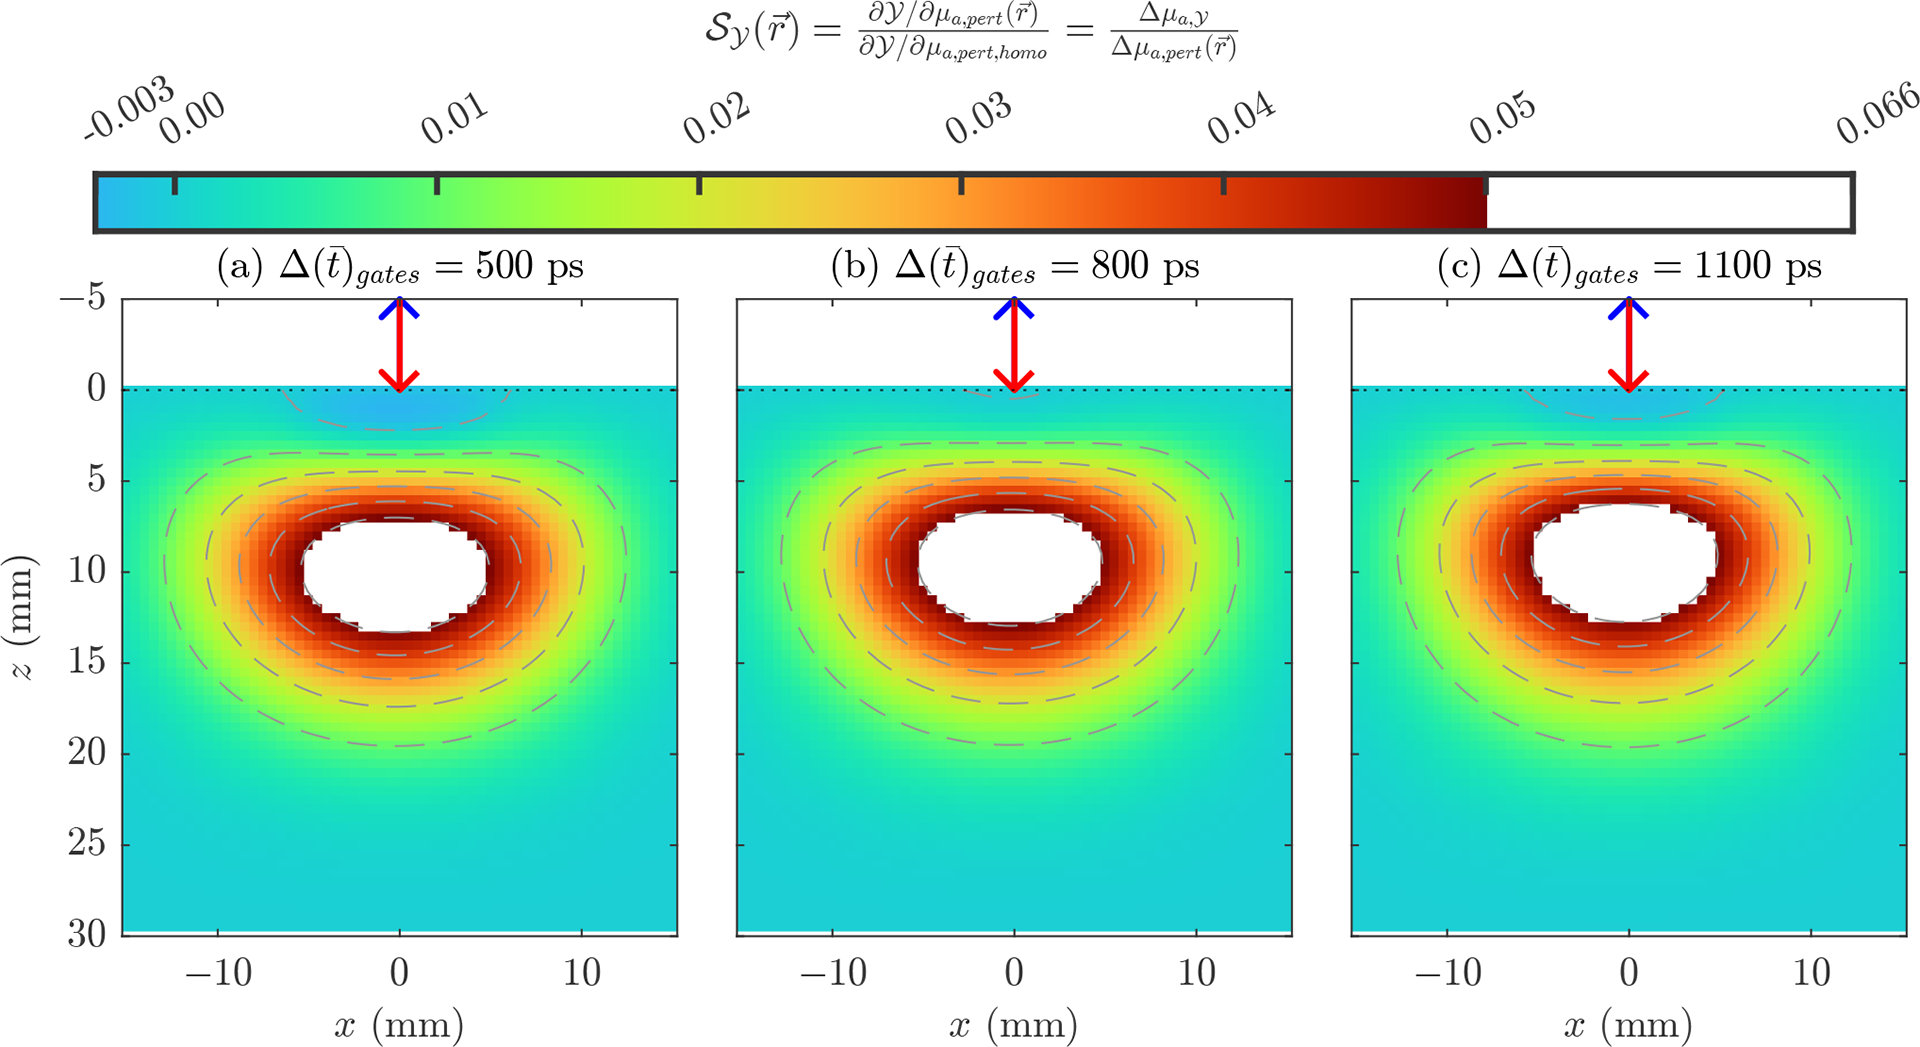
This compendium review focuses on the spatial distribution of sensitivity to localized absorption changes in optically diffuse media, particularly for measurements relevant to near-infrared spectroscopy. The three temporal domains, continuous-wave, frequency-domain, and time-domain, each obtain different optical data-types whose changes may be related to effective homogeneous changes in the absorption coefficient. Sensitivity is the relationship between a localized perturbation and the recovered effective homogeneous absorption change. Therefore, spatial sensitivity maps representing the perturbation location can be generated for the numerous optical data-types in the three temporal domains. The review first presents a history of the past 30 years of work investigating this sensitivity in optically diffuse media. These works are experimental and theoretical, presenting 1-, 2-, and 3-dimensional sensitivity maps for different near-infrared spectroscopy methods, domains, and data-types. Following this history, we present a compendium of sensitivity maps organized by temporal domain and then data-type. This compendium provides a valuable tool to compare the spatial sensitivity of various measurement methods and parameters in one document. Methods for one to generate these maps are provided in the appendix, including code. This historical review and comprehensive sensitivity map compendium provides a single source researchers may use to visualize, investigate, compare, and generate sensitivity to localized absorption change maps.


Conflict of interest statement

Conflicts of Interest The authors declare no conflicts of interest.

Figures

Figure 1:
Figure 1:
Third angle projection of the Sensitivity to local absorption change (𝒮) to a 0.1 mm × 0.1 mm × 0.1 mm perturbation scanned 0.1 mm measured by Continuous-Wave (CW) Single-Distance (SD) Intensity (I). (a) x-y plane sliced at z=1.0mm. (b) Iso-surface sliced at S=3.000×10⁻⁵. (c) x-z plane sliced at y=0.0mm. (d) y-z plane sliced at x=0.0mm. Generated using Monte Carlo (MC). Source-detector distance (ρ):0.0mm Index of refraction (n) inside: 1.333; Index of refraction (n) outside: 1.000 Reduced scattering coefficient μs:1.10mm-1; Scattering anisotropy (g): 0.9 Absorption coefficient μa:0.011mm-1 Detector Numerical Aperature (NA): 0.5; Number of photons: 109
Figure 2:
Figure 2:
Third angle projection of the Sensitivity to local absorption change (𝒮) to a 10.0 mm × 10.0 mm × 2.0 mm perturbation scanned 0.1 mm measured by Continuous-Wave (CW) Single-Distance (SD) Intensity (I). (a) x-y plane sliced at z=2.0mm. (b) Iso-surface sliced at S=0.020. (c) x-z plane sliced at =0.0mm. (d) y-z plane sliced at x=0.0mm. Generated using Monte Carlo (MC). Source-detector distance (ρ):0.0mm Index of refraction (n) inside: 1.333; Index of refraction (n) outside: 1.000 Reduced scattering coefficient μs:1.10mm-1; Scattering anisotropy (g):0.9 Absorption coefficient μa:0.011mm-1 Detector Numerical Aperature (NA): 0.5; Number of photons: 109
Figure 3:
Figure 3:
Third angle projection of the Sensitivity to local absorption change (𝒮) to a 10.0 mm × 10.0 mm × 2.0 mm perturbation scanned 0.1 mm measured by Continuous-Wave (CW) Single-Distance (SD) Intensity (I). (a) x-y plane sliced at z=10.0mm. (b) Iso-surface sliced at S=0.020. (c) x-z plane sliced at y=0.0mm. (d) x-z plane sliced at x=17.5mm. Generated using Diffusion Theory (DT). Source-detector distance (ρ):35.0mm Index of refraction (n) inside: 1.333 Index of refraction (n) outside: 1.000 Reduced scattering coefficient μs:1.10mm-1 Absorption coefficient μa:0.011mm-1
Figure 4:
Figure 4:
x-z plane of the Sensitivity to local absorption change (𝒮) to a 10.0 mm × 10.0 mm × 2.0 mm perturbation scanned 0.1 mm measured by Continuous-Wave (CW) Single-Distance (SD) Intensity (I). (a)-(j) Different values of source-detector distance (ρ). Generated using Diffusion Theory (DT). Index of refraction (n) inside: 1.333; Index of refraction (n) outside: 1.000 Reduced scattering coefficient μs:1.10mm-1 Absorption coefficient μa:0.011mm-1
Figure 5:
Figure 5:
Third angle projection of the Sensitivity to local absorption change (𝒮) to a 10.0 mm × 10.0 mm × 2.0 mm perturbation scanned 0.1 mm measured by Continuous-Wave (CW) Single-Slope (SS) Intensity (I).(a) x-y plane sliced at z=10.0mm. (b) Iso-surface sliced at S=0.020 and S=-0.010. (c) x-z plane sliced at y=0.0mm. (d) y-z plane sliced at x=20.0mm. Generated using Diffusion Theory (DT). Source-detector distances (ρs):[25.0,35.0]mm Index of refraction (n) inside: 1.333 Index of refraction (n) outside: 1.000 Reduced scattering coefficient μs:1.10mm-1 Absorption coefficient μa:0.011mm-1
Figure 6:
Figure 6:
Third angle projection of the Sensitivity to local absorption change (𝒮) to a 10.0 mm × 10.0 mm × 2.0 mm perturbation scanned 0.1 mm measured by Continuous-Wave (CW) Dual-Slope (DS) Intensity (I). (a) x-y plane sliced at z=10.0mm. (b) Iso-surface sliced at S=0.020 and S=-0.010. (c) x-z plane sliced at y=0.0mm. (d) y-z plane sliced at x=30.0mm. Generated using Diffusion Theory (DT). Source-detector distances (ρs):[25.0,35.0,35.0,25.0]mm Index of refraction (n) inside: 1.333 Index of refraction (n) outside: 1.000 Reduced scattering coefficient μs:1.10mm-1 Absorption coefficient μa:0.011mm-1
Figure 7:
Figure 7:
x-z plane of the Sensitivity to local absorption change (𝒮) to a 10.0 mm × 10.0 mm × 2.0 mm perturbation scanned 0.1 mm measured by Continuous-Wave (CW) Single-Slope (SS) Intensity (I). (a)-(h) Different values of mean source-detector distance (ρ). Generated using Diffusion Theory (DT). Difference in source-detector distance (Δρ):10.0mm Index of refraction (n) inside: 1.333; Index of refraction (n) outside: 1.000 Reduced scattering coefficient μs:1.10mm-1 Absorption coefficient μa:0.011mm-1
Figure 8:
Figure 8:
x-z plane of the Sensitivity to local absorption change (𝒮) to a 10.0 mm × 10.0 mm × 2.0 mm perturbation scanned 0.1 mm measured by Continuous-Wave (CW) Dual-Slope (DS) Intensity (I). (a)-(h) Different values of mean source-detector distance (ρ). Generated using Diffusion Theory (DT). Difference in source-detector distance (Δρ):10.0mm Index of refraction (n) inside: 1.333; Index of refraction (n) outside: 1.000 Reduced scattering coefficient μs:1.10mm-1 Absorption coefficient μa:0.011mm-1
Figure 9:
Figure 9:
x-z plane of the Sensitivity to local absorption change (𝒮) to a 10.0 mm × 10.0 mm × 2.0 mm perturbation scanned 0.1 mm measured by Continuous-Wave (CW) Single-Slope (SS) Intensity (I). (a)-(i) Different values of difference in source-detector distance (Δρ). Generated using Diffusion Theory (DT). Mean source-detector distance (ρ):27.5mm Index of refraction (n) inside: 1.333; Index of refraction (n) outside: 1.000 Reduced scattering coefficient μs:1.10mm-1 Absorption coefficient μa:0.011mm-1
Figure 10:
Figure 10:
x-z plane of the Sensitivity to local absorption change (𝒮) to a 10.0 mm × 10.0 mm × 2.0 mm perturbation scanned 0.1 mm measured by Continuous-Wave (CW) Dual-Slope (DS) Intensity (I). (a)-(i) Different values of difference in source-detector distance (Δρ). Generated using Diffusion Theory (DT). Mean source-detector distance (ρ):27.5mm Index of refraction (n) inside: 1.333; Index of refraction (n) outside: 1.000 Reduced scattering coefficient μs:1.10mm-1 Absorption coefficient μa:0.011mm-1
Figure 11:
Figure 11:
Third angle projection of the Sensitivity to local absorption change (𝒮) to a 10.0 mm × 10.0 mm × 2.0 mm perturbation scanned 0.1 mm measured by Frequency-Domain (FD) Single-Distance (SD) Intensity (I). (a) x-y plane sliced at z=10.0mm. (b) Iso-surface sliced at S=0.020. (c) x-z plane sliced at y=0.0mm. (d) y-z plane sliced at x=17.5mm. Generated using Diffusion Theory (DT). Source-detector distance (ρ):35.0mm Index of refraction (n) inside: 1.333 Index of refraction (n) outside: 1.000 Reduced scattering coefficient μs:1.10mm-1 Absorption coefficient μa:0.011mm-1 Modulation frequency fmod:100MHz
Figure 12:
Figure 12:
x-z plane of the Sensitivity to local absorption change (𝒮) to a 10.0 mm × 10.0 mm × 2.0 mm perturbation scanned 0.1 mm measured by Frequency-Domain (FD) Single-Distance (SD) Intensity (I). (a)-(j) Different values of modulation frequency fmod. Generated using Diffusion Theory (DT). Source-detector distance (ρ):35.0mm Index of refraction (n) inside: 1.333; Index of refraction (n) outside: 1.000 Reduced scattering coefficient μs:1.10mm-1; Absorption coefficient μa:0.011mm-1
Figure 13:
Figure 13:
Third angle projection of the Sensitivity to local absorption change (𝒮) to a 10.0 mm × 10.0 mm × 2.0 mm perturbation scanned 0.1 mm measured by Frequency-Domain (FD) Single-Distance (SD) phase of photon density waves (ϕ). (a) x-y plane sliced at z=10.0mm. (b) Iso-surface sliced at S=0.010 and S=-0.005. (c) x-z plane sliced at y=0.0mm. (d) y-z plane sliced at x=17.5mm. Generated using Diffusion Theory (DT). Source-detector distance (ρ):35.0mm Index of refraction (n) inside: 1.333; Index of refraction (n) outside: 1.000 Reduced scattering coefficient μs:1.10mm-1; Absorption coefficient μa:0.011mm-1 Modulation frequency fmod:100MHz
Figure 14:
Figure 14:
x-z plane of the Sensitivity to local absorption change (𝒮) to a 10.0 mm × 10.0 mm × 2.0 mm perturbation scanned 0.1 mm measured by Frequency-Domain (FD) Single-Distance (SD) phase of photon density waves (ϕ). (a)-(j) Different values of source-detector distance (ρ). Generated using Diffusion Theory (DT). Index of refraction (n) inside: 1.333; Index of refraction (n) outside: 1.000 Reduced scattering coefficient μs:1.10mm-1; Absorption coefficient μa:0.011mm-1 Modulation frequency fmod:100MHz
Figure 15:
Figure 15:
x-z plane of the Sensitivity to local absorption change (𝒮) to a 10.0 mm × 10.0 mm × 2.0 mm perturbation scanned 0.1 mm measured by Frequency-Domain (FD) Single-Distance (SD) phase of photon density waves (ϕ). (a)-(j) Different values of modulation frequency fmod. Generated using Diffusion Theory (DT). Source-detector distance (ρ):35.0mm Index of refraction (n) inside: 1.333; Index of refraction (n) outside: 1.000 Reduced scattering coefficient μs:1.10mm-1; Absorption coefficient μa:0.011mm-1
Figure 16:
Figure 16:
Third angle projection of the Sensitivity to local absorption change (𝒮) to a 10.0 mm × 10.0 mm × 2.0 mm perturbation scanned 0.1 mm measured by Frequency-Domain (FD) Single-Slope (SS) Intensity (I). (a) x-y plane sliced at z=10.0mm. (b) Iso-surface sliced at S=0.020 and S=-0.010. (c) x-z plane sliced at y=0.0mm. (d) y-z plane sliced at x=20.0mm. Generated using Diffusion Theory (DT). Source-detector distances (ρs):[25.0,35.0]mm Index of refraction (n) inside: 1.333 Index of refraction (n) outside: 1.000 Reduced scattering coefficient μs:1.10mm-1 Absorption coefficient μa:0.011mm-1 Modulation frequency fmod:100MHz
Figure 17:
Figure 17:
Third angle projection of the Sensitivity to local absorption change (𝒮) to a 10.0 mm × 10.0 mm × 2.0 mm perturbation scanned 0.1 mm measured by Frequency-Domain (FD) Dual-Slope (DS) Intensity (I). (a) x-y plane sliced at z=10.0mm. (b) Iso-surface sliced at S=0.020 and S=-0.010. (c) x-z plane sliced at y=0.0mm. (d) y-z plane sliced at x=30.0mm. Generated using Diffusion Theory (DT). Source-detector distances (ρs):[25.0,35.0,35.0,25.0]mm Index of refraction (n) inside: 1.333 Index of refraction (n) outside: 1.000 Reduced scattering coefficient μs:1.10mm-1 Absorption coefficient μa:0.011mm-1 Modulation frequency fmod:100MHz
Figure 18:
Figure 18:
x-z plane of the Sensitivity to local absorption change (𝒮) to a 10.0 mm × 10.0 mm × 2.0 mm perturbation scanned 0.1 mm measured by Frequency-Domain (FD) Single-Slope (SS) Intensity (I). (a)-(j) Different values of modulation frequency fmod. Generated using Diffusion Theory (DT). Source-detector distances (ρs):[25.0,35.0]mm Index of refraction (n) inside: 1.333; Index of refraction (n) outside: 1.000 Reduced scattering coefficient μs:1.10mm-1; Absorption coefficient μa:0.011mm-1
Figure 19:
Figure 19:
x-z plane of the Sensitivity to local absorption change (𝒮) to a 10.0 mm × 10.0 mm × 2.0 mm perturbation scanned 0.1 mm measured by Frequency-Domain (FD) Dual-Slope (DS) Intensity (I). (a)-(j) Different values of modulation frequency fmod. Generated using Diffusion Theory (DT). Source-detector distances (ρs):[25.0,35.0,35.0,25.0]mm Index of refraction (n) inside: 1.333; Index of refraction (n) outside: 1.000 Reduced scattering coefficient μs:1.10mm-1; Absorption coefficient μa:0.011mm-1
Figure 20:
Figure 20:
Third angle projection of the Sensitivity to local absorption change (𝒮) to a 10.0 mm × 10.0 mm × 2.0 mm perturbation scanned 0.1 mm measured by Frequency-Domain (FD) Single-Slope (SS) phase of photon density waves (ϕ). (a) x-y plane sliced at z=10.0mm. (b) Iso-surface sliced at S=0.020 and S=-0.010. (c) x-z plane sliced at y=0.0mm. (d) y-z plane sliced at x=20.0mm. Generated using Diffusion Theory (DT). Source-detector distances (ρs):[25.0,35.0]mm Index of refraction (n) inside: 1.333 Index of refraction (n) outside: 1.000 Reduced scattering coefficient μs:1.10mm-1 Absorption coefficient μa:0.011mm-1 Modulation frequency fmod:100MHz
Figure 21:
Figure 21:
Third angle projection of the Sensitivity to local absorption change (𝒮) to a 10.0 mm × 10.0 mm × 2.0 mm perturbation scanned 0.1 mm measured by Frequency-Domain (FD) Dual-Slope (DS) phase of photon density waves (ϕ). (a) x-y plane sliced at z=10.0mm. (b) Iso-surface sliced at S=0.020 and S=-0.010. (c) x-z plane sliced at y=0.0mm. (d) y-z plane sliced at x=30.0mm. Generated using Diffusion Theory (DT). Source-detector distances (ρs):[25.0,35.0,35.0,25.0]mm Index of refraction (n) inside: 1.333; Index of refraction (n) outside: 1.000 Reduced scattering coefficient μs:1.10mm-1; Absorption coefficient μa:0.011mm-1 Modulation frequency fmod:100MHz
Figure 22:
Figure 22:
x-z plane of the Sensitivity to local absorption change (𝒮) to a 10.0 mm × 10.0 mm × 2.0 mm perturbation scanned 0.1 mm measured by Frequency-Domain (FD) Single-Slope (SS) phase of photon density waves (ϕ). (a)-(h) Different values of mean source-detector distance (ρ). Generated using Diffusion Theory (DT). Difference in source-detector distance (Δρ):10.0mm Index of refraction (n) inside: 1.333; Index of refraction (n) outside: 1.000 Reduced scattering coefficient μs:1.10mm-1; Absorption coefficient μa:0.011mm-1 Modulation frequency fmod:100MHz
Figure 23:
Figure 23:
x-z plane of the Sensitivity to local absorption change (𝒮) to a 10.0 mm × 10.0 mm × 2.0 mm perturbation scanned 0.1 mm measured by Frequency-Domain (FD) Dual-Slope (DS) phase of photon density waves (ϕ). (a)-(h) Different values of mean source-detector distance (ρ). Generated using Diffusion Theory (DT). Difference in source-detector distance (Δρ):10.0mm Index of refraction (n) inside: 1.333; Index of refraction (n) outside: 1.000 Reduced scattering coefficient μs:1.10mm-1; Absorption coefficient μa:0.011mm-1 Modulation frequency fmod:100MHz
Figure 24:
Figure 24:
x-z plane of the Sensitivity to local absorption change (𝒮) to a 10.0 mm × 10.0 mm × 2.0 mm perturbation scanned 0.1 mm measured by Frequency-Domain (FD) Single-Slope (SS) phase of photon density waves (ϕ). (a)-(i) Different values of difference in source-detector distance (Δρ). Generated using Diffusion Theory (DT). Mean source-detector distance (ρ):27.5mm Index of refraction (n) inside: 1.333; Index of refraction (n) outside: 1.000 Reduced scattering coefficient μs:1.10mm-1; Absorption coefficient μa:0.011mm-1 Modulation frequency fmod:100MHz
Figure 25:
Figure 25:
x-z plane of the Sensitivity to local absorption change (𝒮) to a 10.0 mm × 10.0 mm × 2.0 mm perturbation scanned 0.1 mm measured by Frequency-Domain (FD) Dual-Slope (DS) phase of photon density waves (ϕ). (a)-(i) Different values of difference in source-detector distance (Δρ). Generated using Diffusion Theory (DT). Mean source-detector distance (ρ):27.5mm Index of refraction (n) inside: 1.333; Index of refraction (n) outside: 1.000 Reduced scattering coefficient μs:1.10mm-1; Absorption coefficient μa:0.011mm-1 Modulation frequency fmod:100MHz
Figure 26:
Figure 26:
x-z plane of the Sensitivity to local absorption change (𝒮) to a 10.0 mm × 10.0 mm × 2.0 mm perturbation scanned 0.1 mm measured by Frequency-Domain (FD) Single-Slope (SS) phase of photon density waves (ϕ). (a)-(j) Different values of modulation frequency fmod. Generated using Diffusion Theory (DT). Source-detector distances (ρs):[25.0,35.0]mm Index of refraction (n) inside: 1.333; Index of refraction (n) outside: 1.000 Reduced scattering coefficient μs:1.10mm-1; Absorption coefficient μa:0.011mm-1
Figure 27:
Figure 27:
x-z plane of the Sensitivity to local absorption change (𝒮) to a 10.0 mm × 10.0 mm × 2.0 mm perturbation scanned 0.1 mm measured by Frequency-Domain (FD) Dual-Slope (DS) phase of photon density waves (ϕ). (a)-(j) Different values of modulation frequency fmod. Generated using Diffusion Theory (DT). Source-detector distances (ρs):[25.0,35.0,35.0,25.0]mm Index of refraction (n) inside: 1.333; Index of refraction (n) outside: 1.000 Reduced scattering coefficient μs:1.10mm-1; Absorption coefficient μa:0.011mm-1
Figure 28:
Figure 28:
Third angle projection of the Sensitivity to local absorption change (𝒮) to a 0.5 mm × 0.5 mm × 0.5 mm perturbation scanned 0.5 mm measured by Time-Domain (TD) Single-Distance (SD) gated Intensity (I). (a) x-y plane sliced at z=10.0mm. (b) Iso-surface sliced at S=3.000×10⁻⁵. (c) x-z plane sliced at y=0.0mm. (d) y-z plane sliced at x=0.0mm. Generated using Monte Carlo (MC). Source-detector distance (ρ):0.0mm Index of refraction (n) inside: 1.333; Index of refraction (n) outside: 1.000 Reduced scattering coefficient μs:1.10mm-1; Scattering anisotropy (g):0.9 Absorption coefficient μa:0.011mm-1 Time (t) gate: [1500, 2000] ps Detector Numerical Aperature (NA): 0.5; Number of photons: 109
Figure 29:
Figure 29:
Third angle projection of the Sensitivity to local absorption change (𝒮) to a 10.0 mm × 10.0 mm × 2.0 mm perturbation scanned 0.5 mm measured by Time-Domain (TD) Single-Distance (SD) gated Intensity (I). (a) x-y plane sliced at z=10.0mm. (b) Iso-surface sliced at S=0.020. (c) x-z plane sliced at y=0.0mm. (d) y-z plane sliced at x=0.0mm. Generated using Monte Carlo (MC). Source-detector distance (ρ):0.0mm Index of refraction (n) inside: 1.333; Index of refraction (n) outside: 1.000 Reduced scattering coefficient μs:1.10mm-1; Scattering anisotropy (g):0.9 Absorption coefficient μa:0.011mm-1 Time (t) gate: [1500, 2000] ps Detector Numerical Aperature (NA): 0.5; Number of photons: 109
Figure 30:
Figure 30:
Third angle projection of the Sensitivity to local absorption change (𝒮) to a 10.0 mm × 10.0 mm × 2.0 mm perturbation scanned 0.5 mm measured by Time-Domain (TD) Single-Distance (SD) gated Intensity (I). (a) x-y plane sliced at z=10.0mm. (b) Iso-surface sliced at S=0.010 and S=-0.005. (c) x-z plane sliced at y=0.0mm. (d) y-z plane sliced at x=17.5mm. Generated using Diffusion Theory (DT). Source-detector distance (ρ):35.0mm Index of refraction (n) inside: 1.333 Index of refraction (n) outside: 1.000 Reduced scattering coefficient μs:1.10mm-1 Absorption coefficient μa:0.011mm-1 Time (t) gate: [1500, 2000] ps
Figure 31:
Figure 31:
x-z plane of the Sensitivity to local absorption change (𝒮) to a 10.0 mm × 10.0 mm × 2.0 mm perturbation scanned 0.5 mm measured by Time-Domain (TD) Single-Distance (SD) gated Intensity (I). (a)-(j) Different values of source-detector distance (ρ). Generated using Diffusion Theory (DT). Index of refraction (n) inside: 1.333; Index of refraction (n) outside: 1.000 Reduced scattering coefficient μs:1.10mm-1; Absorption coefficient μa:0.011mm-1 Time (t) gate: [1500, 2000] ps
Figure 32:
Figure 32:
x-z plane of the Sensitivity to local absorption change (𝒮) to a 10.0 mm × 10.0 mm × 2.0 mm perturbation scanned 0.5 mm measured by Time-Domain (TD) Single-Distance (SD) gated Intensity (I). (a)-(i) Different values of mean time (t). Generated using Monte Carlo (MC). Source-detector distance (ρ):0.0mm Index of refraction (n) inside: 1.333; Index of refraction (n) outside: 1.000 Reduced scattering coefficient μs:1.10mm-1; Scattering anisotropy (g):0.9 Absorption coefficient μa:0.011mm-1 Time difference (Δt) gate: 500 ps Detector Numerical Aperature (NA): 0.5; Number of photons: 109
Figure 33:
Figure 33:
x-z plane of the Sensitivity to local absorption change (𝒮) to a 10.0 mm × 10.0 mm × 2.0 mm perturbation scanned 0.5 mm measured by Time-Domain (TD) Single-Distance (SD) gated Intensity (I). (a)-(j) Different values of mean time (t). Generated using Diffusion Theory (DT). Source-detector distance (ρ):35.0mm Index of refraction (n) inside: 1.333; Index of refraction (n) outside: 1.000 Reduced scattering coefficient μs:1.10mm-1; Absorption coefficient μa:0.011mm-1 Time difference (Δt) gate: 500 ps
Figure 34:
Figure 34:
x-z plane of the Sensitivity to local absorption change (𝒮) to a 10.0 mm × 10.0 mm × 2.0 mm perturbation scanned 0.5 mm measured by Time-Domain (TD) Single-Distance (SD) gated Intensity (I). (a)-(i) Different values of time difference (Δt). Generated using Monte Carlo (MC). Source-detector distance (ρ):0.0mm Index of refraction (n) inside: 1.333; Index of refraction (n) outside: 1.000 Reduced scattering coefficient μs:1.10mm-1; Scattering anisotropy (g):0.9 Absorption coefficient μa:0.011mm-1 Mean time (t) gate: 1750 ps Detector Numerical Aperature (NA): 0.5; Number of photons: 109
Figure 35:
Figure 35:
x-z plane of the Sensitivity to local absorption change (𝒮) to a 10.0 mm × 10.0 mm × 2.0 mm perturbation scanned 0.5 mm measured by Time-Domain (TD) Single-Distance (SD) gated Intensity (I). (a)-(j) Different values of time difference (Δt). Generated using Diffusion Theory (DT). Source-detector distance (ρ):35.0mm Index of refraction (n) inside: 1.333; Index of refraction (n) outside: 1.000 Reduced scattering coefficient μs:1.10mm-1; Absorption coefficient μa:0.011mm-1 Mean time (t) gate: 1750 ps
Figure 36:
Figure 36:
Third angle projection of the Sensitivity to local absorption change (𝒮) to a 10.0 mm × 10.0 mm × 2.0 mm perturbation scanned 0.5 mm measured by Time-Domain (TD) Single-Distance (SD) mean of the photon time-off-light distribution (t). (a) x-y plane sliced at z=10.0mm. (b) Iso-surface sliced at S=0.010 and S=-0.005. (c) x-z plane sliced at y=0.0mm. (d) y-z plane sliced at x=17.5mm. Generated using Diffusion Theory (DT). Source-detector distance (ρ):35.0mm Index of refraction (n) inside: 1.333 Index of refraction (n) outside: 1.000 Reduced scattering coefficient μs:1.10mm-1 Absorption coefficient μa:0.011mm-1
Figure 37:
Figure 37:
Third angle projection of the Sensitivity to local absorption change (𝒮) to a 0.5 mm × 0.5 mm × 0.5 mm perturbation scanned 0.5 mm measured by Time-Domain (TD) Single-Distance (SD) difference in gated Intensity (I). (a) x-y plane sliced at z=10.0mm. (b) Iso-surface sliced at S=3.000×10⁻⁵ and S=-1.000×10⁻⁵. (c) x-z plane sliced at y=0.0mm. (d) y-z plane sliced at x=0.0mm. Generated using Monte Carlo (MC). Source-detector distance (ρ):0.0mm Index of refraction (n) inside: 1.333; Index of refraction (n) outside: 1.000 Reduced scattering coefficient μs:1.10mm-1; Scattering anisotropy (g):0.9 Absorption coefficient μa:0.011mm-1 Early time (t) gate: [500, 1000] ps; Time (t) gate: [1500, 2000] ps Detector Numerical Aperature (NA): 0.5; Number of photons: 109
Figure 38:
Figure 38:
Third angle projection of the Sensitivity to local absorption change (𝒮) to a 10.0 mm × 10.0 mm × 2.0 mm perturbation scanned 0.5 mm measured by Time-Domain (TD) Single-Distance (SD) difference in gated Intensity (I). (a) x-y plane sliced at z=10.0mm. (b) Iso-surface sliced at S=0.020 and S=-0.010. (c) x-z plane sliced at y=0.0mm. (d) y-z plane sliced at x=0.0mm. Generated using Monte Carlo (MC). Source-detector distance (ρ):0.0mm Index of refraction (n) inside: 1.333; Index of refraction (n) outside: 1.000 Reduced scattering coefficient μs:1.10mm-1; Scattering anisotropy (g):0.9 Absorption coefficient μa:0.011mm-1 Early time (t) gate: [500, 1000] ps; Time (t) gate: [1500, 2000] ps Detector Numerical Aperature (NA): 0.5; Number of photons: 109
Figure 39:
Figure 39:
Third angle projection of the Sensitivity to local absorption change (𝒮) to a 10.0 mm × 10.0 mm × 2.0 mm perturbation scanned 0.5 mm measured by Time-Domain (TD) Single-Distance (SD) difference in gated Intensity (I). (a) x-y plane sliced at z=10.0mm. (b) Iso-surface sliced at S=0.010 and S=-0.005. (c) x-z plane sliced at y=0.0mm. (d) y-z plane sliced at x=17.5mm. Generated using Diffusion Theory (DT). Source-detector distance (ρ):35.0mm Index of refraction (n) inside: 1.333 Index of refraction (n) outside: 1.000 Reduced scattering coefficient μs:1.10mm-1 Absorption coefficient μa:0.011mm-1 Early time (t) gate: [500, 1000] ps Time (t) gate: [1500, 2000] ps
Figure 40:
Figure 40:
x-z plane of the Sensitivity to local absorption change (𝒮) to a 10.0 mm × 10.0 mm × 2.0 mm perturbation scanned 0.5 mm measured by Time-Domain (TD) Single-Distance (SD) difference in gated Intensity (I). (a)-(j) Different values of source-detector distance (ρ). Generated using Diffusion Theory (DT). Index of refraction (n) inside: 1.333; Index of refraction (n) outside: 1.000 Reduced scattering coefficient μs:1.10mm-1; Absorption coefficient μa:0.011mm-1 Early time (t) gate: [500, 1000] ps Time (t) gate: [1500, 2000] ps
Figure 41:
Figure 41:
x-z plane of the Sensitivity to local absorption change (𝒮) to a 10.0 mm × 10.0 mm × 2.0 mm perturbation scanned 0.5 mm measured by Time-Domain (TD) Single-Distance (SD) difference in gated Intensity (I). (a)-(e) Different values of average of gate center times (t)¯gates. Generated using Monte Carlo (MC). Source-detector distance (ρ):0.0mm Index of refraction (n) inside: 1.333; Index of refraction (n) outside: 1.000 Reduced scattering coefficient μs:1.10mm-1; Scattering anisotropy (g):0.9 Absorption coefficient μa:0.011mm-1 Time difference (Δt) gates: 500 ps Differance between gate center times Δ(t)gates:1000ps Detector Numerical Aperature (NA): 0.5; Number of photons: 109
Figure 42:
Figure 42:
x-z plane of the Sensitivity to local absorption change (𝒮) to a 10.0 mm × 10.0 mm × 2.0 mm perturbation scanned 0.5 mm measured by Time-Domain (TD) Single-Distance (SD) difference in gated Intensity (I). (a)-(j) Different values of average of gate center times (t)¯gates. Generated using Diffusion Theory (DT). Source-detector distance (ρ):35.0mm Index of refraction (n) inside: 1.333; Index of refraction (n) outside: 1.000 Reduced scattering coefficient μs:1.10mm-1; Absorption coefficient μa:0.011mm-1 Time difference (Δt) gates: 500 ps Differance between gate center times Δ(t)gates:1000ps
Figure 43:
Figure 43:
x-z plane of the Sensitivity to local absorption change (𝒮) to a 10.0 mm × 10.0 mm × 2.0 mm perturbation scanned 0.5 mm measured by Time-Domain (TD) Single-Distance (SD) difference in gated Intensity (I). (a)-(c) Different values of differance between gate center times Δ(t)gates. Generated using Monte Carlo (MC). Source-detector distance (ρ):0.0mm Index of refraction (n) inside: 1.333; Index of refraction (n) outside: 1.000 Reduced scattering coefficient μs:1.10mm-1; Scattering anisotropy (g):0.9 Absorption coefficient μa:0.011mm-1 Time difference (Δt) gates: 500 ps Average of gate center times (t)¯gates:1250ps Detector Numerical Aperature (NA): 0.5; Number of photons: 109
Figure 44:
Figure 44:
x-z plane of the Sensitivity to local absorption change (𝒮) to a 10.0 mm × 10.0 mm × 2.0 mm perturbation scanned 0.5 mm measured by Time-Domain (TD) Single-Distance (SD) difference in gated Intensity (I). (a)-(i) Different values of differance between gate center times Δ(t)gates. Generated using Diffusion Theory (DT). Source-detector distance (ρ):35.0mm Index of refraction (n) inside: 1.333; Index of refraction (n) outside: 1.000 Reduced scattering coefficient μs:1.10mm-1; Absorption coefficient μa:0.011mm-1 Time difference (Δt) gates: 500 ps Average of gate center times (t)¯gates:1250ps
Figure 45:
Figure 45:
Third angle projection of the Sensitivity to local absorption change (𝒮) to a 10.0 mm × 10.0 mm × 2.0 mm perturbation scanned 0.5 mm measured by Time-Domain (TD) Single-Distance (SD) variance of the photon time-of-flight distribution σ2. (a) x-y plane sliced at z=10.0mm. (b) Iso-surface sliced at S=0.010 and S=-0.005. (c) x-z plane sliced at y=0.0mm. (d) y-z plane sliced at x=17.5mm. Generated using Diffusion Theory (DT). Source-detector distance (ρ):35.0mm Index of refraction (n) inside: 1.333 Index of refraction (n) outside: 1.000 Reduced scattering coefficient μs:1.10mm-1 Absorption coefficient μa:0.011mm-1
Figure 46:
Figure 46:
x-z plane of the Sensitivity to local absorption change (𝒮) to a 10.0 mm × 10.0 mm × 2.0 mm perturbation scanned 0.5 mm measured by Time-Domain (TD) Single-Distance (SD) variance of the photon time-of-flight distribution σ2. (a)-(j) Different values of source-detector distance (ρ). Generated using Diffusion Theory (DT). Index of refraction (n) inside: 1.333; Index of refraction (n) outside: 1.000 Reduced scattering coefficient μs:1.10mm-1; Absorption coefficient μa:0.011mm-1
Figure 47:
Figure 47:
Third angle projection of the Sensitivity to local absorption change (𝒮) to a 10.0 mm × 10.0 mm × 2.0 mm perturbation scanned 0.5 mm measured by Time-Domain (TD) Single-Slope (SS) gated Intensity (I). (a) x-y plane sliced at z=10.0mm. (b) Iso-surface sliced at S=0.040 and S=-0.015. (c) x-z plane sliced at y=0.0mm. (d) y-z plane sliced at x=20.0mm. Generated using Diffusion Theory (DT). Source-detector distances (ρs): [25.0, 35.0] mm Index of refraction (n) inside: 1.333 Index of refraction (n) outside: 1.000 Reduced scattering coefficient μs:1.10mm-1 Absorption coefficient μa:0.011mm-1 Time (t) gate: [1500, 2000] ps
Figure 48:
Figure 48:
Third angle projection of the Sensitivity to local absorption change (𝒮) to a 10.0 mm × 10.0 mm × 2.0 mm perturbation scanned 0.5 mm measured by Time-Domain (TD) Dual-Slope (DS) gated Intensity (I).(a) x-y plane sliced at z=10.0mm. (b) Iso-surface sliced at S=0.040 and S=-0.015. (c) x-z plane sliced at y=0.0mm. (d) y-z plane sliced at x=30.0mm. Generated using Diffusion Theory (DT). Source-detector distances (ρs): [25.0, 35.0, 35.0, 25.0] mm Index of refraction (n) inside: 1.333 Index of refraction (n) outside: 1.000 Reduced scattering coefficient μs:1.10mm-1 Absorption coefficient μa:0.011mm-1 Time (t) gate: [1500, 2000] ps
Figure 49:
Figure 49:
x-z plane of the Sensitivity to local absorption change (𝒮) to a 10.0 mm × 10.0 mm × 2.0 mm perturbation scanned 0.5 mm measured by Time-Domain (TD) Single-Slope (SS) gated Intensity (I). (a)-(h) Different values of mean source-detector distance (ρ). Generated using Diffusion Theory (DT). Difference in source-detector distance (Δρ):10.0mm Index of refraction (n) inside: 1.333; Index of refraction (n) outside: 1.000 Reduced scattering coefficient μs:1.10mm-1; Absorption coefficient μa:0.011mm-1 Time (t) gate: [1500, 2000] ps
Figure 50:
Figure 50:
x-z plane of the Sensitivity to local absorption change (𝒮) to a 10.0 mm × 10.0 mm × 2.0 mm perturbation scanned 0.5 mm measured by Time-Domain (TD) Dual-Slope (DS) gated Intensity (I). (a)-(h) Different values of mean source-detector distance (ρ). Generated using Diffusion Theory (DT). Difference in source-detector distance (Δρ):10.0mm Index of refraction (n) inside: 1.333; Index of refraction (n) outside: 1.000 Reduced scattering coefficient μs:1.10mm-1; Absorption coefficient μa:0.011mm-1 Time (t) gate: [1500, 2000] ps
Figure 51:
Figure 51:
x-z plane of the Sensitivity to local absorption change (𝒮) to a 10.0 mm × 10.0 mm × 2.0 mm perturbation scanned 0.5 mm measured by Time-Domain (TD) Single-Slope (SS) gated Intensity (I). (a)-(i) Different values of difference in source-detector distance (Δρ). Generated using Diffusion Theory (DT). Mean source-detector distance (ρ):27.5mm Index of refraction (n) inside: 1.333; Index of refraction (n) outside: 1.000 Reduced scattering coefficient μs:1.10mm-1; Absorption coefficient μa:0.011mm-1 Time (t) gate: [1500, 2000] ps
Figure 52:
Figure 52:
x-z plane of the Sensitivity to local absorption change (𝒮) to a 10.0 mm × 10.0 mm × 2.0 mm perturbation scanned 0.5 mm measured by Time-Domain (TD) Dual-Slope (DS) gated Intensity (I). (a)-(i) Different values of difference in source-detector distance (Δρ). Generated using Diffusion Theory (DT). Mean source-detector distance (ρ):27.5mm Index of refraction (n) inside: 1.333; Index of refraction (n) outside: 1.000 Reduced scattering coefficient μs:1.10mm-1; Absorption coefficient μa:0.011mm-1 Time (t) gate: [1500, 2000] ps
Figure 53:
Figure 53:
x-z plane of the Sensitivity to local absorption change (𝒮) to a 10.0 mm × 10.0 mm × 2.0 mm perturbation scanned 0.5 mm measured by Time-Domain (TD) Single-Slope (SS) gated Intensity (I). (a)-(j) Different values of mean time (t). Generated using Diffusion Theory (DT). Source-detector distances (ρs): [25.0, 35.0] mm Index of refraction (n) inside: 1.333; Index of refraction (n) outside: 1.000 Reduced scattering coefficient μs:1.10mm-1; Absorption coefficient μa:0.011mm-1 Time difference (Δt) gate: 500 ps
Figure 54:
Figure 54:
x-z plane of the Sensitivity to local absorption change (𝒮) to a 10.0 mm × 10.0 mm × 2.0 mm perturbation scanned 0.5 mm measured by Time-Domain (TD) Dual-Slope (DS) gated Intensity (I). (a)-(j) Different values of mean time (t). Generated using Diffusion Theory (DT). Source-detector distances (ρs): [25.0, 35.0, 35.0, 25.0] mm Index of refraction (n) inside: 1.333; Index of refraction (n) outside: 1.000 Reduced scattering coefficient μs:1.10mm-1; Absorption coefficient μa:0.011mm-1 Time difference (Δt) gate: 500 ps
Figure 55:
Figure 55:
x-z plane of the Sensitivity to local absorption change (𝒮) to a 10.0 mm × 10.0 mm × 2.0 mm perturbation scanned 0.5 mm measured by Time-Domain (TD) Single-Slope (SS) gated Intensity (I). (a)-(j) Different values of time difference (Δt). Generated using Diffusion Theory (DT). Source-detector distances (ρs): [25.0, 35.0] mm Index of refraction (n) inside: 1.333; Index of refraction (n) outside: 1.000 Reduced scattering coefficient μs:1.10mm-1; Absorption coefficient μa:0.011mm-1 Mean time (t) gate: 1750 ps
Figure 56:
Figure 56:
x-z plane of the Sensitivity to local absorption change (𝒮) to a 10.0 mm × 10.0 mm × 2.0 mm perturbation scanned 0.5 mm measured by Time-Domain (TD) Dual-Slope (DS) gated Intensity (I). (a)-(j) Different values of time difference (Δt). Generated using Diffusion Theory (DT). Source-detector distances (ρs): [25.0, 35.0, 35.0, 25.0] mm Index of refraction (n) inside: 1.333; Index of refraction (n) outside: 1.000 Reduced scattering coefficient μs:1.10mm-1; Absorption coefficient μa:0.011mm-1 Mean time (t) gate: 1750 ps
Figure 57:
Figure 57:
Third angle projection of the Sensitivity to local absorption change (𝒮) to a 10.0 mm × 10.0 mm × 2.0 mm perturbation scanned 0.5 mm measured by Time-Domain (TD) Single-Slope (SS) mean of the photon time-of-flight distribution (t). (a) x-y plane sliced at z=10.0mm. (b) Iso-surface sliced at S=0.020 and S=-0.010. (c) x-z plane sliced at y=0.0mm. (d) y-z plane sliced at x=20.0mm. Generated using Diffusion Theory (DT). Source-detector distances (ρs): [25.0, 35.0] mm Index of refraction (n) inside: 1.333 Index of refraction (n) outside: 1.000 Reduced scattering coefficient μs:1.10mm-1 Absorption coefficient μa:0.011mm-1
Figure 58:
Figure 58:
Third angle projection of the Sensitivity to local absorption change (𝒮) to a 10.0 mm × 10.0 mm × 2.0 mm perturbation scanned 0.5 mm measured by Time-Domain (TD) Dual-Slope (DS) mean of the photon time-of-flight distribution (t). (a) x-y plane sliced at z=10.0mm. (b) Iso-surface sliced at S=0.020 and S=-0.010. (c) x-z plane sliced at y=0.0mm. (d) y-z plane sliced at x=30.0mm. Generated using Diffusion Theory (DT). Source-detector distances (ρs): [25.0, 35.0, 35.0, 25.0] mm Index of refraction (n) inside: 1.333; Index of refraction (n) outside: 1.000 Reduced scattering coefficient μs:1.10mm-1; Absorption coefficient μa:0.011mm-1
Figure 59:
Figure 59:
Third angle projection of the Sensitivity to local absorption change (𝒮) to a 10.0 mm × 10.0 mm × 2.0 mm perturbation scanned 0.5 mm measured by Time-Domain (TD) Single-Slope (SS) variance of the photon time-of-flight distribution σ2. (a) x-y plane sliced at z=10.0mm. (b) Iso-surface sliced at S=0.010 and S=-0.005. (c) x-z plane sliced at y=0.0mm. (d) y-z plane sliced at x=20.0mm. Generated using Diffusion Theory (DT). Source-detector distances (ρs): [25.0, 35.0] mm Index of refraction (n) inside: 1.333; Index of refraction (n) outside: 1.000 Reduced scattering coefficient μs:1.10mm-1; Absorption coefficient μa:0.011mm-1
Figure 60:
Figure 60:
Third angle projection of the Sensitivity to local absorption change (𝒮) to a 10.0 mm × 10.0 mm × 2.0 mm perturbation scanned 0.5 mm measured by Time-Domain (TD) Dual-Slope (DS) variance of the photon time-of-flight distribution σ2.(a) x-y plane sliced at z=10.0mm. (b) Iso-surface sliced at S=0.010 and S=-0.005. (c) x-z plane sliced at y=0.0mm. (d) y-z plane sliced at x=30.0mm. Generated using Diffusion Theory (DT). Source-detector distances (ρs): [25.0, 35.0, 35.0, 25.0] mm Index of refraction (n) inside: 1.333 Index of refraction (n) outside: 1.000 Reduced scattering coefficient μs:1.10mm-1 Absorption coefficient μa:0.011mm-1
Figure 61:
Figure 61:
x-z plane of the Sensitivity to local absorption change (𝒮) to a 10.0 mm × 10.0 mm × 2.0 mm perturbation scanned 0.5 mm measured by Time-Domain (TD) Single-Slope (SS) variance of the photon time-of-flight distribution σ2. (a)-(h) Different values of mean source-detector distance (ρ). Generated using Diffusion Theory (DT). Difference in source-detector distance (Δρ):10.0mm Index of refraction (n) inside: 1.333; Index of refraction (n) outside: 1.000 Reduced scattering coefficient μs:1.10mm-1; Absorption coefficient μa:0.011mm-1
Figure 62:
Figure 62:
x-z plane of the Sensitivity to local absorption change (𝒮) to a 10.0 mm × 10.0 mm × 2.0 mm perturbation scanned 0.5 mm measured by Time-Domain (TD) Dual-Slope (DS) variance of the photon time-of-flight distribution σ2. (a)-(h) Different values of mean source-detector distance (ρ). Generated using Diffusion Theory (DT). Difference in source-detector distance (Δρ):10.0mm Index of refraction (n) inside: 1.333; Index of refraction (n) outside: 1.000 Reduced scattering coefficient μs:1.10mm-1; Absorption coefficient μa:0.011mm-1
Figure 63:
Figure 63:
x-z plane of the Sensitivity to local absorption change (𝒮) to a 10.0 mm × 10.0 mm × 2.0 mm perturbation scanned 0.5 mm measured by Time-Domain (TD) Single-Slope (SS) variance of the photon time-of-flight distribution σ2. (a)-(i) Different values of difference in source-detector distance (Δρ). Generated using Diffusion Theory (DT). Mean source-detector distance (ρ):27.5mm Index of refraction (n) inside: 1.333; Index of refraction (n) outside: 1.000 Reduced scattering coefficient μs:1.10mm-1; Absorption coefficient μa:0.011mm-1
Figure 64:
Figure 64:
x-z plane of the Sensitivity to local absorption change (𝒮) to a 10.0 mm × 10.0 mm × 2.0 mm perturbation scanned 0.5 mm measured by Time-Domain (TD) Dual-Slope (DS) variance of the photon time-of-flight distribution σ2. (a)-(i) Different values of difference in source-detector distance (Δρ). Generated using Diffusion Theory (DT). Mean source-detector distance (ρ):27.5mm Index of refraction (n) inside: 1.333; Index of refraction (n) outside: 1.000 Reduced scattering coefficient μs:1.10mm-1; Absorption coefficient μa:0.011mm-1

Similar articles

Cited by

References

    1. Weiss George H., Nossal Ralph, and Bonner Robert F.. Statistics of Penetration Depth of Photons Reemitted from Irradiated Tissue. Journal of Modern Optics, 36(3):349–359, March 1989. ISSN 0950–0340. doi: 10.1080/09500348914550381. - DOI
    1. Barbour RL, Graber H, Aronson R, and Lubowsky J. Model For 3-D Optical Imaging Of Tissue. In 10th Annual International Symposium on Geoscience and Remote Sensing, pages 1395–1399, May 1990. doi: 10.1109/IGARSS.1990.688761. - DOI
    1. Schweiger Martin, Arridge Simon Robert, Hiraoka Mutsuhisa, and Delpy David T.. Application of the finite element method for the forward model in infrared absorption imaging. In Mathematical Methods in Medical Imaging, volume 1768, pages 97–108. SPIE, December 1992. doi: 10.1117/12.130893. - DOI
    1. Schotland John C., Haselgrove John C., and Leigh John S.. Photon hitting density. Applied Optics, 32 (4):448–453, February 1993. ISSN 2155–3165. doi: 10.1364/AO.32.000448 - DOI - PubMed
    1. Sevick EM, Frisoli JK, Burch CL, and Lakowicz JR. Localization of absorbers in scattering media by use of frequency-domain measurements of time-dependent photon migration. Applied Optics, 33(16):3562–3570, June 1994. ISSN 2155–3165. doi: 10.1364/AO.33.003562. - DOI - PMC - PubMed

LinkOut - more resources