. 2024 Aug 29:11:1436486.
doi: 10.3389/fmed.2024.1436486. eCollection 2024.

Research trends and hotspots on osteoporosis: a decade-long bibliometric and visualization analysis from 2014 to 2023

Affiliations

Research trends and hotspots on osteoporosis: a decade-long bibliometric and visualization analysis from 2014 to 2023

Song Zhang et al. Front Med (Lausanne). .

Abstract

Background: Osteoporosis is characterized by diminished bone density and quality, compromised bone microstructure, and increased bone fragility, culminating in a heightened risk of fracture. Relatively few attempts have been made to survey the breadth of osteoporosis research using bibliometric approaches. This study aims to delineate the current landscape of osteoporosis research, offering clarity and visualization, while also identifying potential future directions for investigation.

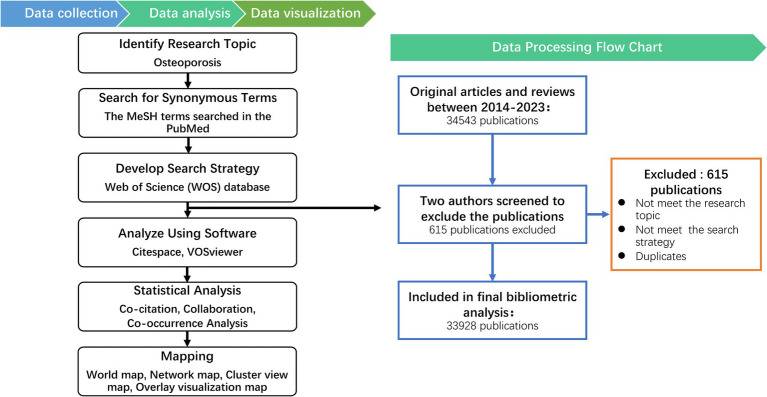
Methods: We retrieved and filtered articles and reviews pertaining to osteoporosis from the Web of Science Core Collection database, specifically the Science Citation Index Expanded (SCI-E) edition, spanning the years 2014 to 2023. Informatics tools such as CiteSpace and VOSviewer were employed to dissect the intellectual framework, discern trends, and pinpoint focal points of interest within osteoporosis research.

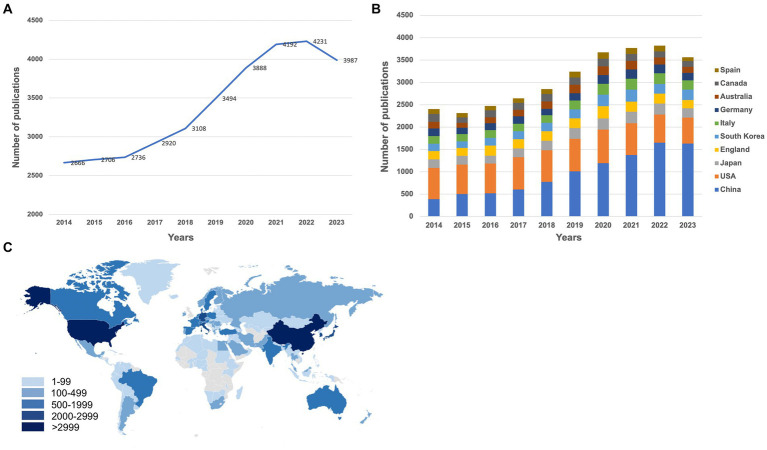
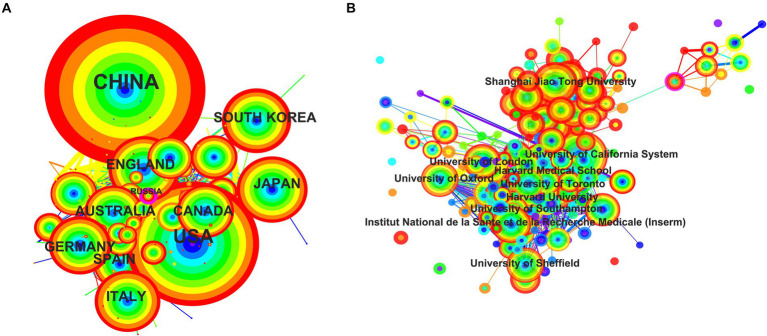
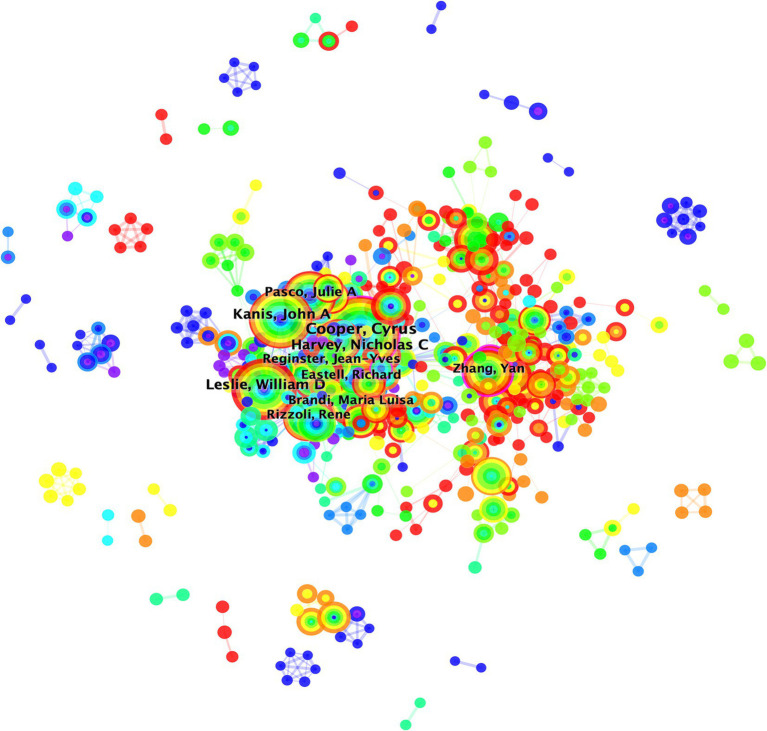
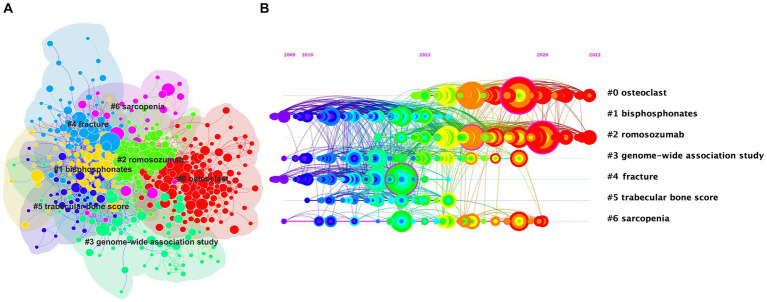
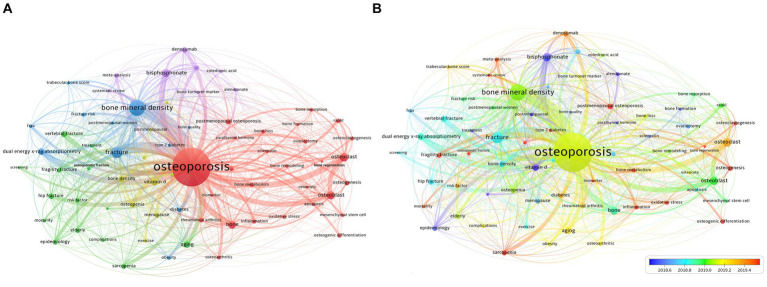
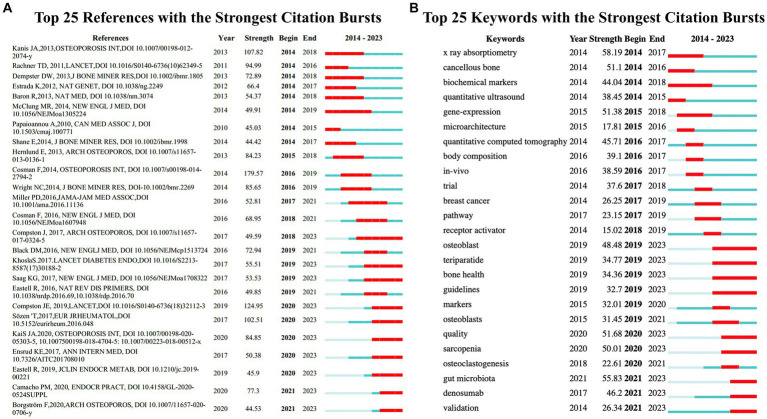
Results: Our dataset comprised 33,928 osteoporosis-related publications, with a notable surge in annual publication numbers throughout the last decade. China and the United States lead in terms of research output. The University of California System contributed substantially to this body of work, with Amgen demonstrating the highest degree of centrality within the network. Cooper Cyrus emerged as a pivotal figure in the field. An analysis of highly-cited studies, co-citation networks, and keyword co-occurrence revealed that recent years have predominantly concentrated on elucidating mechanisms underlying osteoporosis, as well as its diagnosis, prevention, and treatment strategies. Burst detection analyses of citations and keywords highlighted osteoblasts, sarcopenia, gut microbiota, and denosumab as contemporary hotspots within osteoporosis research.

Conclusion: This bibliometric analysis has provided a visual representation of the fundamental knowledge structure, prevailing trends, and key focal areas within osteoporosis research. The identification of osteoblasts, sarcopenia, gut microbiota, and denosumab as current hotspots may guide future research endeavors. Continued efforts directed at understanding the mechanisms, fracture outcomes, diagnostics, and therapeutics related to osteoporosis are anticipated to deepen our comprehension of this complex disease.

Keywords: CiteSpace; VOSviewer; bibliometric analysis; cited reference; osteoporosis.


Conflict of interest statement

The authors declare that the research was conducted in the absence of any commercial or financial relationships that could be construed as a potential conflict of interest.

Figures

Figure 1
Figure 1
Bibliometrics processing of the information and suggested science mapping (Left) with Data processing flow chart for Osteoporosis (Right).
Figure 2
Figure 2
(A) The annual number of publications in osteoporosis research from 2014 to 2023. (B) The annual number of publications in the top 10 most productive countries from 2014 to 2023. (C) A world map depicting the contribution of each country/region based on publication counts. These figures were generated using the Online Analysis Platform of Literature Metrology (https://bibliometric.com/).
Figure 3
Figure 3
The network map of collaborating countries/regions (A) and institutions (B) in osteoporosis research. The collaboration map of countries/regions (A) and institutions (B) represents the collaborative relationships between countries/regions and institutions. The size of the circles indicates the number of published articles; the larger the diameter, the more articles published. The lines denote the collaboration strength. The color of the circles transitions from blue to red from the inside out, representing the publication years 2014–2023. These two figures are generated using the Citespace software.
Figure 4
Figure 4
Overlay visualization map of author co-authorship analysis generated by VOSviewer software. The collaboration map of authors reflects the scientific research cooperation between them. The circle/node signifies the authors; size of the circle/node signifies the number of articles. The lines denote the authors’ collaboration strength. The color of the circles transitions from blue to red from the inside out, representing the publication years 2014–2023. This figure is generated using the Citespace software.
Figure 5
Figure 5
The cluster view map (A) and timeline view map (B) of reference co-citation analysis were generated by CiteSpace. In the cluster analysis (A), each color represents a cluster, as follows: “0#osteoclasts”—red; “1#bisphosphonates”—yellow; “2#romosozumab”—light green; “3#genome-wide association study”—green; “4#fracture”—blue; “5#trabecular bone score”—purple; “6#sarcopenia”—pink. (B) Shows the timeline of reference co-citation analysis, where the color change from purple to red represents the time change from 2009 to 2022. These two figures are generated using the Citespace software.
Figure 6
Figure 6
(A) Overlay visualization map of keywords co-occurrence analysis. (B) The changes in keywords from 2018.6 to 2019.4. (A) VOSviewer identified 69 author keywords appearing more than 200 times, categorizing them into 5 principal clusters. These can be summarized from largest to smallest as follows: mechanism (Red), fracture (Green), diagnosis (Blue), prevention (Yellow), and treatment (Purple). (B) An overlay visualization depicting the time progression of keywords.
Figure 7
Figure 7
(A) References with the strongest citation bursts in publications on osteoporosis research between 2014 and 2023. (B) Keywords with the strongest citation bursts in publications on osteoporosis research between 2014 and 2023. The blue lines represent time intervals, while the red segments represent the periods when reference bursts occur. These two figures are generated using the Citespace software.

Similar articles

References

    1. Ensrud KE, Crandall CJ. Osteoporosis. Ann Intern Med. (2017) 167:ITC17–32. doi: 10.7326/AITC201708010 - DOI - PubMed
    1. Lane NE. Epidemiology, etiology, and diagnosis of osteoporosis. Am J Obstet Gynecol. (2006) 194:S3–S11. doi: 10.1016/j.ajog.2005.08.047 - DOI - PubMed
    1. Cummings SR, Melton LJ. Epidemiology and outcomes of osteoporotic fractures. Lancet. (2002) 359:1761–7. doi: 10.1016/S0140-6736(02)08657-9 - DOI - PubMed
    1. Borgström F, Karlsson L, Ortsäter G, Norton N, Halbout P, Cooper C, et al. . Fragility fractures in Europe: burden, management and opportunities. Arch Osteoporos. (2020) 15:59. doi: 10.1007/s11657-020-0706-y, PMID: - DOI - PMC - PubMed
    1. Delanaye P, Glassock RJ. Kidney-failure risk projection for the living kidney-donor candidate. N Engl J Med. (2016) 374:2093–4. doi: 10.1056/NEJMc1603007, PMID: - DOI - PubMed

LinkOut - more resources