

Sex-related differences in pulmonary vascular volume distribution
- PMID: 39268397
- PMCID: PMC11391118
- DOI: 10.1002/pul2.12436
Sex-related differences in pulmonary vascular volume distribution
Abstract
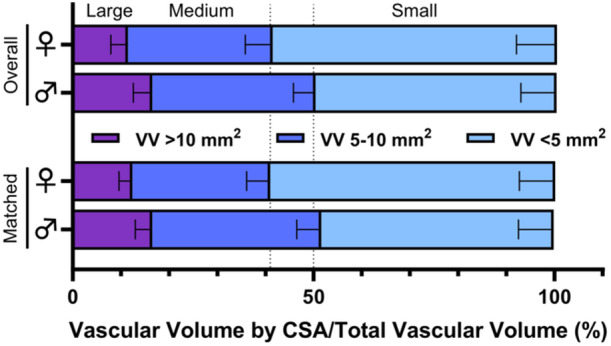
Pulmonary arterial hypertension affects females more frequently than males, and there are known sex-related differences in the lungs. However, normal sex-related differences in pulmonary vascular structure remain incompletely described. We aimed to contrast computed tomography-derived pulmonary vascular volume and its distribution within the lungs of healthy adult females and males. From the CanCOLD Study, we retrospectively identified healthy never-smokers. We analyzed full-inspiration computed tomography images, using vessel and airway segmentation to generate pulmonary vessel volume, vessel counts, and airway counts. Vessels were classified by cross-sectional area >10, 5-10, and <5 mm2 into bins, with volume summed within each area bin and in total. We included 46 females and 36 males (62 ± 9 years old). Females had lower total lung volume, total airway counts, total vessel counts, and total vessel volume (117 ± 31 vs. 164 ± 28 mL) versus males (all p < 0.001). Females also had lower vessel volume >10 mm2 (14 ± 8 vs. 27 ± 9 mL), vessel volume 5-10 mm2 (35 ± 11 vs. 55 ± 10 mL), and vessel volume <5 mm2 (68 ± 18 vs. 82 ± 19 mL) (all p < 0.001). Normalized to total vessel volume, vessel volume >10 mm2 (11 ± 4 vs. 16 ± 4%, p < 0.001) and 5-10 mm2 (30 ± 6 vs. 34 ± 5%, p = 0.001) remained lower in females but vessel volume <5 mm2 relative to total volume was 18% higher (59 ± 8 vs. 50 ± 7%, p < 0.001). Among healthy older adults, pulmonary vessel volume is distributed into smaller vessels in females versus males.
Keywords: aging; multislice computed tomography; pulmonary arterial hypertension; pulmonary circulation; sex characteristics.
© 2024 The Authors. Pulmonary Circulation published by Wiley Periodicals LLC on behalf of the Pulmonary Vascular Research Institute.
Figures


References
-
- Benza RL, Miller DP, Gomberg‐Maitland M, Frantz RP, Foreman AJ, Coffey CS, Frost A, Barst RJ, Badesch DB, Elliott CG, Liou TG, McGoon MD. Predicting survival in pulmonary arterial hypertension: insights from the registry to evaluate early and long‐term pulmonary arterial hypertension disease management (REVEAL). Circulation. 2010;122:164–172. - PubMed
-
- Bellemare F, Jeanneret A, Couture J. Sex differences in thoracic dimensions and configuration. Am J Respir Crit Care Med. 2003;168:305–312. - PubMed
LinkOut - more resources
Full Text Sources
