. 2024 Sep 12:7:0472.
doi: 10.34133/research.0472. eCollection 2024.

POP1 Facilitates Proliferation in Triple-Negative Breast Cancer via m6A-Dependent Degradation of CDKN1A mRNA

Affiliations

POP1 Facilitates Proliferation in Triple-Negative Breast Cancer via m6A-Dependent Degradation of CDKN1A mRNA

Chao Zhang et al. Research (Wash D C). .

Abstract

Triple-negative breast cancer (TNBC) is currently the worst prognostic subtype of breast cancer, and there is no effective treatment other than chemotherapy. Processing of precursors 1 (POP1) is the most substantially up-regulated RNA-binding protein (RBP) in TNBC. However, the role of POP1 in TNBC remains clarified. A series of molecular biological experiments in vitro and in vivo and clinical correlation analyses were conducted to clarify the biological function and regulatory mechanism of POP1 in TNBC. Here, we identified that POP1 is significantly up-regulated in TNBC and associated with poor prognosis. We further demonstrate that POP1 promotes the cell cycle and proliferation of TNBC in vitro and vivo. Mechanistically, POP1 directly binds to the coding sequence (CDS) region of CDKN1A mRNA and degrades it. The degradation process depends on the N6-methyladenosine (m6A) modification at the 497th site of CDKN1A and the recognition of this modification by YTH N6-methyladenosine RNA binding protein 2 (YTHDF2). Moreover, the m6A inhibitor STM2457 potently impaired the proliferation of POP1-overexpressed TNBC cells and improved the sensitivity to paclitaxel. In summary, our findings reveal the pivotal role of POP1 in promoting TNBC proliferation by degrading the mRNA of CDKN1A and that inhibition of m6A with STM2457 is a promising therapeutic strategy for TNBC.


Conflict of interest statement

Competing interests: The authors declare that they have no competing interests.

Figures
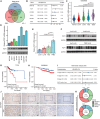
Fig. 1.
Fig. 1.
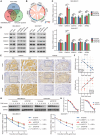
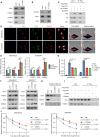
POP1 is up-regulated in TNBC and correlated with poor prognosis. (A) Venn diagram to obtain the gene intersection of differentially expressed genes, RBPs, and hazard ratio (HR) > 1 in TNBC. (B) Univariate Cox regression forest map of 6 RBPs. (C) mRNA expression levels of POP1 in different types of breast cancer tissues and normal breast tissues based on the GSE96058 dataset. (D) Quantitative reverse transcription PCR analysis and Western blot analysis to detect the mRNA and protein expression level of POP1 in different types of breast cancer cell lines and normal breast epithelial cells. The mRNA (E) and protein (F) expression levels of POP1 in different subtypes of breast cancer tissues. Analysis of mRNA levels was achieved using one-way ANOVA based on normality and homogeneity of variance. OS analysis of patients stratified by POP1 expression based on log-rank test in TNBC of TCGA (G) and GSE96058 (H). (I) Multivariate Cox regression forest map based on TNBC data from TCGA. (J) Representative microscopic IHC images of POP1 expression in the tissue sections of TNBC patients. (K) Distribution of POP1 expression in 220 patients in survival and death groups, analyzed by Yates’ correction method. **P < 0.01, ***P < 0.001.
Fig.  2.
Fig.  2.
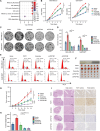
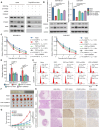
POP1 confers proliferation by advancing the cell cycle in TNBC. (A) Bubble diagram showing enrichment analysis results of POP1. (B) Line diagrams of CCK-8 proliferation experiment in TNBC cells with different POP1 expression levels. Statistical analyses were performed using the 2-way repeated-measures ANOVA. Typical results (C) and a statistical graph (D) of colony formation assay. One-way ANOVA was used for statistical analysis. (E) Representative flow cytometry cell cycle profiles. (F) Photos of subcutaneous tumors of different groups. (G) Tumor growth curves of different groups in subcutaneous tumor formation experiment in nude mice. Statistical analysis was performed using 2-way repeated-measures ANOVA. (H) Statistics of subcutaneous tumors’ weight in different groups. Welch one-way ANOVA test was used to analyze the differences among different groups. (I) Representative IHC images of subcutaneous tumors targeting POP1 and PCNA. *P < 0.05, **P < 0.01, ***P < 0.001.
Fig. 3.
Fig. 3.
POP1 promotes decay of CDKN1A mRNA. (A) Venn diagram to screening out cell cycle regulators negatively associated with POP1 expression. (B) Chord diagram showing expression correlation between POP1 and APBB1, APBB2, CDKN1A, and CDKN1C and TGFB1. (C) mRNA expression of TGFB1, CDKN1A, CDKN1C, APBB1, and APBB2 in POP1 knockdown cells and control cells. (D) Protein levels of TGFB1, CDKN1A, CDKN1C, APBB1, and APBB2 in differentially expressed POP1 cells were explored by Western blot. (E) Representative IHC images of continuous sections showing the expression of POP1, CDKN1A, and PCNA in TNBC tissues. (F) Scatterplots of POP1, CDKN1A, and PCNA SI in TNBC tissues. Spearman correlation coefficient was used to evaluate the correlation. (G) Western blot analysis of CDKN1A degradation after treated with 100 mg/ml CHX. (H) Protein degradation curves of CDKN1A (based on the amount at 0 h after treatment). (I) Degradation curves and half-life of CDKN1A mRNA in MDA-MB-231 and SUM159PT after 5 mg/ml Act-D treatment. ns, not significant; *P < 0.05; **P < 0.01.
Fig. 4.
Fig. 4.
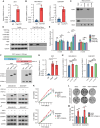
POP1 degrades CDKN1A mRNA by interacting with its CDS. RIP-PCR results about the binding between CDKN1A mRNA and POP1 protein and in 293T cells (A), MDA-MB-231 cells, and SUM159PT cells (B). (C) Western blot analysis of POP1 after biotin-labeled CDKN1A mRNA pull down. (D) Western blot analysis of POP1 after endogenous MS2 pull-down assay. (E) Luciferase reporter assay to explore the effect of POP1 on the decay of 5′UTR, CDS, and 3′UTR of CDKN1A. (F) Design and expression verification of POP1 truncated domain. (G) RIP-PCR assay to explore the binding between CDKN1A mRNA and the N-terminal or C-terminal truncate of POP1. (H) qPCR analysis to detect the effect of POP1 truncation on CDKN1A mRNA. (I) Western blot assay to detect the influence of POP1 truncation on CDKN1A protein. (J) Western blot analysis of p-Rb to detect the effect of CDKN1A overexpression on POP1 overexpression. (K) Cell viability curves showing the effect of rescue expression of CDKN1A on cell proliferation. Representative photographs (L) and a statistical graph (M) showing the effect of overexpression of CDKN1A on the colony formation ability of cells with high POP1 expression. *P < 0.05, **P < 0.01, ***P < 0.001.
Fig. 5.
Fig. 5.
POP1 degrades CDKN1A mRNA in an m6A-dependent manner. qPCR and Western blot analysis of mRNA (A) and protein (B) of CDKN1A after inhibition of m6A modification by si-METTL3 or STM2457 treatment. (C) RIP-PCR used to detect the binding of POP1 and CDKN1A mRNA after inhibition of m6A modification. (D) Degradation curves and half-life of CDKN1A mRNA in MDA-MB-231 and SUM159PT after inhibition of m6A modification. (E) Potential m6A modification sites of CDKN1A mRNA predicted by SRAMP. (F) MeRIP-PCR used to detect m6A levels at 2 potential sites of CDKN1A after inhibiting m6A modification. (G) Schematic diagram of CDKN1A mutant at 2 sites. (H) RNA pull-down assay showing the binding of wild type and site mutant CDKN1A to POP1. (I) Western blot to detect the effect of STM2457 on mutant CDKN1A.
Fig. 6.
Fig. 6.
YTHDF2 is the m6A reader mediating CDKN1A degradation. (A) Co-IP used to detect the binding of POP1 with YTH m6A RNA binding proteins. (B) Co-IP to detect the binding of YTHDF2 with POP1 and RIDA. (C) Exogenous co-IP to detect the binding of POP1, YTHDF2, and RIDA. (D) Immunofluorescence images showing subcellular localization and colocalization of POP1, RIDA, and YTHDF2. qPCR and Western blot analysis of mRNA (E) and protein (F) of CDKN1A after inhibition of m6A reading by si-YTHDF2 or si-RIDA. RIP-PCR (G) and RNA pull down (H) used to detect the binding of POP1 and CDKN1A mRNA after inhibition of m6A recognition. Welch one-way ANOVA test was used for difference analysis according to the data’s normality and homogeneity of variance. (I) Co-IP to detect the effect on the binding of POP1 with YTHDF2 when knocking down RIDA or treating with STM2457. (J) Degradation curves and half-life of CDKN1A mRNA in MDA-MB-231 and SUM159PT after inhibiting m6A recognition.
Fig. 7.
Fig. 7.
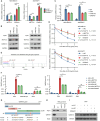
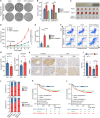
Promotion of TNBC proliferation by POP1 depends on m6A modification and recognition of CDKN1A. (A) The MS2 pull-down experiment demonstrated the combination of POP1, YTHDF2, and RIDA with CDKN1A mRNA under si-YTHDF2, si-RIDA, and STM2457 treatment. (B) qPCR and Western blot analyses of the effects of interference with m6A modification and recognition on CDKN1A expression and Rb phosphorylation in POP1-overexpressed cells. (C) Degradation curves and half-life of CDKN1A mRNA in POP1-overexpressed cells after inhibiting m6A modification or recognition. (D) Statistical results of colony formation assay of POP1-overexpressed TNBC cells under different treatments. (E) Representative flow cytometry cell cycle profiles of POP1-overexpressed TNBC cells under different treatments. Subcutaneous tumor photos (F) and tumor volume growth curves (G) of TNBC cells in different treatment groups. Statistical analysis of tumor volume growth in different groups was conducted using 2-way repeated-measures ANOVA. (H) Representative IHC images of subcutaneous tumorstargeting POP1, CDKN1A, and PCNA. *P < 0.05, **P < 0.01, ***P < 0.001.
Fig. 8.
Fig. 8.
Clinical significance of POP1 and potential application of STM2457 in TNBC. (A) Colony formation pictures to show the effect of m6A inhibitor STM2457 on the response of TNBC cells to paclitaxel. (B) Statistical graph of the results of the colony formation assay. Subcutaneous tumor photos (C), tumor growth curves (D), and statistics of tumor weight (E) of TNBC cells showing the effect of STM2457 on sensitivity to paclitaxel in vivo. (F) Representative Annexin V-PI double dye flow cytometry results showing the effect of STM2457 on apoptosis of TNBC cells treated with 20 nM paclitaxel. (G) Expression of POP1 and CDKN1A mRNA in tissues of patients with paclitaxel sensitivity and resistance in the dataset GSE6434. (H) Representative IHC images of continuous sections showing the expression of POP1 and CDKN1A in patients with different response to neoadjuvant chemotherapy. (I) POP1 and CDKN1A expression in non-pathological complete response (pCR) patients compared with pCR patients (non-pCR N = 10, pCR N = 10). (J) Proportion of POP1 and CDKN1A expression in different OS and DFS outcomes. The statistics was conducted using the chi-square test. Survival curves of patients with different levels of POP1 and CDKN1A expression including OS (K) and DFS (L). Log-rank test was used for survival analysis of different groups. *P < 0.05, **P < 0.01, ***P < 0.001.
Fig. 9.
Fig. 9.
A model of this study showing that the YTHDF2–RIDA–POP1–CDKN1A axis promotes proliferation in TNBC.

Similar articles

Cited by

References

    1. Zhu S, Wu Y, Song B, Yi M, Yan Y, Mei Q, Wu K. Recent advances in targeted strategies for triple-negative breast cancer. J Hematol Oncol. 2023;16(1):100. - PMC - PubMed
    1. Bianchini G, De Angelis C, Licata L, Gianni L. Treatment landscape of triple-negative breast cancer—Expanded options, evolving needs. Nat Rev Clin Oncol. 2022;19(2):91–113. - PubMed
    1. Peng WT, Jin X, Xu XE, Yang YS, Ma D, Shao ZM, Jiang YZ. Inhibition of ACAA1 restrains proliferation and potentiates the response to CDK4/6 inhibitors in triple-negative breast cancer. Cancer Res. 2023;83(10):1711–1724. - PubMed
    1. Liang Y, Zhang H, Song X, Yang Q. Metastatic heterogeneity of breast cancer: Molecular mechanism and potential therapeutic targets. Semin Cancer Biol. 2020;60:14–27. - PubMed
    1. Hanahan D, Weinberg RA. Hallmarks of cancer: The next generation. Cell. 2011;144(5):646–674. - PubMed