. 2024 Oct 14;52(18):11158-11176.
doi: 10.1093/nar/gkae776.

RTP801 interacts with the tRNA ligase complex and dysregulates its RNA ligase activity in Alzheimer's disease

Affiliations

RTP801 interacts with the tRNA ligase complex and dysregulates its RNA ligase activity in Alzheimer's disease

Genís Campoy-Campos et al. Nucleic Acids Res. .

Abstract

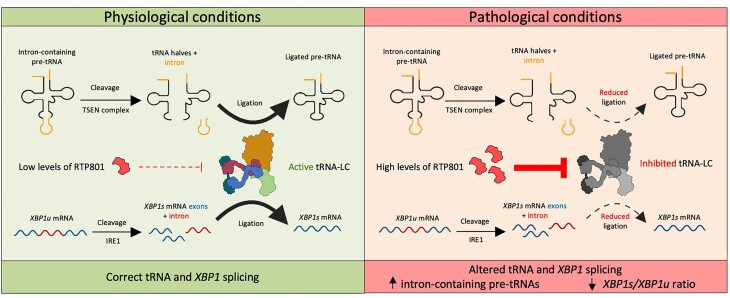
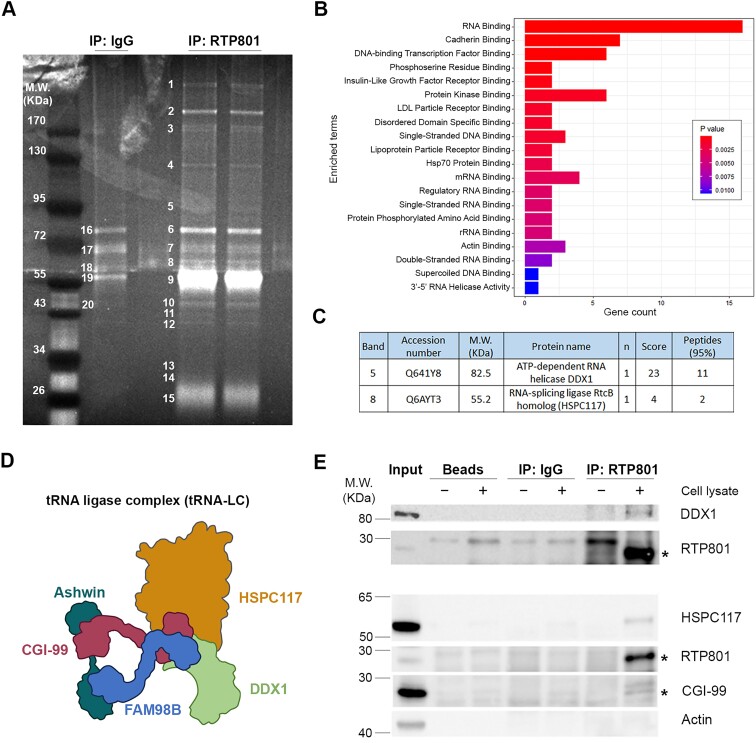
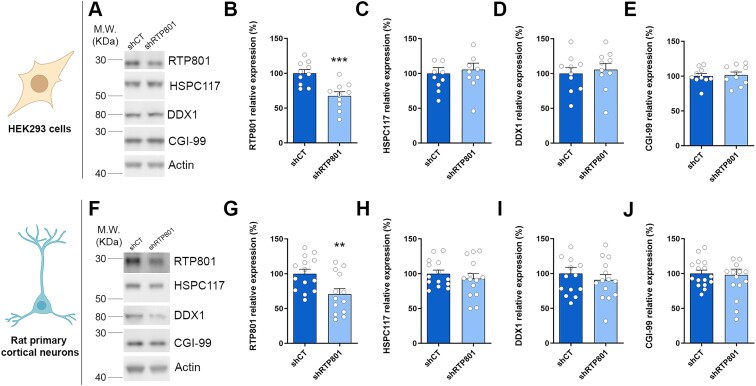
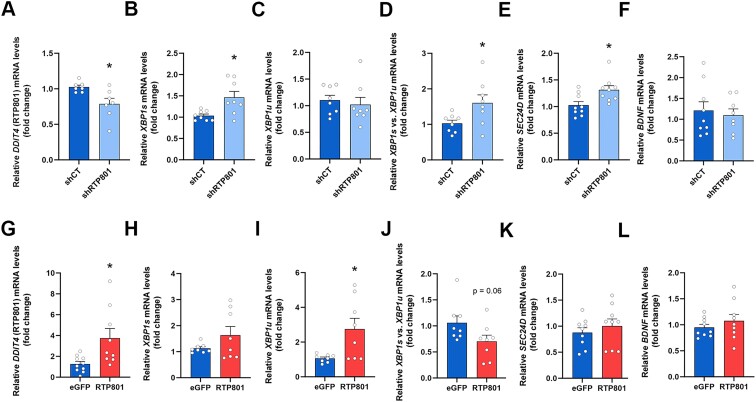
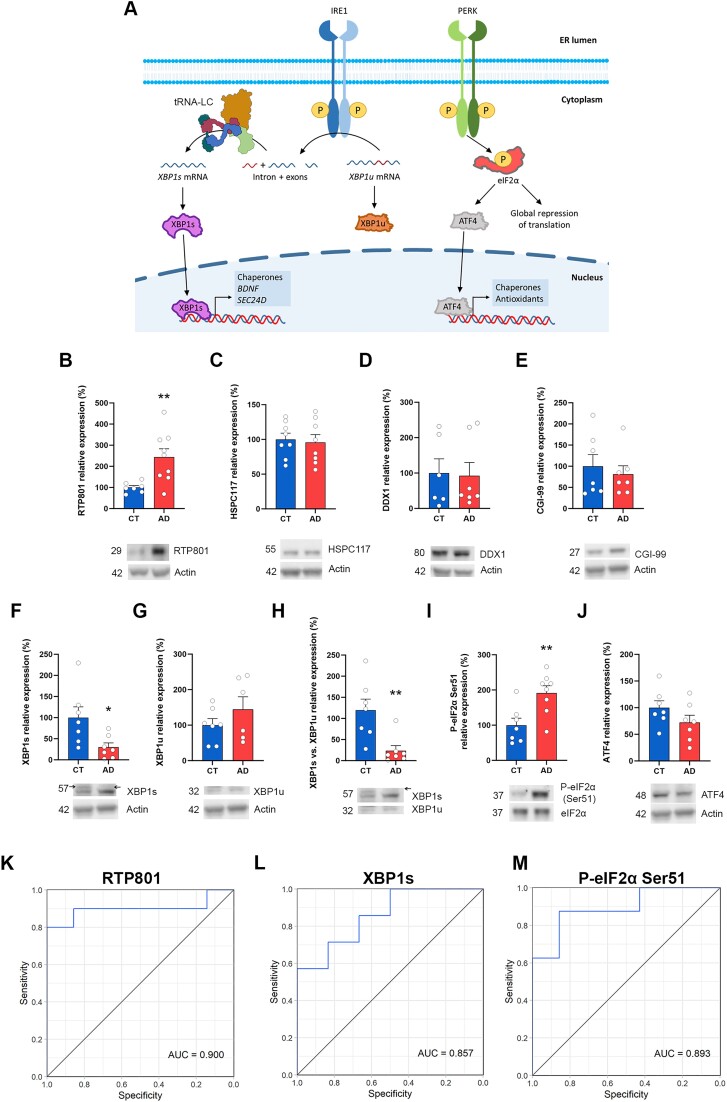
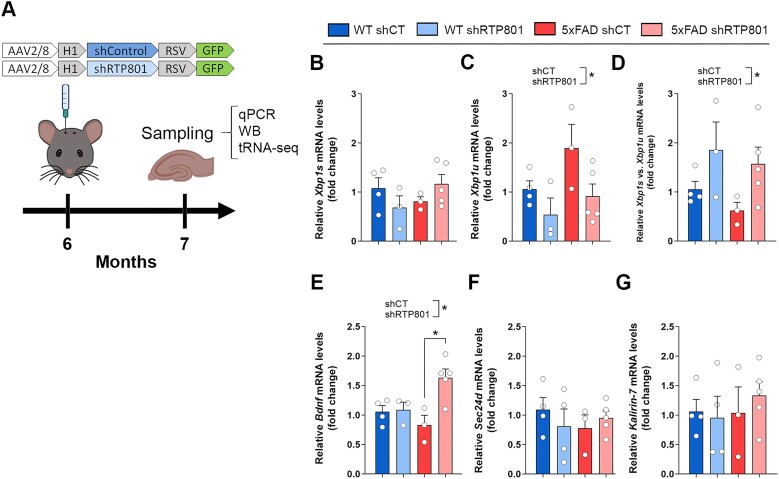
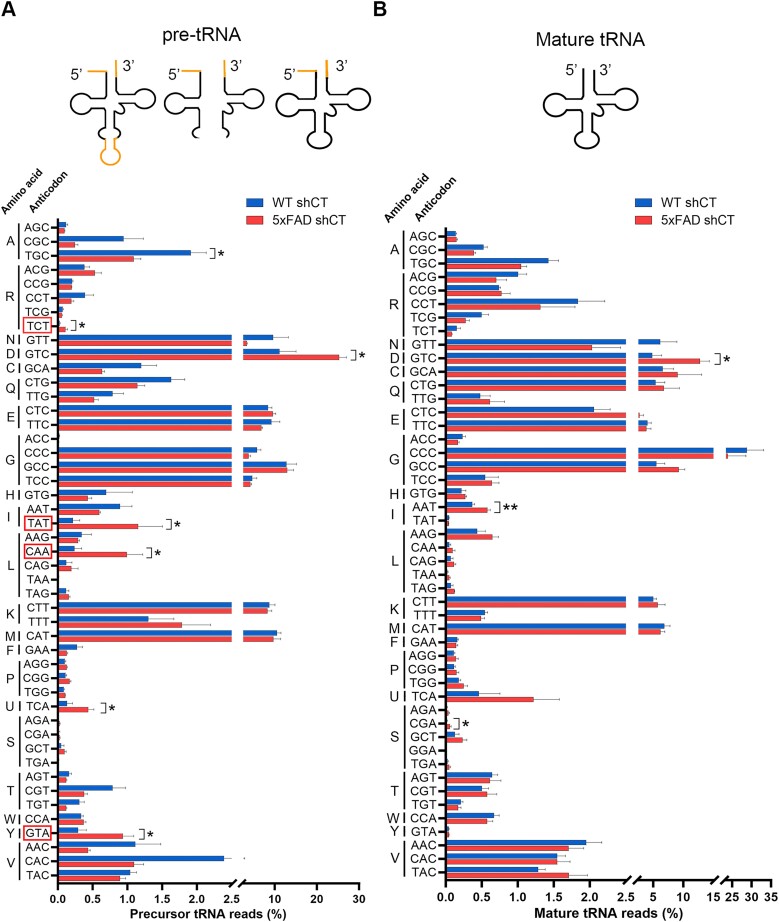
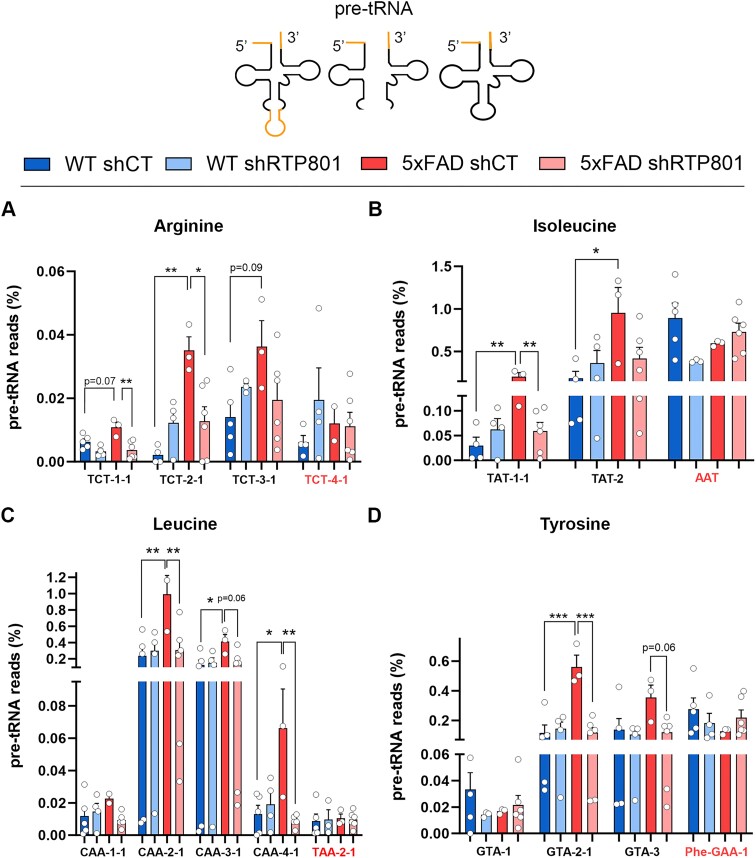
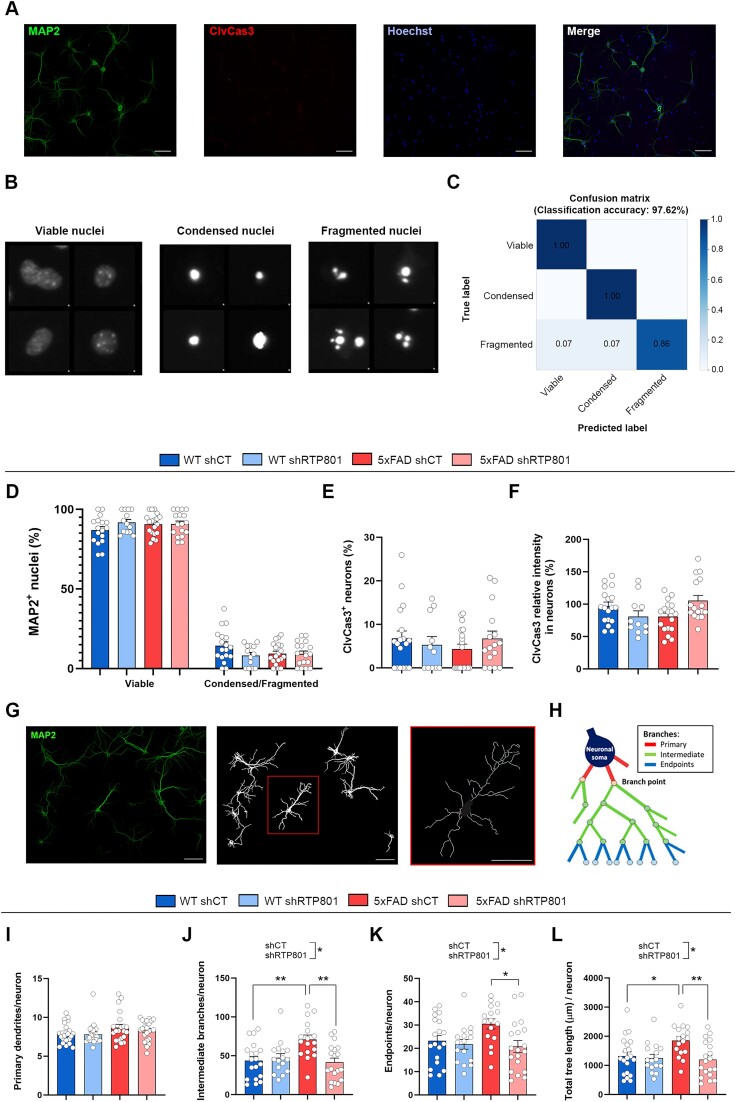
RTP801/REDD1 is a stress-responsive protein overexpressed in neurodegenerative diseases such as Alzheimer's disease (AD) that contributes to cognitive deficits and neuroinflammation. Here, we found that RTP801 interacts with HSPC117, DDX1 and CGI-99, three members of the tRNA ligase complex (tRNA-LC), which ligates the excised exons of intron-containing tRNAs and the mRNA exons of the transcription factor XBP1 during the unfolded protein response (UPR). We also found that RTP801 modulates the mRNA ligase activity of the complex in vitro since RTP801 knockdown promoted XBP1 splicing and the expression of its transcriptional target, SEC24D. Conversely, RTP801 overexpression inhibited the splicing of XBP1. Similarly, in human AD postmortem hippocampal samples, where RTP801 is upregulated, we found that XBP1 splicing was dramatically decreased. In the 5xFAD mouse model of AD, silencing RTP801 expression in hippocampal neurons promoted Xbp1 splicing and prevented the accumulation of intron-containing pre-tRNAs. Finally, the tRNA-enriched fraction obtained from 5xFAD mice promoted abnormal dendritic arborization in cultured hippocampal neurons, and RTP801 silencing in the source neurons prevented this phenotype. Altogether, these results show that elevated RTP801 impairs RNA processing in vitro and in vivo in the context of AD and suggest that RTP801 inhibition could be a promising therapeutic approach.


Figures

Graphical Abstract
Graphical Abstract
Figure 1.
Figure 1.
RTP801 interacts with DDX1, HSPC117 and CGI-99. (A) Polyacrylamide gel of RTP801 immunocomplexes. RTP801 was immunoprecipitated from rat cortical neuronal cultures (DIV 14) and the resulting immunocomplexes were resolved in a SDS-PAGE gel. The bands were stained, numbered and cut for the subsequent analysis by MS. (B) GO biological process enrichment analysis of RTP801 interactors. For each enriched category, the Fisher’s exact test P-value is calculated, and bars are filled according to it. The top 20 enriched GO molecular function terms are plotted. (C) Table showing the accession number (Uniprot database), molecular weight (M.W.), number of times identified (n), score and the number of peptides detected for DDX1 and HSPC117 in the MS analysis. (D) Schematic representation of the tRNA-LC components. (E) Immunoprecipitation of RTP801 in HEK293 cells. After a 2-h treatment with DSP, HEK293 cells were harvested and endogenous RTP801 was immunoprecipitated. Some lysates were incubated with beads or beads bound to normal IgGs as negative controls. Samples were then analyzed by WB. The asterisks indicate the bands corresponding to RTP801 (≈ 28 kDa) and CGI-99 (≈27 kDa); n = 2.
Figure 2.
Figure 2.
RTP801 does not affect the protein levels of the tRNA-LC effectors. (A) WB for RTP801, HSPC117, DDX1, CGI-99, and actin as loading control in HEK293 cells transfected with shRNA against RTP801. (B–E) Densitometric quantification of RTP801 (B), HSPC117 (C), DDX1 (D) and CGI-99 (E) results as in (A) (RTP801: t18 = 4.064, P = 0.0007; HSPC117: t18 = 0.432, P = 0.6693; DDX1: t18 = 0.4452, P = 0.6615; CGI-99: t18 = 0.2417, P = 0.8118). (F) WB for RTP801, HSPC117, DDX1, CGI-99, and actin as loading control in rat cortical neurons infected with shRNA against RTP801-containing lentiviruses. (G–J) Densitometric quantification of RTP801 (G), HSPC117 (H), DDX1 (I) and CGI-99 (J) results as in (F) (RTP801: t25 = 2.852, P = 0.0086; HSPC117: t26 = 0.7986, P = 0.4317; DDX1: t26 = 0.7879, P = 0.4379; CGI-99: t30 = 0.2107, P = 0.8346). All data are analyzed with the unpaired two-tailed Student’s t-test, and all data are represented as mean ± SEM. Values represent technical replicates of three independent experiments. Values were excluded when they were classified as outliers with either the ROUT or the Grubbs’ test from Graphpad Prism software. **P < 0.01 and ***P < 0.001.
Figure 3.
Figure 3.
RTP801 inhibits the splicing of XBP1 in vitro. HEK293 cells were transfected with shCT, shRTP801, eGFP or eGFP-RTP801. Two or three days later, RNA was extracted, retrotranscribed and RT-qPCR was performed. (A–F) RT-qPCR results in HEK293 cells with downregulation of RTP801. Relative expression of DDIT4 (RTP801 coding gene) (A), XBP1s (B), XBP1u (C), XBP1s/XBP1u (D), SEC24D (E) and BDNF (F) (DDIT4: t7.326 = 2.809, P = 0.0250; XBP1s: t8.129 = 2.936, P = 0.0185; XBP1u: t14 = 0.5131, P = 0.6159; XBP1s/XBP1u: t9.129 = 2.370, P = 0.0416; SEC24D: t16 = 2.757, P = 0.0140; BDNF: t15 = 0.4246, P = 0.6772). (G–L) RT-qPCR results in HEK293 cells with upregulation of RTP801. Relative expression of DDIT4 (RTP801 coding gene) (G), XBP1s (H), XBP1u (I), XBP1s/XBP1u (J), SEC24D (K) and BDNF (L) (DDIT4: t9.087 = 2.618, P = 0.0277; XBP1s: t7.478 = 1.520, P = 0.1697; XBP1u: t7.228 = 2.714, P = 0.0291; XBP1s/XBP1u: t14 = 2.003, P = 0.0649; SEC24D: t16 = 0.7845, P = 0.4442; BDNF: t16 = 0.9284, P = 0.3670). ACTB (β-actin) was used to normalize the expression of all genes. All data are analyzed with the unpaired two-tailed t-test. Welch’s correction was applied in panels (A, B, D, G, H, and I) because variances were unequal between the two conditions. All data are represented as mean ± SEM. Values represent technical replicates of three independent experiments. Values were excluded when they were classified as outliers with either the ROUT or the Grubbs’ test from Graphpad Prism software; *P < 0.05.
Figure 4.
Figure 4.
Reduced XBP1 splicing in the hippocampus of AD patients. (A) Graphical representation of the IRE1 and the PERK branches of the UPR. Accumulation of unfolded or misfolded proteins leads to the activation of the UPR. The effector of the IRE1 branch is XBP1s, a transcription factor whose mRNA requires the ligation by the tRNA-LC to be translated. The effector of the PERK branch is phosphorylated eIF2α, which promotes the expression of ATF4. (B–J) WB and densitometric quantification for RTP801 (B), HSPC117 (C), DDX1 (D), CGI-99 (E), XBP1s (F), XBP1u (G), XBP1s/XBP1u (H), p-eIF2α Ser51 (I), ATF4 (J) and actin as loading control in human postmortem hippocampal samples. (RTP801: t8.856 = 3.529, P = 0.0066; HSPC117: t14 = 0.2921, P = 0.7745; DDX1: U = 18, P = 0.7308; CGI-99: t12 = 0.5519, P = 0.5912; XBP1s: t7.855 = 2.556, P = 0.0344; XBP1u: t11 = 1.168, P = 0.2675; XBP1s/XBP1u: U = 3, P = 0.0041; p-eIF2α Ser51: t13 = 3.183, P = 0.0072; ATF4: t12 = 1.485, P = 0.1634). All data are analyzed with the unpaired two-tailed t-test (except for panel [D and H]). The arrows in panels (F and H) indicate the specific band for XBP1s (≈ 57 kDa). Welch’s correction was applied in panels (B and F) because variances were unequal between the two conditions. Data in panels (D and H) were analyzed with Mann–Whitney U test because values did not pass the normality test. All data are represented as mean ± SEM. Values were excluded when they were classified as outliers with either the ROUT or the Grubbs’ test from GraphPad Prism software. *P < 0.05 and **P < 0.01. (K–M) ROC curves of RTP801 (K), XBP1s (L) and p-eIF2α Ser51 (M) obtained from the protein expression values from the densitometric analyses in (B), (F) and (I), respectively.
Figure 5.
Figure 5.
RTP801 downregulation in hippocampal neurons promotes Xbp1 splicing in the 5xFAD mouse model of AD. (A) Timeline of mice surgery and sampling. Six-month-old WT and 5xFAD mice were bilaterally injected in the dorsal hippocampus with neuron-directed AAVs containing shCT or shRTP801 and GFP. Four weeks later animals were euthanized, and the hippocampi were obtained for RT-qPCR, WB and sequencing. (B–G) RT-qPCR results relativized to Hprt. Relative expression of Xbp1s (B), Xbp1u (C), Xbp1s/Xbp1u (D), Bdnf (E), Sec24d (F) and Kalirin-7 (G) (Xbp1u: treatment effect: F(1, 11) = 6.109, P = 0.0310; Xbp1s/XBP1u: treatment effect: F(1, 11) = 6.375, P = 0.0282; Bdnf: treatment effect: F(1, 11) = 7.936, P = 0.0168, interaction effect: F(1, 11) = 6799, P = 0.0244). Data are means ± SEM. Each value represents one animal. In all panels two-way ANOVA with Tukey’s post-hoc test was performed. Values were excluded when they were classified as outliers with either the ROUT or the Grubbs’ test from Graphpad Prism software. *P < 0.05.
Figure 6.
Figure 6.
5xFAD mice accumulate intron-containing pre-tRNAs. tRNAs were isolated from 7-month-old WT and 5xFAD mice and sequenced by Hydro-tRNA-seq. The percentage of normalized counts for precursor (A) and mature (B) tRNA is depicted, classified by amino acid and anticodon (pre-tRNA-Ala-TGC: t6 = 2.692, P = 0.0360; pre-tRNA-Arg-TCT: t5 = 3.364, P = 0.0200; pre-tRNA-Asp-GTC: t6 = 2.635, P = 0.0388; pre-tRNA-Ile-TAT: t5 = 2.986, P = 0.0306; pre-tRNA-Leu-CAA: t6 = 3.440, P = 0.0138; pre-tRNA-Sec-TCA: t6 = 2.496, P = 0.0468; pre-tRNA-Tyr-GTA: t6 = 3.264, P = 0.0172) (tRNA-Asp-GTC: t6 = 3.332, P = 0.0158; tRNA-Ile-AAT: t6 = 3.814, P = 0.0088; tRNA-Ser-CGA: t6 = 2.771, P = 0.0324). The red rectangles surrounding certain anticodons indicate that at least one of those pre-tRNA isodecoders has an intron. Data are means ± SEM. In all comparisons Student’s t-test was performed. Values were excluded when they were classified as outliers with either the ROUT or the Grubbs’ test from Graphpad Prism software. *P < 0.05 and **P < 0.01.
Figure 7.
Figure 7.
RTP801 downregulation in hippocampal neurons prevents accumulation of intron-containing pre-tRNAs in 5xFAD mice. The percentage of normalized counts for pre-tRNA is depicted, classified by amino acid and anticodon. Different pre-tRNA species within an isodecoder family are represented. Pre-tRNA species in red do not have an intron and are included as a control. Since all tyrosine-accepting pre-tRNAs have intron, pre-tRNA-Phe-GAA-1 (also accepts an aromatic amino acid) was included as a control. Relative expression of pre-tRNA-Arg-TCT (A), pre-tRNA-Ile-TAT (B), pre-tRNA-Leu-CAA (C), and pre-tRNA-Tyr-GTA (D) (pre-tRNA-Arg-TCT-1–1: genotype effect: F(1, 14) = 4.942, P = 0.0432, treatment effect: F(1, 14) = 20.64, P = 0.0005; pre-tRNA-Arg-TCT-2–1: genotype effect: F(1, 13) = 15.37, P = 0.0018, interaction effect: F(1, 13) = 14.52, P = 0.0022; pre-tRNA-Arg-TCT-3–1: interaction effect: F(1, 13) = 4.876, P = 0.0458; pre-tRNA-Ile-TAT-1–1: genotype effect: F(1, 13) = 11.69, P = 0.0046, treatment effect: F(1, 13) = 5.093, P = 0.0419, interaction effect: F(1, 13) = 12.52, P = 0.0036; tRNA-Ile-TAT-2: genotype effect: F(1, 13) = 6.102, P = 0.0281; pre-tRNA-Leu-CAA-2–1: genotype effect: F(1, 14) = 10.75, P = 0.0055, treatment effect: F(1, 14) = 7.621, P = 0.0153, interaction effect: F(1, 14) = 10.46, P = 0.0060; pre-tRNA-Leu-CAA-3–1: genotype effect: F(1, 14) = 5.081, P = 0.0407, interaction effect: F(1, 14) = 4.977, P = 0.0426; pre-tRNA-Leu-CAA-4–1: genotype effect: F(1, 13) = 4.953, P = 0.0444, treatment effect: F(1, 13) = 7.206, P = 0.0187, interaction effect: F(1, 13) = 11.05, P = 0.0055; pre-tRNA-Tyr-GTA-2–1: genotype effect: F(1, 14) = 17.27, P = 0.0010, treatment effect: F(1, 14) = 17.11, P = 0.0010, interaction effect: F(1, 14) = 22.18, P = 0.0003; pre-tRNA-Tyr-GTA-3: treatment effect: F(1, 14) = 5.218, P = 0.0385). Data are means ± SEM. In all comparisons two-way ANOVA with Tukey’s post hoc test was performed. Each value represents one animal. Values were excluded when they were classified as outliers with either the ROUT or the Grubbs’ test from Graphpad Prism software; *P < 0.05, **P < 0.01, and ***P < 0.001.
Figure 8.
Figure 8.
The tRNA-enriched sRNA fraction from 5xFAD mice increases dendrite branching in hippocampal cultured neurons without affecting neuron viability. (A) Representative images of tRNA-transfected mouse hippocampal neurons stained with MAP2, ClvCas3, and Hoechst 33342. (B) Classification of neuronal nuclei into viable, condensed or fragmented with Cell Profiler Analyst. (C) Confusion matrix for the nuclei classification in (B). (D) Proportion of viable and condensed/fragmented neuronal nuclei. (E) Percentage of ClvCas3+ neurons. (F) ClvCas3 mean intensity in neurons. (G) From MAP2 images, neurons not touching the borders of the image were identified as independent objects, and the neuron skeleton was obtained. (H) Schematic representation of the different types of branches found in a neuron (adapted from (37)). (I–K) Average number of primary dendrites (I), intermediate branches (J) and endpoints (K) per neuron (Intermediate branches: treatment effect: F(1, 67) = 5.610, P = 0.0207, interaction effect: F(1, 67) = 9.263, P = 0.0033; endpoints: treatment effect: F(1, 66) = 5.863, P = 0.0182). (L) Average total tree length (μm) per neuron (treatment effect: F(1, 68) = 6.767, P = 0.0114, interaction effect: F(1, 68) = 4.532, P = 0.0369); Scale bar = 50 μm. Data are means ± SEM. In all comparisons two-way ANOVA with Tukey's post hoc test was performed. Each value represents the mean of one microscope image, obtained from two independent experiments with technical replicates. Values were excluded when they were classified as outliers with either the ROUT or the Grubbs’ test from Graphpad Prism software; *P < 0.05 and **P < 0.01.

Similar articles

Cited by

References

    1. Ghosh A., Mizuno K., Tiwari S.S., Proitsi P., Gomez Perez-Nievas B., Glennon E., Martinez-Nunez R.T., Giese K.P.. Alzheimer's disease-related dysregulation of mRNA translation causes key pathological features with ageing. Transl. Psych. 2020; 10:192. - PMC - PubMed
    1. Jishi A., Qi X., Miranda H.C.. Implications of mRNA translation dysregulation for neurological disorders. Semin. Cell Dev. Biol. 2021; 114:11. - PMC - PubMed
    1. Shoshani T., Faerman A., Mett I., Zelin E., Tenne T., Gorodin S., Moshel Y., Elbaz S., Budanov A., Chajut A.et al. .. Identification of a novel hypoxia-inducible factor 1-responsive gene, RTP801, involved in apoptosis. Mol. Cell. Biol. 2002; 22:2283–2293. - PMC - PubMed
    1. Ellisen L.W., Ramsayer K.D., Johannessen C.M., Yang A., Beppu H., Minda K., Oliner J.D., McKeon F., Haber D.A.. REDD1, a developmentally regulated transcriptional target of p63 and p53, links p63 to regulation of reactive oxygen species. Mol. Cell. 2002; 10:995–1005. - PubMed
    1. Kim J.R., Lee S.R., Chung H.J., Kim S., Baek S.H., Kim J.H., Kim Y.S.. Identification of amyloid β-peptide responsive genes by cDNA microarray technology: involvement of RTP801 in amyloid β-peptide toxicity. Exp. Mol. Med. 2003; 35:403–411. - PubMed

MeSH terms