. 2024 Sep 13:13:RP96394.
doi: 10.7554/eLife.96394.

Lymphoid origin of intrinsically activated plasmacytoid dendritic cells in mice

Affiliations

Lymphoid origin of intrinsically activated plasmacytoid dendritic cells in mice

Alessandra Machado Araujo et al. Elife. .

Abstract

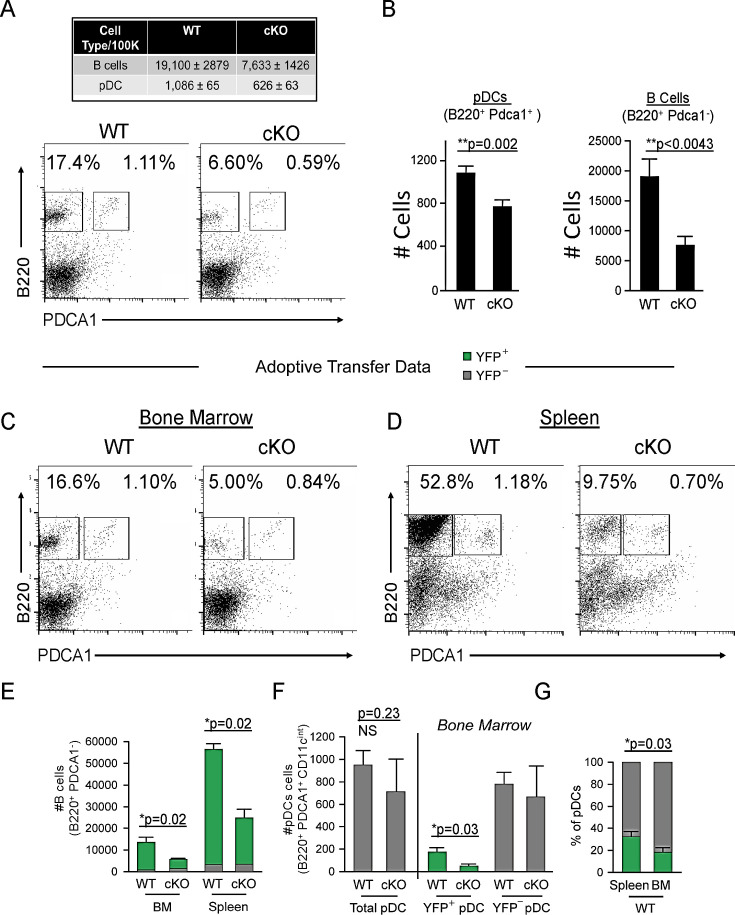
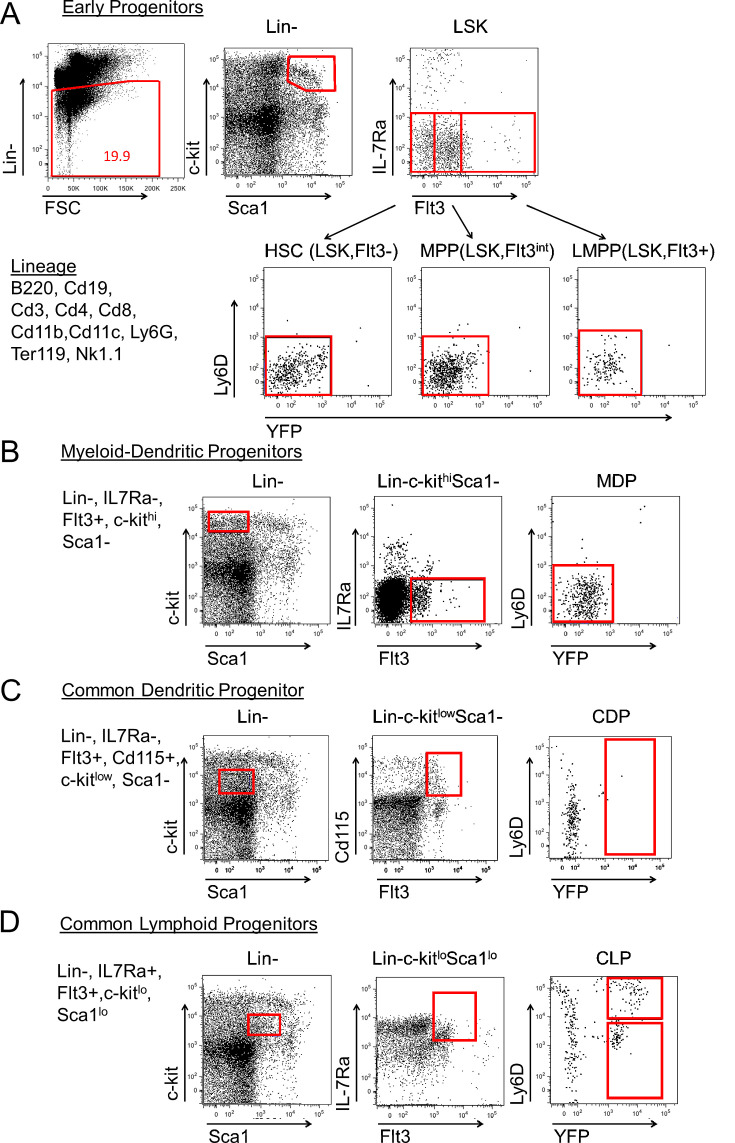
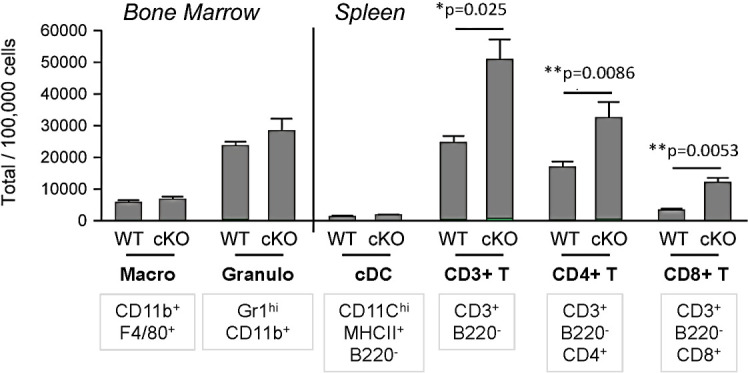
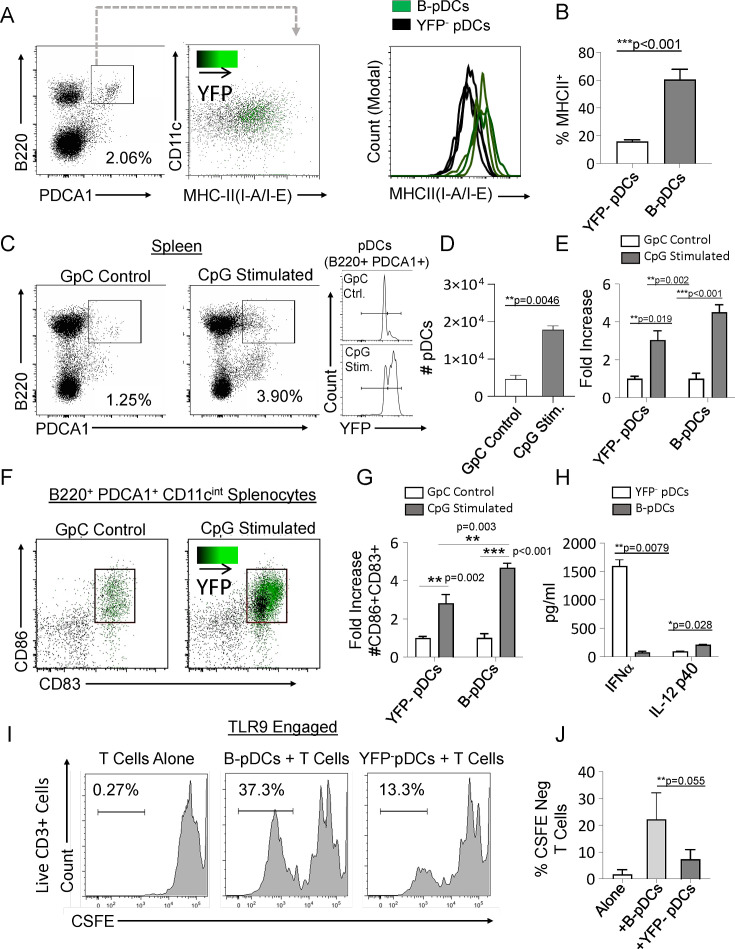
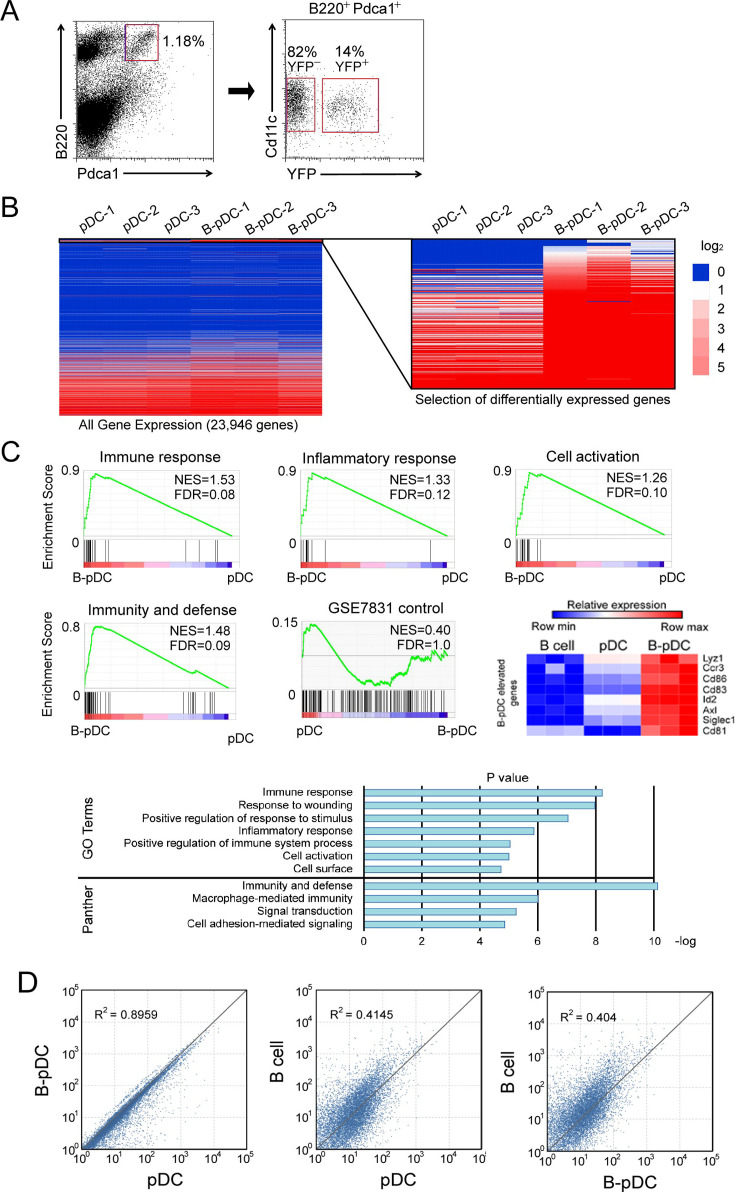
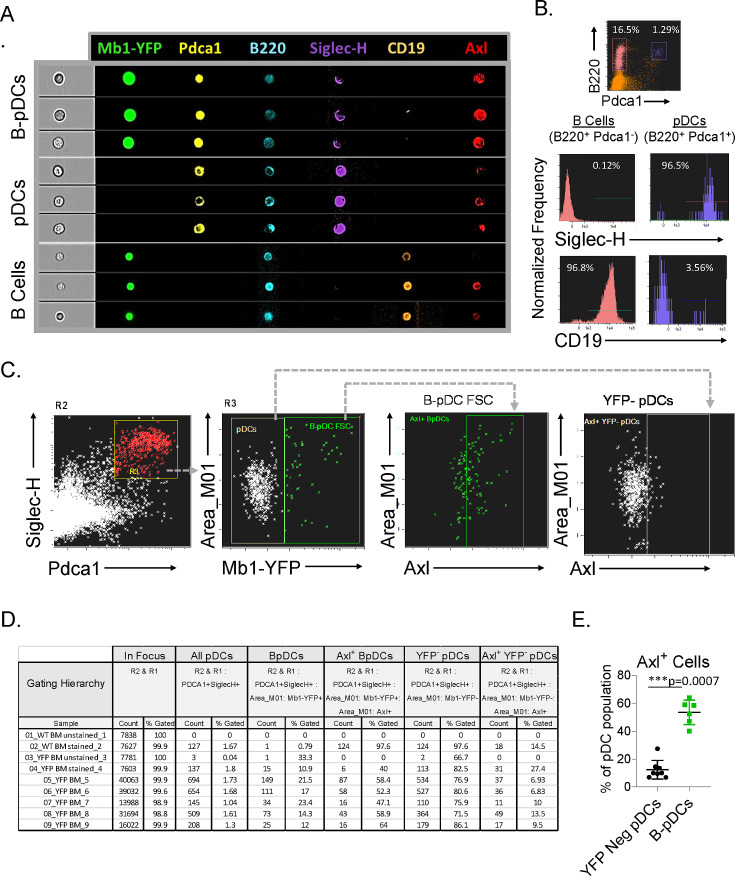
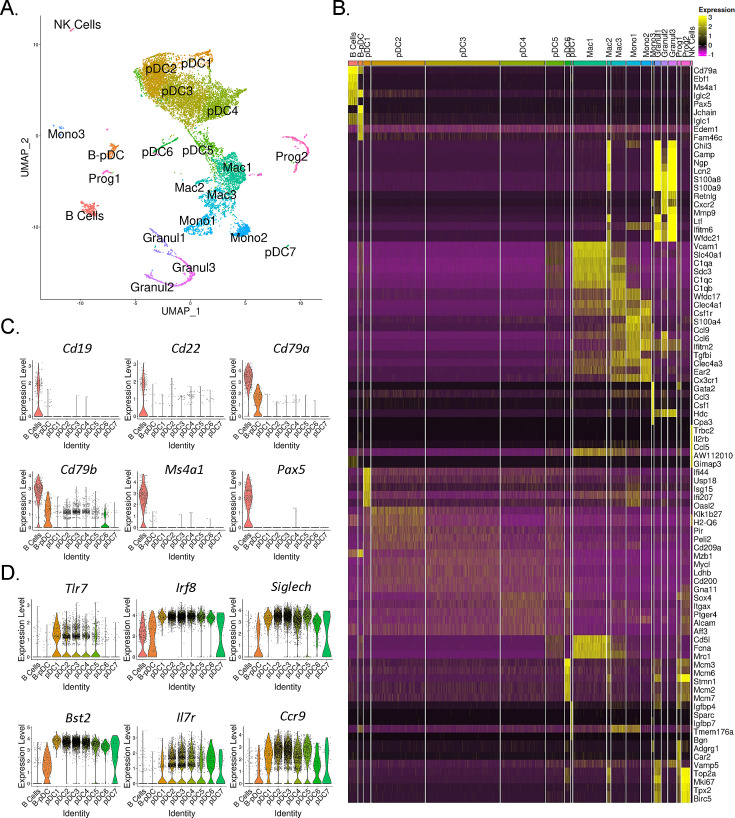
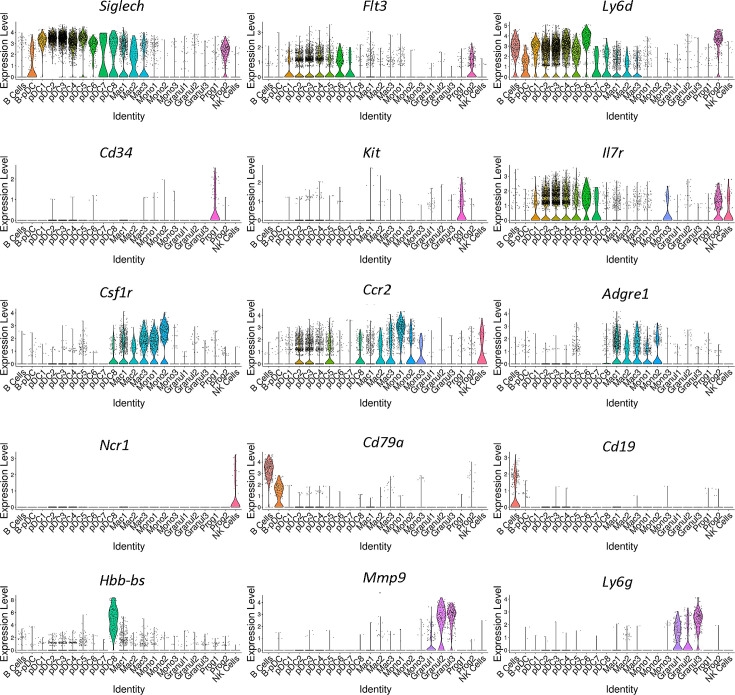
We identified a novel mouse plasmacytoid dendritic cell (pDC) lineage derived from the common lymphoid progenitors (CLPs) that is dependent on expression of Bcl11a. These CLP-derived pDCs, which we refer to as 'B-pDCs', have a unique gene expression profile that includes hallmark B cell genes, normally not expressed in conventional pDCs. Despite expressing most classical pDC markers such as SIGLEC-H and PDCA1, B-pDCs lack IFN-α secretion, exhibiting a distinct inflammatory profile. Functionally, B-pDCs induce T cell proliferation more robustly than canonical pDCs following Toll-like receptor 9 (TLR9) engagement. B-pDCs, along with another homogeneous subpopulation of myeloid-derived pDCs, display elevated levels of the cell surface receptor tyrosine kinase AXL, mirroring human AXL+ transitional DCs in function and transcriptional profile. Murine B-pDCs therefore represent a phenotypically and functionally distinct CLP-derived DC lineage specialized in T cell activation and previously not described in mice.

Keywords: B cells; CLPs; immunology; inflammation; mouse; plasmacytoid DCs.


Conflict of interest statement

AA, JD, KG, ZS, CR, ZH, BL, DO, JL, VI, LE, GG, GI, SY, HT No competing interests declared

Figures

Figure 1.
Figure 1.. Cd79a-Cre deletion of Bcl11a identifies a common lymphoid progenitor (CLP)-derived subset of plasmacytoid dendritic cells (pDCs).
(A) Representative FACS plots of pDC (gated as B220+ PDCA1+) and B cell (gated as B220+ PDCA1-) percentages in the bone marrow (BM) of Bcl11a F/F Cd79a-Cre mice (cKO) and littermate controls. (B) Quantification of pDC and B cell populations in the BM of Bcl11a F/F Cd79a-Cre mice (cKO) and littermate controls as cells/100,000 cells. (C–D) Flow cytometric analysis of BM and spleens of recipient mice 8 weeks post BM transplantation. BM was transferred from either BCL11A-sufficient reporter control mice (Cd79a-Cre-YFP) or BCL11A-deficient cKO mice (Bcl11a F/F Cd79a-Cre-YFP) into lethally irradiated C57BL/6J recipients. (E) B cell numbers after BM transplantation in BM and spleens of recipient mice. (F) pDC numbers after BM transplantation in BM and spleens of recipient mice. (G) Comparison of YFP+ pDC percentages in the spleen and BM of recipient mice post BM transplantation. Mann-Whitney t-tests were used for all statistical comparisons. Error bars=mean±s.d. The results are representative of two experiments each containing 3–4 mice per group.
Figure 1—figure supplement 1.
Figure 1—figure supplement 1.. Progenitor population analysis for Cd79a-cre driven YFP expression.
We analyzed YFP expression in bone marrow (BM) progenitors to determine when and where Cd79a-Cre is active (representative plots shown). (A) Lineage negative cells were analyzed to examine LSK hematopoietic progenitor (Lin-, Sca-1+, c-Kit+), MPP (LSK, Flt3int), and LMPP (LSK, Flt3hi) populations. Virtually all cells were YFP-. (B) Myeloid dendritic progenitors (MDPs; Lin-, IL7Rα-, Flt3+, c-kithi, Sca1-) and (C) common dendritic cell progenitors (CDPs; Lin-, IL7Ra-, Flt3+, c-kitlo, Sca1-, CD115+) were also negative for YFP expression, while (D) common lymphoid progenitors (CLPs; Lin-, IL7Ra+, Flt3+, c-kitlo, Sca1lo) contained YFP+ cells. The results are representative of three independent experiments each containing at least 3 mice per group.
Figure 1—figure supplement 2.
Figure 1—figure supplement 2.. Cell distributions in the spleen of adoptively transferred recipient mice.
Both Bcl11a F/F Cd79a-Cre+ and Cd79a-Cre-YFP adoptively transferred recipient mice reconstituted other splenic cell types in normal numbers, including bone marrow (BM) macrophages (CD11b+ F4/80+), granulocytes (Gr-1+ CD11b+), and splenic conventional dendritic cells (cDCs) (CD11c+ CD11b+ B220-). Total T cells (CD3+ B220-) as well as CD4+ and CD8+ subsets were significantly increased in number in proportion to B/pDC cell loss. Mann-Whitney t-tests were used for all statistical comparisons. The results are representative of two independent experiments each containing 3–4 mice per experimental group. Error bars = mean ± s.d.
Figure 2.
Figure 2.. Common lymphoid progenitor (CLP)-derived B-plasmacytoid dendritic cell (B-pDC) are licensed for T cell activation.
(A–B) Comparison of MHCII MFI in YFP + and YFP- pDCs from Cd79a-Cre-YFP reporter mice via flow cytometric analysis. (C–D) Cd79a-Cre-YFP mice were injected with 50 µg/mL (100 µL) of CpG:ODN or control GpC:ODN and analyzed via flow cytometry for splenic pDC numbers/100,000 cells. (E) Flow cytometry quantification of YFP- pDC and B-pDCs (YFP+) fold change in cell numbers upon CpG:ODN in vivo challenge. (F–G) Fold change in CD86+CD89+ cell numbers for each pDC population in mice restimulated with CpG:ODN. Difference in CD86+CD89+ cell numbers between stimulated B-pDCs and YFP- pDCs was also significant. (H) In vitro Toll-like receptor 9 (TLR9) engagement of B-pDC or pDC for ELISA against IFN-α orIL-12p40. (I) T cells were magnetically isolated from wildtype C57BL/6J mouse splenocytes using MACs columns, labeled with CSFE, and then cultured (2.5×10⁴/well) alone or with CpG:ODN activated B-pDCs or pDCs (5×10³/well) for 6 days. (J) The percentage of CFSE-negative CD3+ T cells in co-cultures were significantly higher in B-pDC compared to pDCs. Mann-Whitney t-tests were used for all statistical comparisons. Error bars = mean ± s.d. The results are representative of three independent experiments each containing at least 4 mice per group.
Figure 2—figure supplement 1.
Figure 2—figure supplement 1.. Transcriptional analysis identifies two populations of plasmacytoid dendritic cell (pDC) in mice: myeloid-derived classical pDC and common lymphoid progenitor (CLP)-derived B-pDC.
(A) Bone marrow pDC (B220+ PDCA1+ CD11cint CD11b-) were sorted based on expression of YFP. Four mice were pooled for each isolated RNA sample, for a total of three pDC and three B-pDC groups from 12 mice. (B) RNA-seq was performed for gene expression analysis of pDC vs. B-pDC and 220/23,946 genes (~1%, left) were significantly differentially expressed (q-value<0.05, right heatmap, Log2 expression difference displayed). (C) Gene set enrichment analysis (GSEA). Normalized enrichment score (NES) and false discovery rate q-values (FDR); FDR≤.25 is considered significant (Mootha et al., 2003). GO term or Panther-derived pathways identified by DAVID analysis of ~220 differentially expressed genes (DEGs) between the pDC and B-pDC subsets (Thomas et al., 2003; Liu et al., 2014). Among the top B-pDC DEGs were Lyz1, Ccr3, Cd86, Cd83, Id2, Axl, Siglec1, and Cd81. (D) Scatter plot comparisons of all genes with reads per kilobase of transcript, per million mapped reads (RPKM) >1. Correlations of pDC vs. B-pDC (R2 value = 0.8959), B cell vs. pDC (R2 value = 0.4145), and B cell vs. B-pDC (R2 value = 0.404) are indicated.
Figure 2—figure supplement 2.
Figure 2—figure supplement 2.. Imaging flow cytometry as a tool to quantify AXL expression in plasmacytoid dendritic cell (pDC) populations.
(A–B) Representative imaging flow cytometry of manuscript gating scheme used to define B cells and pDCs and histograms for SIGLEC-H, AXL, and CD19 in B cells and pDCs. (C) Representative imaging flow cytometry plots of AXL+ pDCs (here alternatively gated as SIGLEC-H+ PDCA1+) in Cd79a-Cre-YFP reporter mice bone marrow cells (n=5). (D) Complete statistics file generated with IDEAS for ImageStream X analysis including non-stained wildtype controls. (E) Comparison of AXL expression in YFP- and YFP+ (B-pDCs). The results are representative of two independent experiments each containing at least 3 mice per group. Mann-Whitney tests were used as statistical method.
Figure 3.
Figure 3.. Single-cell RNA-seq analysis of mouse PDCA1+ bone marrow cells.
(A) UMAP generated by Seurat clustering analysis. Cluster identities were assigned using the top 5 consensus CIPR (Cluster Identity Predictor) identity scores. (B) Heatmap of the top 5 differentially expressed genes (DEGs) from each cluster. After Seurat clustering, cell reads were subsetted to include only cells classified as B cells, plasmacytoid dendritic cells (pDCs), and B-pDCs. DEGs were generated for the new data subset and markers associated with (C) mature B cells and (D) classical pDCs were plotted as violin plots.
Figure 3—figure supplement 1.
Figure 3—figure supplement 1.. Confirmation of unbiasedly identified cell cluster identities.
Seurat generated violin plots of genes associated with distinct cell populations including mature B cells, plasmacytoid dendritic cells (pDCs), granulocytes, pre-pDCs, NK cells, monocytes, macrophages, and myeloid progenitor cells. Plot identities were initially determined by running the package CIPR (Cluster Identity Predictor).
Figure 4.
Figure 4.. Single-cell trajectory analysis of Prog1, B cells, and B-plasmacytoid dendritic cell (B-pDC) clusters.
(A) Single cells belonging to clusters Prog1, B cells, and B-pDCs were ordered and plotted as a function of pseudotime based on uniquely expressed markers using the unsupervised Monocle dpFeature. Cluster Prog1 was classified as the root of the trajectory given its high expression of pre-pro B cell and stem cell associated markers. Differentially expressed genes (DEGs) of interest were plotted as a function of pseudotime in Prog1 (B), B cells (C), or pDCs (D) using Monocle. Branch Y_112 represents the expression kinetic trend of the B-pDC cluster (green), while branch Y_83 represents the expression kinetic trend in expression of B cells according to branched expression analysis modeling, or BEAM.
Figure 4—figure supplement 1.
Figure 4—figure supplement 1.. Expression of early B cell receptor genes in B-plasmacytoid dendritic cells (B-pDCs).
(A) Monocle was used to plot select early B cell genes as function of branched pseudotime for Prog1, B cells, and B-pDC populations. (B) Plasma cell contamination in Cd79a+ pDCs (B220+ PDCA1+) was ruled out by flow cytometric analysis of TACI and CD138 in bone marrow (BM) of 6 C57BL/6J mice.
Figure 5.
Figure 5.. Identification of Axl+ noncanonical plasmacytoid dendritic cells (pDCs) in mice.
(A) Violin plots depicting relative expression of conserved ‘non canonical AXL+ DCs’ associated markers in mouse pDC clusters. (B) Bone marrow (BM) scRNA-seq data was subsetted to include only pDCs and Prog2 subsets. We used Monocle3 for partition-based learning of cell developmental trajectories. Louvain partitions were generated from single-cell reads and their developmental trajectory was inferred using SimplePPT (top right quadrant). Pseudotime across clusters is shown in the lower bottom quadrant.

Update of

References

    1. Alcántara-Hernández M, Leylek R, Wagar LE, Engleman EG, Keler T, Marinkovich MP, Davis MM, Nolan GP, Idoyaga J. High-dimensional phenotypic mapping of human dendritic cells reveals interindividual variation and tissue specialization. Immunity. 2017;47:1037–1050. doi: 10.1016/j.immuni.2017.11.001. - DOI - PMC - PubMed
    1. Björck P, Kincade PW. CD19+ pro-B cells can give rise to dendritic cells in vitro. Journal of Immunology. 1998;161:5795–5799. - PubMed
    1. Cao J, Spielmann M, Qiu X, Huang X, Ibrahim DM, Hill AJ, Zhang F, Mundlos S, Christiansen L, Steemers FJ, Trapnell C, Shendure J. The single-cell transcriptional landscape of mammalian organogenesis. Nature. 2019;566:496–502. doi: 10.1038/s41586-019-0969-x. - DOI - PMC - PubMed
    1. Cisse B, Caton ML, Lehner M, Maeda T, Scheu S, Locksley R, Holmberg D, Zweier C, den Hollander NS, Kant SG, Holter W, Rauch A, Zhuang Y, Reizis B. Transcription factor E2-2 is an essential and specific regulator of plasmacytoid dendritic cell development. Cell. 2008;135:37–48. doi: 10.1016/j.cell.2008.09.016. - DOI - PMC - PubMed
    1. Di Domizio J, Cao W. Fueling autoimmunity: type I interferon in autoimmune diseases. Expert Review of Clinical Immunology. 2013;9:201–210. doi: 10.1586/eci.12.106. - DOI - PMC - PubMed

Associated data