. 2024 Nov 15;30(22):5166-5179.
doi: 10.1158/1078-0432.CCR-24-1166.

Epigenome Reprogramming Through H3K27 and H3K4 Trimethylation as a Resistance Mechanism to DNA Methylation Inhibition in BRAFV600E-Mutated Colorectal Cancer

Affiliations

Epigenome Reprogramming Through H3K27 and H3K4 Trimethylation as a Resistance Mechanism to DNA Methylation Inhibition in BRAFV600E-Mutated Colorectal Cancer

Hey Min Lee et al. Clin Cancer Res. .

Abstract

Purpose: BRAFV600E-mutated colorectal cancer exhibits a strong correlation with DNA hypermethylation, suggesting that this subgroup of tumors presents unique epigenomic phenotypes. Nonetheless, 5-azacitidine, which inhibits DNA methyltransferase activity, is not efficacious in BRAFV600E colorectal cancer in vivo.

Experimental design: We randomized and treated mice implanted with patient-derived tumor xenografts harboring BRAFV600E mutation with control, 5-azacitidine, vemurafenib (BRAF inhibitor), or the combination. Comprehensive epigenomic profiling was conducted on control and 5-azacitidine-treated tumor samples, including DNA methylation, histone modifications, chromatin accessibility, and gene expression. Combinations of epigenetic agents were explored in preclinical BRAFV600E colorectal cancer models.

Results: A profound reduction of DNA methylation levels upon 5-azacitidine treatment was confirmed, however, transcriptional repression was not relieved. This study unbiasedly explored the adaptive engagement of other epigenomic modifications upon 5-azacitidine treatment. A loss of histone acetylation and a gain of histone methylations, including H3K27 and H3K4 trimethylation, were observed around these hypomethylated regions, suggesting the involvement of polycomb repressive complex (PRC) activity around the genome with loss of DNA methylation, therefore maintaining the repression of key tumor-suppressor genes. Combined inhibition of PRC activity through EZH2 inhibition with 5-azacitidine treatment additively improved efficacies in BRAFV600E colorectal cancer cells.

Conclusions: In conclusion, DNA hypomethylation by 5-azacitidine exhibits a close association with H3K27me3 and PRC activity in BRAFV600E colorectal cancer, and simultaneous blockade of DNA methyltransferase and EZH2 holds promise as a potential therapeutic strategy for patients with BRAFV600E-mutated colorectal cancer.


Figures

Figure 1.
Figure 1.. Higher DNA methylation is associated with BRAFV600E mutation, yet restricted to improve efficacy with a combined inhibition of DNMT and BRAF.
A. The average frequency of differentially methylated probes (p=1.59e-07/ FDR=1e-4) distributed by the degree of methylation (β-value) colored by BRAFV600E-mutated or BRAF wild-type CIMP-H CRC tumors. B. Bayes factor (BF) distribution from the epigenetic CRISPR gene library screening of two BRAFV600E CRC cell lines (RKO and HT29) highlighting their dependency on DNMTs (DNMT1, DNMT3A, DNMT3B). C. Cell viability assays with either vemurafenib (BRAF inhibitor), 5-azacitidine (DNMT inhibitor), or combined treatment in BRAFV600E CRC cell lines. Three conventional cell lines (RKO, HT29, COLO205) and three PDX-derived cell lines (B1003, C0999, BB8140) were used. D. Tumor volume changes in two BRAFV600E CRC PDX models treated with vehicle, 5-azacitidine, vemurafenib, or 5-azacitidine plus vemurafenib (combo).
Figure 2.
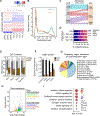
Figure 2.. 5-azacitidine treatment induces global demethylation, with limited reactivation of tumor suppressor genes in B1003 BRAFV600E CRC PDX model.
A. Unsupervised hierarchical clustering and heatmap representation of control and 5-azacitidine (AZA) treated samples (n=3 and 4, respectively) using 450K methylation sites. B. Density plot showing global methylation level (β-value) enrichment across control (CON) and 5-azacitidine (AZA) treated samples. A value of 0 signifies hypomethylation while approaching 1 indicates hypermethylation. C. Sankey diagram illustrating methylation probes in control (CON) and 5-azacitidine (AZA) treated samples for the associated methylation level. High: β-value>0.6, Mid (intermediate): 0.6≥β-value>0.1, Low: 0.1≥β-value. D. Distribution of CpG island (CGI), shore (>2kb from CGI), shelf (2–4kb from CGI), and open sea (>4kb) among total methylation probes or probes with lower/medium methylation levels in 5-azacitidine (Aza) treated samples compared to control (CON). E. Box plot of global methylation level (β-value) enrichment by proximity to CpG islands in control (CON) and 5-azacitidine (AZA) treated samples. F. Degree of methylation (β-value) in most variant probes of classic CIMP marker genes, including CACNA1G, TIMP3, RUNX3, MLH1 in control (CON) and 5-azacitidine (AZA) treated samples. ***p<0.001, ****p<0.0001. G. Proportion of regulatory regions of treatment-induced hypomethylated sites. H. Volcano plot of genes exhibiting either upregulated (log2FC>0.5) or downregulated (log2FC<0.5) expression found in without hypomethylation or treatment-induced hypomethylated regions. I. Gene set enrichment analysis (GSEA) using Hallmark gene sets colored by normalized enrichment score (NES) and dot size by adjusted p-values.
Figure 3.
Figure 3.. Enhanced enrichment of H3K27me3 or H3K4me3 by 5-azacitidine treatment modulated the Wnt signaling and transcriptional activation.
A. Relative abundance of H3K27 trimethylation by mass spectrometry in two BRAFV600E-mutated CRC cell lines (RKO and B1003) treated by either DMSO control (CON), azacitidine (AZA), or encorafenib (ENC) for 72 hours. *p<0.05, ***p<0.001, ****p<0.0001. B. ChromHMM represents emission plots for 10 chromatin states. Each row represents an annotated chromatin state in B1003 BRAFV600E-mutated CRC PDX model. The blue gradient represents the intensity of the signals from a particular histone modification. Columns represent each histone mark. C. Fold enrichment change of chromatin states from control to azacitidine-treated samples. D. The number of differentially bound H3K27me3 peaks in control (CON) and 5-azacitidine (AZA) treated B1003 PDX tumors. E. The number of differentially bound H3K4me3 peaks in control (CON) and 5-azacitidine (AZA) treated B1003 PDX tumors. F. Heatmap of genes with normalized read counts of H3K27me3 in control (CON) and 5-azacitidine (AZA) treated B1003 PDX samples. G. Heatmap of genes with normalized read counts of H3K4me3 in control and 5-azacitidine (AZA) treated B1003 PDX samples. H. Top pathways enriched with upregulated H3K27me3 peaks upon 5-azacitidine (AZA) treatment. I. Top pathways from gene ontology (GO; MF) enriched with upregulated H3K27me3 peaks upon 5-azacitidine treatment. J. Top pathways enriched with upregulated H3K4me3 peaks upon 5-azacitidine (AZA) treatment. K. Top pathways from gene ontology (GO; MF) enriched with upregulated H3K4me3 peaks upon 5-azacitidine treatment.
Figure 4.
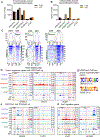
Figure 4.. Abnormal Increase in trimethylation of either H3K27 or H3K4 around tumor suppressor genes or 5mC-regulated genes upon azacitidine treatment.
A. The total number of peaks of histone marks (H3K27ac, H3K4me3, H3K27me3, H3K9me3) and open chromatins (ATAC) enriched around hypomethylated regions on control versus 5-azacitidine treated samples. B. The number of unique peaks of histone marks (H3K27ac, H3K4me3, H3K27me3, H3K9me3) and open chromatins (ATAC) enriched around hypomethylated regions on control versus 5-azacitidine treated samples. C. Heatmap and enrichment plot of differentially bound peaks for histone marks H3K27ac, H3K4me3, and H3K27me3 around hypomethylated regions in control versus 5-azacitidine-treated samples. D. IGV snapshot of histone marks ChIP-seq (H3K27ac, H3K4me3, H3K27me3, H3K9me3) and ATAC-seq on control (CON) and 5-azacitidine-treated (AZA) tumor samples around tumor suppressor genes (VANGL2, DACT2, GCM2) highlighted with differentially hypomethylated regions (DM) and probes (DMP). E. SMAD4 and GCM2 motifs around differentially bound H3K27me3 peaks around hypomethylated regions after 5-azacitidine treatment. F. IGV snapshot around genes (NR2F2, FLRT1) with both increased H3K27me3 and H3K4me3 around differentially hypomethylated regions (DM) and probes (DMP) upon 5-azacitidine treatment. G. IGV snapshot of genes around 5mC-regulated genes (EVX1, HOTAIR) with increased H3K27me3 around differentially hypomethylated regions (DM) and probes (DMP) upon 5-azacitidine treatment.
Figure 5.
Figure 5.. Additive inhibition of BRAFV600E CRC cell growth through combined PRC inhibitors with 5-azacitidine.
A. Cell viability (relative to DMSO control) 72 hours after treatment by either DNMSO, 5-azacitidine (AZA; 1μM), EPZ-6438 (EPZ; 60μM), GSK126 (GSK; 25μM), PRT4165 (PRT; 20μM), or combinations of inhibitors with 5-azacitidine in RKO cell line. B. Cell viability assay with different combined treatments with 5-azacitidine in B1003 cell line. C. Well images of RKO or B1003 cell colonies after 10 days of treatment. D. Colony formation assay with different combinational treatments with 5-azacitidine in RKO or E. B1003 cell lines for 10 days (5-azacitidine (0.1μM); EPZ-6438 (30μM), GSK126 (3μM), PRT4165 (10μM)). **p<0.01, ***p<0.001, ****p<0.0001. F. Relative expression of tumor suppressor genes (VANGL2 and DACT2) compared to DMSO-treatment with normalization to a reference gene (GAPDH) in two BRAFV600E CRC cell lines (RKO and B1003) 72 hours after treatment by either DMSO, 5-azacitidine (1μM), EPZ-6438 (60μM), GSK126 (25μM), PRT4165 (20μM), or combinations of inhibitors with 5-azacitidine. Maximum cycles (40 cycles) were used for those not detectable to calculate relative expressions. ****p<0.0001, # gene not detected.

References

    1. Siegel RL, Giaquinto AN, Jemal A. Cancer statistics, 2024. CA Cancer J Clin. 2024;74(1):12–49. - PubMed
    1. Siegel RL, Wagle NS, Cercek A, Smith RA, Jemal A. Colorectal cancer statistics, 2023. CA Cancer J Clin. 2023;73(3):233–54. - PubMed
    1. Baylin SB, Jones PA. Epigenetic Determinants of Cancer. Cold Spring Harb Perspect Biol. 2016;8(9):a019505. - PMC - PubMed
    1. Feinberg AP, Tycko B. The history of cancer epigenetics. Nat Rev Cancer. 2004;4(2):143–53. - PubMed
    1. Goel A, Boland CR. Epigenetics of Colorectal Cancer. Gastroenterology. 2012;143(6):1442–1460.e1. - PMC - PubMed

MeSH terms