

Androgen Deprivation Therapy Drives a Distinct Immune Phenotype in Localized Prostate Cancer
- PMID: 39269310
- PMCID: PMC11905119
- DOI: 10.1158/1078-0432.CCR-24-0060
Androgen Deprivation Therapy Drives a Distinct Immune Phenotype in Localized Prostate Cancer
Abstract
Purpose: Androgen deprivation therapy (ADT) remains the backbone of prostate cancer treatment. Beyond the suppression of testosterone and tumor cell growth, emerging evidence suggests that ADT also modulates the immune tumor microenvironment. However, a more precise understanding of the timing and intricacies of these immunologic shifts is needed.
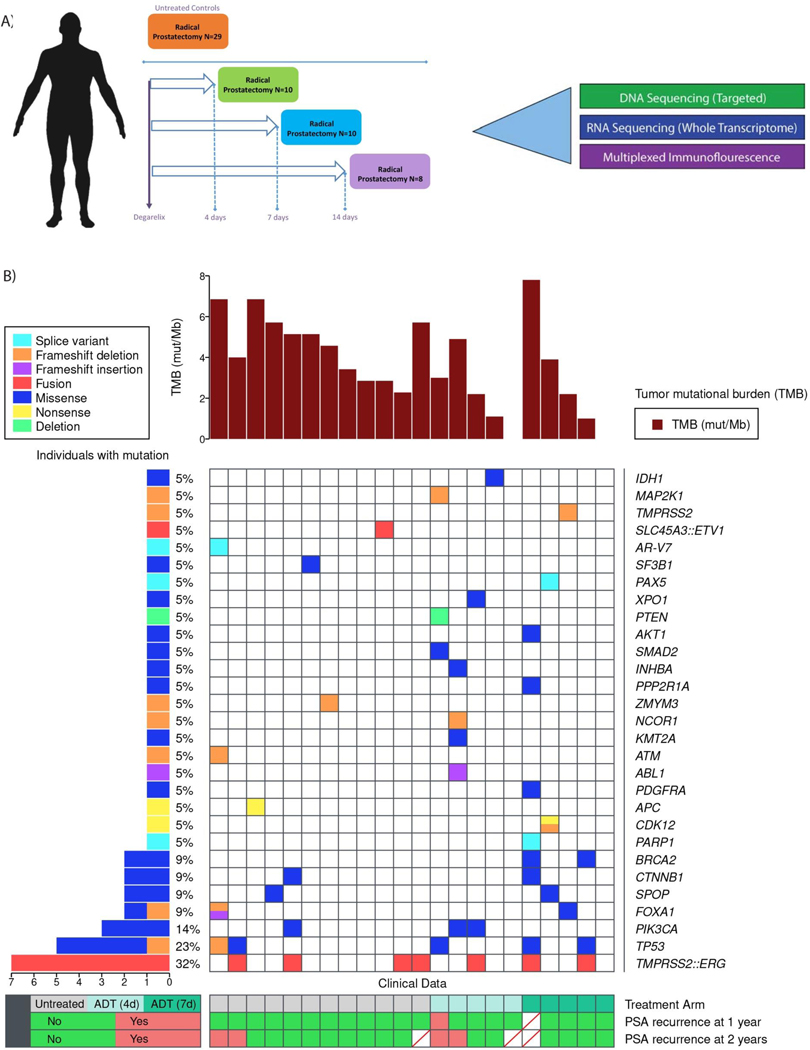
Experimental design: In this study, we analyzed 49 primary prostate cancers, comparing those surgically removed either without treatment or following treatment with degarelix at 4, 7, and 14 days before surgery. Utilizing next-generation DNA and RNA sequencing and multiplexed immunofluorescence, we examined alterations in immune phenotypes in the presence or absence of ADT.
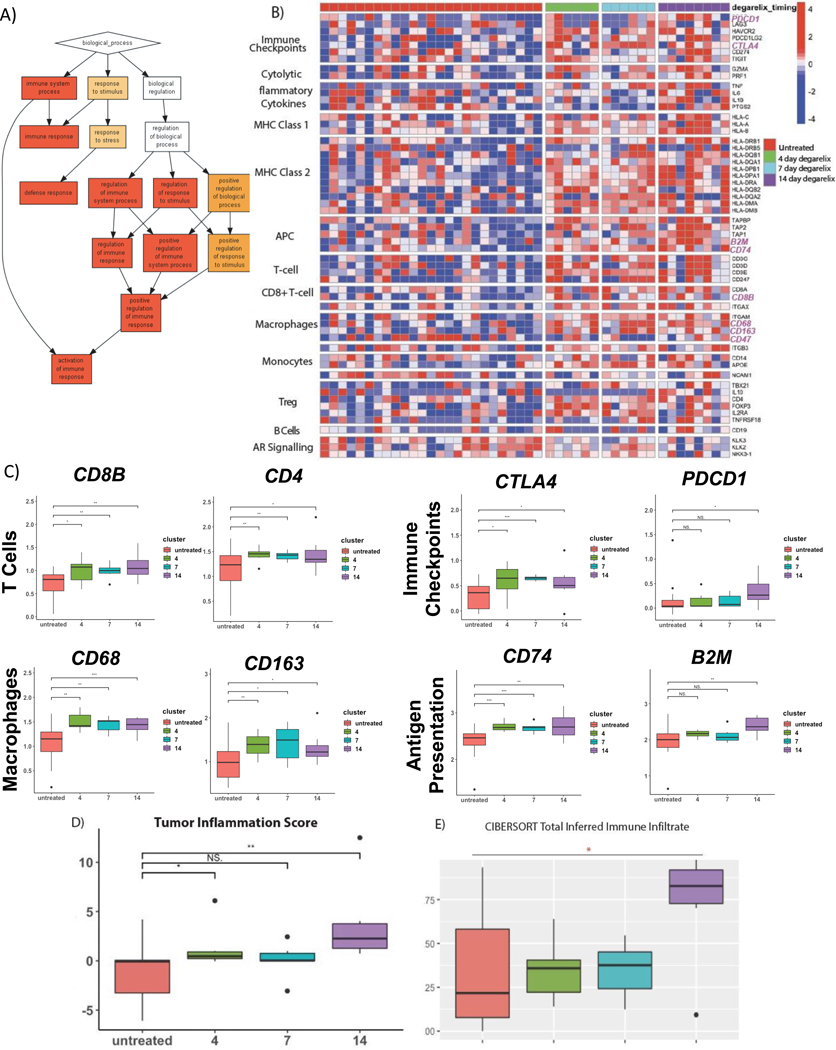
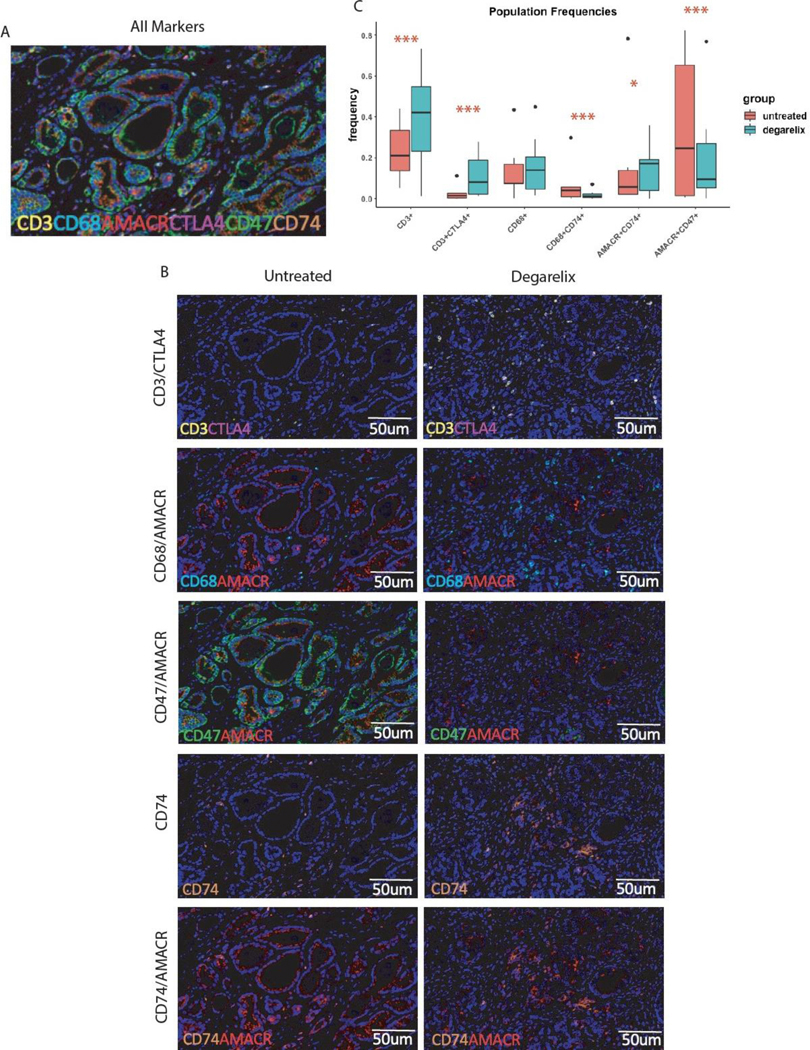
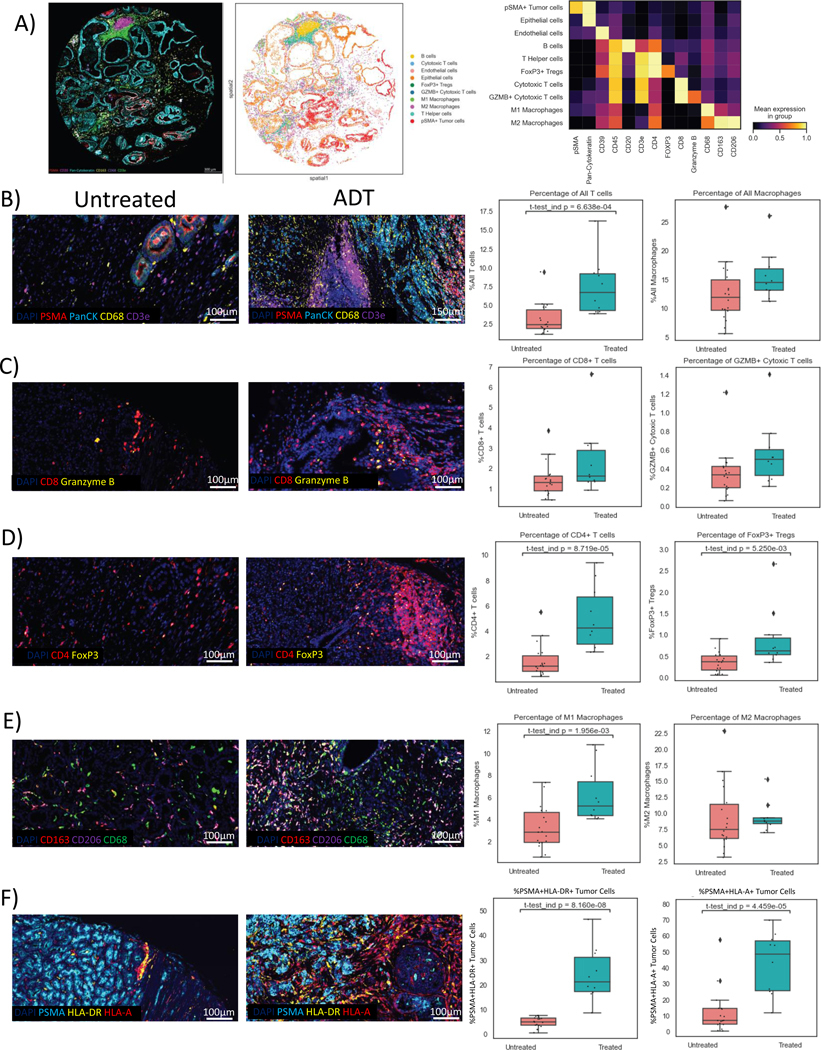
Results: Our findings reveal that ADT rapidly transforms the typically bland prostate tumor microenvironment into an inflamed environment within days. Notably, we observed an increase in activated CD8 T cells along with an increase in suppressive regulatory T cells (Treg). We also found an expansion of the myeloid compartment, particularly proinflammatory M1-like tumor-associated macrophages. Intriguingly, discernable changes which have not previously been described also occurred in tumor cells, including upregulation of antigen presentation by MHC classes I and II and, unexpectedly, a decrease in the "do not eat me" signal CD47.
Conclusions: These observations underscore the critical role of timing and disease context in order to optimize the therapeutic efficacy of immune modulators combined with androgen ablation, for which the presurgical neoadjuvant setting may be ideal. Our findings warrant future prospective validation, which is currently underway.
©2024 American Association for Cancer Research.
Conflict of interest statement
This study was supported by the Prostate Cancer Foundation Grant No. 19YOUN27 and the Weill Cornell Medicine SPORE Developmental Research Program Grant No. 1P50CA211024-01A1 (P50), Memorial Sloan Kettering Cancer Center NIH SPORE Grant No. P50-CA92629, Memorial Sloan Kettering Cancer Center NIH/NCI Cancer Center Support Grant No. P30 CA008748, Johns Hopkins NIH SPORE Grant No. P50-CA58236, Johns Hopkins NIH/NCI Cancer Center Support Grant No. P30 CA0006973, and U.S. Department of Defense Prostate Cancer Research Program (PCRP) Prostate Cancer Biospecimen Network Site Grant No. W81XWH-18-2-0015.
M.C. Dallos serves as a paid consultant for Bayer, Bristol-Myers Squibb, and Sanofi outside the submitted work, and has received research funding from Bristol-Myers Squibb and Novartis. D.H. Aggen reports other from Boehringer Ingelheim outside the submitted work, as well as a University of Illinois-issued patent, licensed, and with royalties paid from AbbVie. K. A. Autio reports grants from Merck Sharp & Dohme Corp., a subsidiary of Merck & Co Inc., Kenilworth, NJ, USA, GSK, Pfizer, Eli Lilly, Amgen, and AstraZeneca. A.M. De Marzo serves as consultant for Cepheid Inc., receives sponsored research funding from Janssen R&D Inc., and serves as a consultant to Merck Inc. E.S. Antonarakis reports grants from Janssen, Johnson & Johnson, Sanofi, Bristol Myers Squibb, Pfizer, AstraZeneca, Novartis, Curium, Constellation, ESSA, Celgene, Merck, Bayer, and Clovis; personal fees from Janssen, Astellas, Sanofi, Dendreon, Bayer, Bristol Myers Squibb, Amgen, ESSA, Constellation, Blue Earth, Exact Sciences, Invitae, Curium, Pfizer, Merck, AstraZeneca, Clovis, and Eli Lilly; and is a co-inventor of patented AR-V7 technology that has been licensed to Qiagen. H.I. Scher reports personal fees from Asterias Biotherapeutics, Bayer, Pfizer Inc., Sun Pharmaceuticals Industries Inc., and WCG; non-financial support from Amgen, ESSA Pharma Inc., Janssen Research & Development LLC, Janssen Biotech Inc., and Menarini Silicon Biosystems; and grants from Epic Sciences, Illumina Inc., Janssen, Menarini Silicon Biosystems, and Thermo Fisher Scientific outside the submitted work; in addition, H.I. Scher has a patent 10,736,972 issued and licensed to Elucida Oncology, a patent for 16/463,865 pending and licensed to Elucida Oncology, and a patent for 16/769,501 pending and licensed to Elucida Oncology. C.G. Drake is an employee of Janssen Oncology. D.E. Rathkopf reports non-financial support from Janssen (uncompensated consultant, PI clinical trials), grants from Genentech (Stand Up to Cancer-Genentech Catalyst Research Award), and non-financial support from Taiho (PI, clinical trial), Tracon (PI, clinical trial), Myovant (uncompensated consultant), Bayer (uncompensated consultant), AstraZeneca (uncompensated consultant), Celgene (PI, clinical trial), Phosplatin Therapeutics (PI, clinical trial), and Roivant (uncompensated consultant). No disclosures were reported by the other authors.
Figures
Comment in
-
Will phenotype help guide immunotherapy in prostate cancer?Transl Cancer Res. 2025 Apr 30;14(4):2170-2174. doi: 10.21037/tcr-2024-2477. Epub 2025 Apr 21. Transl Cancer Res. 2025. PMID: 40386267 Free PMC article. No abstract available.
-
Exploiting pre-dormancy tumor immune microenvironment induced by androgen deprivation in prostate cancer.Transl Cancer Res. 2025 Apr 30;14(4):2183-2187. doi: 10.21037/tcr-2024-2683. Epub 2025 Apr 15. Transl Cancer Res. 2025. PMID: 40386281 Free PMC article. No abstract available.
References
-
- Sharma P, Pachynski RK, Narayan V, Flechon A, Gravis G, Galsky MD et al. Initial results from a phase II study of nivolumab (NIVO) plus ipilimumab (IPI) for the treatment of metastatic castration-resistant prostate cancer (mCRPC; CheckMate 650). Journal of Clinical Oncology 2019; 37: 142–142.
-
- Fizazi K, Drake CG, Beer TM, Kwon ED, Scher HI, Gerritsen WR et al. Final Analysis of the Ipilimumab Versus Placebo Following Radiotherapy Phase III Trial in Postdocetaxel Metastatic Castration-resistant Prostate Cancer Identifies an Excess of Long-term Survivors. Eur Urol 2020; 78: 822–830. - PMC - PubMed
-
- Zhao SG, Lehrer J, Chang SL, Das R, Erho N, Liu Y et al. The Immune Landscape of Prostate Cancer and Nomination of PD-L2 as a Potential Therapeutic Target. J Natl Cancer Inst 2019; 111: 301–310. - PubMed
MeSH terms
Substances
Grants and funding
LinkOut - more resources
Full Text Sources
Medical
Research Materials
