. 2024 Nov 1;327(5):H1210-H1229.
doi: 10.1152/ajpheart.00413.2024. Epub 2024 Sep 13.

pH-sensing GPR68 inhibits vascular smooth muscle cell proliferation through Rap1A

Affiliations

pH-sensing GPR68 inhibits vascular smooth muscle cell proliferation through Rap1A

Madison D Williams et al. Am J Physiol Heart Circ Physiol. .

Abstract

Phenotypic transformation of vascular smooth muscle (VSM) from a contractile state to a synthetic, proliferative state is a hallmark of cardiovascular disease (CVD). In CVD, diseased tissue often becomes acidic from altered cellular metabolism secondary to compromised blood flow, yet the contribution of local acid/base imbalance to the disease process has been historically overlooked. In this study, we examined the regulatory impact of the pH-sensing G protein-coupled receptor GPR68 on vascular smooth muscle (VSM) proliferation in vivo and in vitro in wild-type (WT) and GPR68 knockout (KO) male and female mice. Arterial injury reduced GPR68 expression in WT vessels and exaggerated medial wall remodeling in GPR68 KO vessels. In vitro, KO VSM cells showed increased cell-cycle progression and proliferation compared with WT VSM cells, and GPR68-inducing acidic exposure reduced proliferation in WT cells. mRNA and protein expression analyses revealed increased Rap1A in KO cells compared with WT cells, and RNA silencing of Rap1A reduced KO VSM cell proliferation. In sum, these findings support a growth-inhibitory capacity of pH-sensing GPR68 and suggest a mechanistic role for the small GTPase Rap1A in GPR68-mediated VSM growth control. These results shed light on GPR68 and its effector Rap1A as potential targets to combat pathological phenotypic switching and proliferation in VSM.NEW & NOTEWORTHY Extracellular acidosis remains an understudied feature of many pathologies. We examined a potential regulatory role for pH-sensing GPR68 in vascular smooth muscle (VSM) growth in the context of CVD. With in vivo and in vitro growth models with GPR68-deficient mice and GPR68 induction strategies, novel findings revealed capacity of GPR68 to attenuate growth through the small GTPase Rap1A. These observations highlight GPR68 and its effector Rap1A as possible therapeutic targets to combat pathological VSM growth.

Keywords: GPR68; Rap1A; acidosis; proliferation; vascular smooth muscle.


Conflict of interest statement

No conflicts of interest, financial or otherwise, are declared by the authors.

Figures

None
Graphical abstract
Figure 1.
Figure 1.
In vivo injury reduces arterial GPR68 protein expression. In male and female wild-type (WT) mice, left common carotid arteries (LCAs) were either sham-operated or ligated just proximal to the bifurcation, and afterward, 24-h LCAs were harvested and homogenates were prepared for Western blot analysis of GPR68 protein expression. A: representative Western blot for GPR68 in sham-operated and injured male (M) and female (F) LCA homogenates along with the total protein blot from the same gel. B: densitometry on aggregated male and female arterial homogenates revealed significantly reduced (unpaired t test, P < 0.0001) GPR68 expression (normalized to total protein) in injured arterial lysates compared with sham lysates after 24 h. C: data disaggregated by sex showed significant reduction in GPR68 expression with injury in both male arteries (two-way ANOVA, injury effect, P < 0.0001; Tukey’s post hoc, P = 0.0011) and female arteries (two-way ANOVA, Tukey’s post hoc, P = 0.0047) compared with respective sham controls; however, sex-disaggregated data failed to reveal sex-based differences in GPR68 expression in both sham and injured cohorts; n = 10 sham mice (5 males, 5 females) and n = 10 injured mice (6 males, 4 females). **P < 0.01; ****P < 0.0001.
Figure 2.
Figure 2.
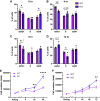
Determination of genotype and phenotype of wild-type (WT) and GPR68 knockout (KO) mice. A: thoracic aorta-derived primary vascular smooth muscle (VSM) cells from age-/weight-matched male and female WT and GPR68 KO mice were subjected to RT-qPCR for evaluation of GPR68 mRNA expression. KO VSM cells failed to show detectable levels of GPR68 mRNA transcript compared with WT VSM cell controls (normalized to GAPDH); n = 3 replicates in quadruplicate (n = 3 replicates in duplicate each for male and female); unpaired t test, P = 0.0067. B: confirmation of genetic makeup of male and female WT and KO mice using RT-qPCR (Transnetyx, Cordova, TN). Tail snips showed complete absence of GPR68 mRNA expression in KO compared with WT tissues [measured as relative copy number (RCN), normalized to c-JUN; unpaired t test, P < 0.0001]. During genetic modification of the KO mice, a neomycin (Neo) cassette was inserted as a positive control, and abundant Neo gene expression was evident in KO tail snips compared with WT controls (RCN, normalized to c-JUN; unpaired t test, P < 0.0001); n = 8 WT (4 males, 4 females); n = 10 KO (5 males, 5 females). Western blots for GPR68 protein expression in WT and KO VSM cells: blots for GPR68 along with total protein (C) and quantification of GPR68 protein expression in WT and KO VSM cells (D). KO samples showed no detectable levels of GPR68 protein expression compared with WT samples (unpaired t test, P < 0.0001) n = 6/group for C and D. **P < 0.01; ****P < 0.0001.
Figure 3.
Figure 3.
In vivo arterial injury leads to exaggerated medial vascular smooth muscle (VSM) growth in knockout (KO) mice. Sham-operated or ligation-injured male and female mouse left common carotid arteries (LCAs) were harvested after 4 wk. A–D: representative photomicrographs of sham and injured LCA cross sections from wild-type (WT) and KO mice. E–G: histomorphometry revealed significantly increased medial wall (MW) thickness (E; two-way ANOVA, interaction effect, P = 0.0016; genotype effect, P = 0.0122; injury effect, P < 0.0001) in WT (Tukey’s post hoc, P = 0.0142) and KO (Tukey’s post hoc, P < 0.0001) vessels following injury. MW thickness was significantly greater in injured KO vessels compared with injured WT vessels (Tukey’s post hoc, P = 0.0015); n = 6 WT, 5–8 KO vessels. F: sham KO vessels had slightly greater MW area than sham WT vessels (two-way ANOVA, interaction effect, P = 0.0326; genotype effect, P < 0.0001; injury effect, P = 0.0085; Tukey’s post hoc, P = 0.1), and MW area increased in injured KO vessels compared with both sham KO vessels (Tukey’s post hoc, P = 0.0061) and injured WT vessels (Tukey’s post hoc, P = 0.0002); n = 6 WT, 6 or 7 KO vessels/group. G: densitometry showed significantly increased MW elastin content (normalized to MW area; two-way ANOVA, interaction effect, P = 0.0438; Tukey’s post hoc, P = 0.0475) in injured KO vessels compared with injured WT vessels; n = 4–6 WT, 3 KO vessels/group. Neointimal (NI) area was not significantly different between WT and KO vessels (H), and the NI-to-MW area ratio (NI/MW) was not significantly reduced (P = 0.1) in KO vessels compared with WT vessels (I); n = 8 WT, 5 KO vessels/group. Data disaggregated by sex failed to show significant sex-based differences in these parameters (not shown). J–M: fluorescent photomicrographs of vessel cross sections taken 28 days post-op for sham or injured WT and GPR68 KO vessels immunostained for GPR68. Shown are merged images for GPR68 (green), nuclear DAPI (blue), and autofluorescence (red) for vessel structure. Individual photomicrographs are shown in Supplemental Fig. S2. N: negative control vessel lacking a primary anti-GPR68 antibody and probed with only a secondary antibody. O: densitometry revealed significantly reduced GPR68 expression in injured WT vessels versus sham WT vessels (two-way ANOVA, interaction effect, P = 0.0001; injury effect, P = 0.0002; genotype effect, P < 0.0001; Tukey’s post hoc, P < 0.0001). GPR68 expression was largely absent in the KO versus WT sham vessels (P < 0.0001); n = 3/group. *P < 0.05, **P < 0.01, ***P < 0.001, and ****P < 0.0001; nonsignificant trends (0.05 ≤ P ≤ 0.1) are shown.
Figure 4.
Figure 4.
Knockout (KO) vascular smooth muscle (VSM) cells have increased proliferation compared with wild-type (WT) cells. Flow cytometry for cell-cycle progression and automated cell counting with viability analyses were performed in WT and GPR68 KO VSM cells. WT and KO mouse VSM cells were analyzed by flow cytometry every 4 h starting at time 0 [when cells were switched from quiescent (0.2% serum) to growth media (10% serum)] through 12 h. A: at time 0, results show significantly reduced KO cell numbers in G0/G1 (two-way ANOVA, interaction effect, P = 0.0139; cell-cycle phase effect, P < 0.0001; Tukey’s post hoc, P = 0.0414) and significantly increased KO cell numbers in G2/M (P = 0.0205) compared with WT cell numbers. B: after 4 h, the significantly reduced KO cell numbers in G0/G1 compared with WT cell numbers persist (two-way ANOVA, interaction effect, P = 0.0053; cell-cycle phase effect, P < 0.0001; Tukey’s post hoc, P = 0.0061), with a trend (P = 0.08) for elevated KO cell numbers versus WT in S phase. C: a trend (two-way ANOVA cell-cycle phase effect, P = 0.0047; Tukey’s post hoc, P = 0.1) remains for decreased KO cells compared with WT cells in G0/G1 after 8 h. D: by 12 h, a reversal seems to occur, with a trend for more (two-way ANOVA, interaction effect, P = 0.0480; cell-cycle phase effect, P = 0.0001; Tukey’s post hoc, P = 0.1) KO cells in G0/G1 and significantly fewer KO cells in S compared with WT cells (P = 0.0499); n = 3 replicates in triplicate per cohort. **P < 0.01; nonsignificant trends (0.05 ≤ P ≤ 0.1) are shown. E and F: automated cell counting for WT and GPR68 KO VSM cells. Cells were plated and quiesced (0.2% FBS) for 24 h, after which growth media (10–20% FBS) was added (time 0), and total cell numbers and cell viabilities were measured through 48 and 72 h. E: significantly increased KO cell numbers compared with WT controls were observed after 24 (two-way ANOVA, time effect, P < 0.0001; genotype effect, P < 0.0001; interaction effect, P < 0.0001; Tukey’s post hoc, P = 0.0085) and 48 h (Tukey’s post hoc, P < 0.0001). F: cell proliferation analysis was repeated using 20% FBS as a growth stimulant over 72 h. Results again show significantly increased KO cell numbers versus WT numbers after 72 h (two-way ANOVA, time effect, P < 0.0001; genotype effect, P = 0.0203; Tukey’s post hoc, P = 0.0017). Data for cell viability, diameter, and circularity/roundness from these experiments are shown in Supplemental Figs. S3, S4, and S5; n = 6/cohort at each time point. *P < 0.05; **P < 0.01; ****P < 0.0001.
Figure 5.
Figure 5.
Acid exposure induces GPR68 and suppresses vascular smooth muscle (VSM) cell proliferation. Wild-type (WT) and knockout (KO) VSM cells were plated, quiesced (0.2% FBS) for 24 h, and incubated in growth media (10% FBS) buffered to normal pH (7.4–7.6) or acidic pH (6.5–6.7) for varying time points. A: GPR68 transcript expression (normalized to GAPDH) was significantly increased (unpaired t test, P = 0.0007) in WT cells incubated in acidic media (WA) compared with WT cells in normal media (WN) for 5 h; n = 3 replicates in triplicate per cohort. B: transcript expression of α-smooth muscle actin (α-SMA) was significantly induced (two-way ANOVA, interaction effect, P = 0.0470; media effect, P = 0.0114; genotype effect, P = 0.0005; Tukey’s post hoc, P = 0.0041) in WT cells in acidic media (WA) compared with WT cells in normal pH media (WN), as well as in WA cells versus KO cells under acidic (KA) (Tukey’s post hoc, P = 0.0018). No differences were observed in α-SMA in KA versus KO cells in normal pH media (KN); n = 3–6/cohort. C: in WA cells, significantly reduced cell numbers compared with WN cells were observed at 24 h (two-way ANOVA, media effect, P = 0.0126; interaction effect, P = 0.0255; Tukey’s post hoc, P = 0.0420) and 48 h (Tukey’s post hoc, P = 0.0010). D: GPR68 KO VSM cells under identical conditions showed similar growth responses, with significantly higher KN cell numbers (two-way ANOVA, time effect, P = 0.0021; interaction effect, P = 0.0106; Tukey’s post hoc, P = 0.0008) compared with KA cells after 48 h; n = 6/cohort. Gaps in the x-axis and data indicate nonlinear timing between plating, quiescence, and initiation of growth (with growth serum) at time 0. *P < 0.05, **P < 0.01, and ***P < 0.001.
Figure 6.
Figure 6.
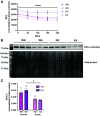
GPR68 regulates intracellular calcium levels and PKC-α expression. A: wild-type (WT) and knockout (KO) cells were preincubated in normal pH or acidic pH media in the presence of a calcium-loading solution for 1 h, after which intracellular calcium readings were taken on a microplate reader every hour over 4 h. Intracellular calcium levels in KO cells in normal pH media (KN) remained consistent through 240 min, but levels significantly decreased in all other groups (two-way ANOVA, time effect, P < 0.0001; group effect, P = 0.0011; interaction effect, P = 0.0167); n = 8 for WT cells in normal media (WN), WT cells in acidic media (WA) groups, n = 5 for KN and KO cells under acidic media (KA) groups. Following 5-h incubation in normal or acidic media, WT and KO vascular smooth muscle (VSM) cell lysates were probed for calcium-dependent PKC-α. B: representative Western blot of PKC-α and total protein blot from the same gel. C: KA cells show significant reduction (two-way ANOVA, media effect, P = 0.0041; Tukey’s post hoc, P = 0.0375) in PKC-α expression compared with KN cells; n = 3/cohort. *P < 0.05; ****P < 0.0001.
Figure 7.
Figure 7.
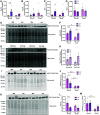
Transcript and protein expression of Rap1A/1B and Erk1/2 are differentially modulated in knockout (KO) vascular smooth muscle (VSM) cells and under acidic conditions. Wild-type (WT) and KO VSM cells were plated, quiesced (0.2% FBS) for 24 h, and incubated in growth media (10% FBS) in normal (7.4–7.6) or acidic (6.5–6.7) pH for 5 h, after which lysates were probed for transcript (A–D) and protein (E–M) expression. A: Rap1A transcript was significantly increased (two-way ANOVA, genotype effect, P = 0.0019; Tukey’s post hoc, P = 0.0038) in KO cells in normal pH media (KN) compared with WT cells in normal media (WN), but incubation in acidic media did not significantly alter Rap1A transcript expression for either WT [WN-WT cells in acidic media (WA)] or KO [KN-KO cells under acidic media (KA)] cohorts. B: Rap1B transcript expression analysis showed a significant interaction effect (two-way ANOVA, P = 0.0297), but no significant differences were found between groups (Tukey’s post hoc analysis); n = 6–9/cohort. No significant differences were found in Erk1 (C) or Erk2 (D) transcript expression across cohorts (two-way ANOVA); n = 3–6/cohort. E: representative Western blot for Rap1A/1B and total protein blot from the same gel. F: densitometry for Rap1A/1B protein expression shows a significant reduction (two-way ANOVA, media effect, P = 0.0040; genotype effect, P = 0.0031; Tukey’s post hoc, P = 0.0429) in Rap1A/1B in WA versus WN, and significant differences (Tukey’s post hoc, P = 0.0358) between WA and KA. G and H: Rap1A/1B expression was measured following treatment with the GPR68-positive allosteric modulator ogerin. Representative blot (G) and densitometry revealed no significant changes in Rap1A/1B expression between groups (H; two-way ANOVA). I–M: Erk1/2, a downstream target of Rap1A/1B, was evaluated in WT and KO VSM cells under like conditions. I: representative blot of phosphorylated Erk1/2 along with total protein blot from the same gel. J: densitometry revealed significantly reduced phosphorylated Erk1/2 in KN compared with WN (two-way ANOVA, interaction effect, P = 0.0190; media effect, P = 0.0002; genotype effect, P = 0.0369; Tukey’s post hoc, P = 0.0207) and in WA compared with WN (Tukey’s post hoc, P = 0.0007). A nonsignificant reduction (Tukey’s post hoc, P = 0.1) was observed in KA versus KN. K: representative blot of total Erk1/2 with total protein blot from the same gel. L: densitometry showed a significant genotype interaction (two-way ANOVA, P = 0.0340) but only a marked reduction in Erk1/2 in KN versus WN (Tukey’s post hoc, P = 0.1). M: calculated phospho- to total Erk1/2 ratio reveals a nonsignificant (two-way ANOVA, media effect, P = 0.0187; Tukey’s post hoc, P = 0.1) reduction in WA versus WN; n = 3 replicates in triplicate per cohort. *P < 0.05, **P < 0.01, and ***P < 0.001; nonsignificant trends (0.05 ≤ P ≤ 0.1) are shown.
Figure 8.
Figure 8.
RNA silencing of Rap1A reverses enhanced growth in knockout (KO) vascular smooth muscle (VSM) cells. siRNA-mediated knockdown of Rap1A was performed in KO VSM cells. KO cells were plated, and transfection was performed using transfection reagent/media (vehicle) for all groups and nontargeting control (NTC) or Rap1A [(−)Rap1A] siRNA oligos. A: Rap1A mRNA was measured 24 h following initiation of transfection. Rap1A was significantly decreased in the (−)Rap1A group compared with vehicle (one-way ANOVA, P = 0.0056; Tukey’s post hoc, P = 0.0074) and NTC (Tukey’s post hoc, P = 0.0153) groups; n = 4/cohort. B: cell proliferation was assessed after 24 h, and (−)Rap1A had significantly lower cell numbers (one-way ANOVA, P = 0.0409; Tukey’s post hoc, P = 0.0411) compared with NTC at 24 h; n = 3/cohort. *P < 0.05; **P < 0.01.
Figure 9.
Figure 9.
Fluorescent photomicrographs for Rap1A/1B in sham or injured wild-type (WT) and GPR68 knockout (KO) vessels. A–D: fluorescent photomicrographs of vessel cross-sections taken 28 days post-op for sham or injured WT and GPR68 KO vessels immunostained for Rap1A/1B. Shown are merged images for Rap1A/1B (green), nuclear DAPI (blue), and autofluorescence (red) for vessel structure. Individual photomicrographs are shown in Supplemental Fig. S7. E: negative control vessel lacking a primary anti-Rap1A/1B antibody and probed with only a secondary antibody. F: densitometry revealed markedly (P = 0.06) increased Rap1A/1B protein expression in KO sham versus WT sham vessels (two-way ANOVA, injury effect, P = 0.0045; genotype effect, P = 0.0008; Tukey’s post hoc, P = 0.06), significantly increased expression in KO-injured versus WT-injured vessels (P = 0.0123), and significantly decreased Rap1A/1B in injured WT versus sham WT vessels (P = 0.0420); n = 3/cohort. *P < 0.05.
Figure 10.
Figure 10.
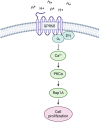
Proposed signaling mechanism for GPR68 control of vascular smooth muscle (VSM) cell proliferation. The pH-sensor GPR68 inhibits VSM cell proliferation through inhibition of the Gαq pathway.

Comment in

References

    1. Martin SS, Aday AW, Almarzooq ZI, Anderson CAM, Arora P, Avery CL , et al. 2024 Heart Disease and Stroke Statistics: a report of US and global data from the American Heart Association. Circulation 149: e347–e913, 2024. [Erratum in Circulation 149: e1164, 2024]. doi: 10.1161/CIR.0000000000001209. - DOI - PMC - PubMed
    1. World Health Organization. World Health Statistics 2023: Monitoring Health for the SDGs. Geneva: World Health Organization, 2023.
    1. Ross R. The pathogenesis of atherosclerosis: a perspective for the 1990s. Nature 362: 801–809, 1993. doi: 10.1038/362801a0. - DOI - PubMed
    1. Holland NA, Francisco JT, Johnson SC, Morgan JS, Dennis TJ, Gadireddy NR, Tulis DA. Cyclic nucleotide-directed protein kinases in cardiovascular inflammation and growth. J Cardiovasc Dev Dis 5: 6, 2018. doi: 10.3390/jcdd5010006. - DOI - PMC - PubMed
    1. Holt AW, de Castro Brás LE, Tulis DA. Cyclic nucleotide-driven protein kinase signaling in arterial smooth muscle (patho)physiology. In: Coronary Artery Disease - Causes, Symptoms & Treatments (1st ed.). Columbia, SC: iCONCEPT Press, ; p. 15–51, 2016. ISBN:978-1-922227-92-8.

MeSH terms