. 2024 Sep 13;81(1):401.
doi: 10.1007/s00018-024-05432-8.

Glucose metabolite methylglyoxal induces vascular endothelial cell pyroptosis via NLRP3 inflammasome activation and oxidative stress in vitro and in vivo

Affiliations

Glucose metabolite methylglyoxal induces vascular endothelial cell pyroptosis via NLRP3 inflammasome activation and oxidative stress in vitro and in vivo

Yanan Wang et al. Cell Mol Life Sci. .

Abstract

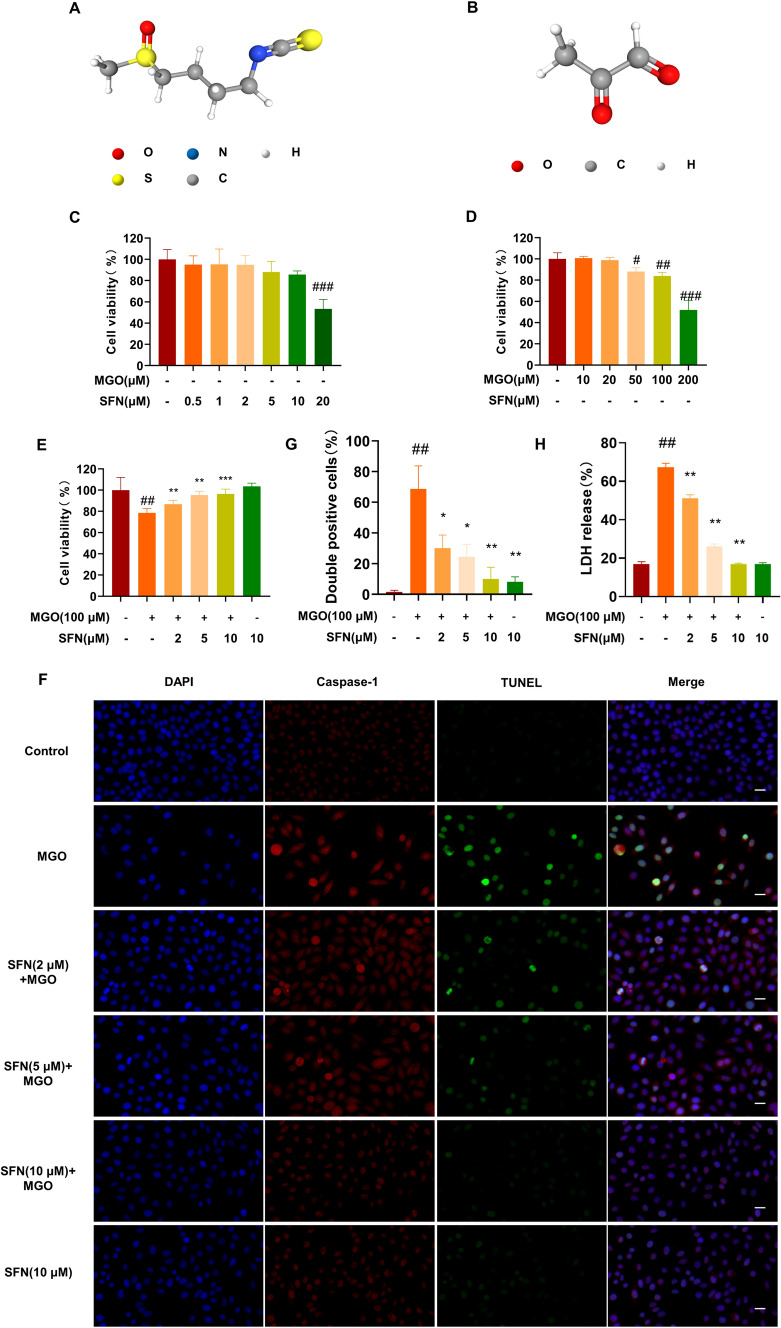
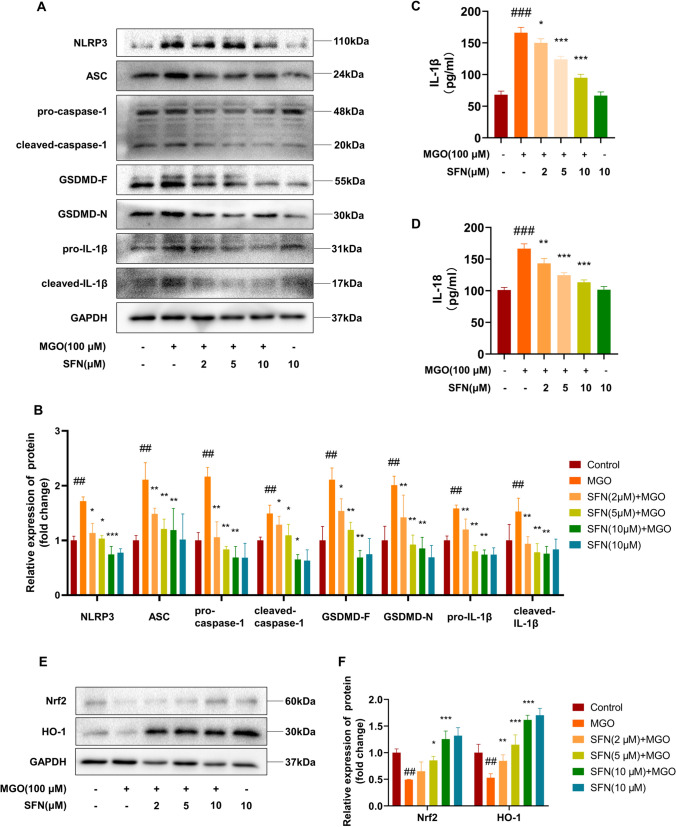
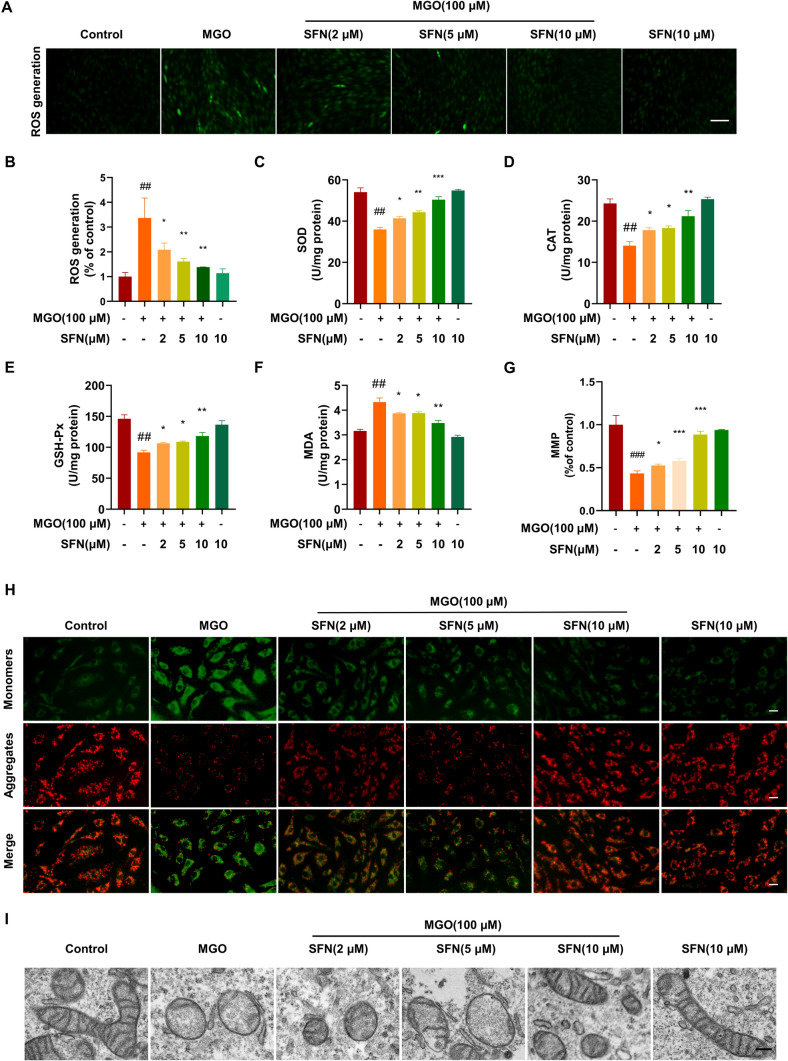
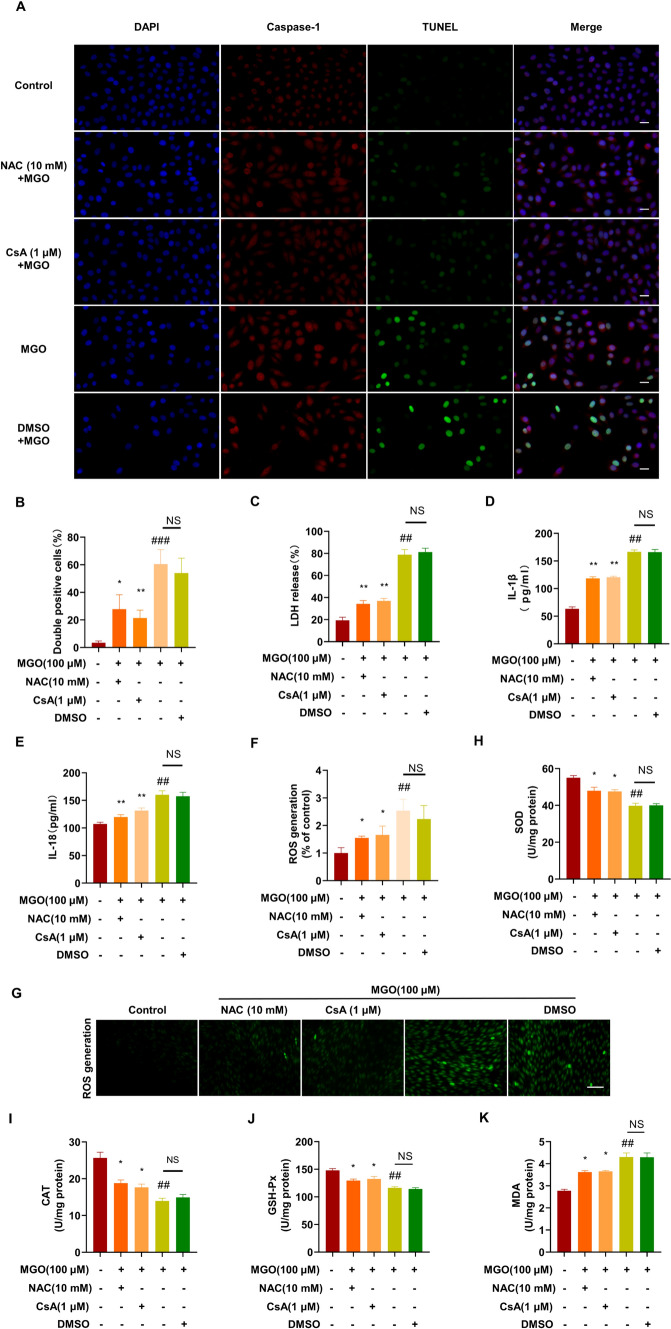
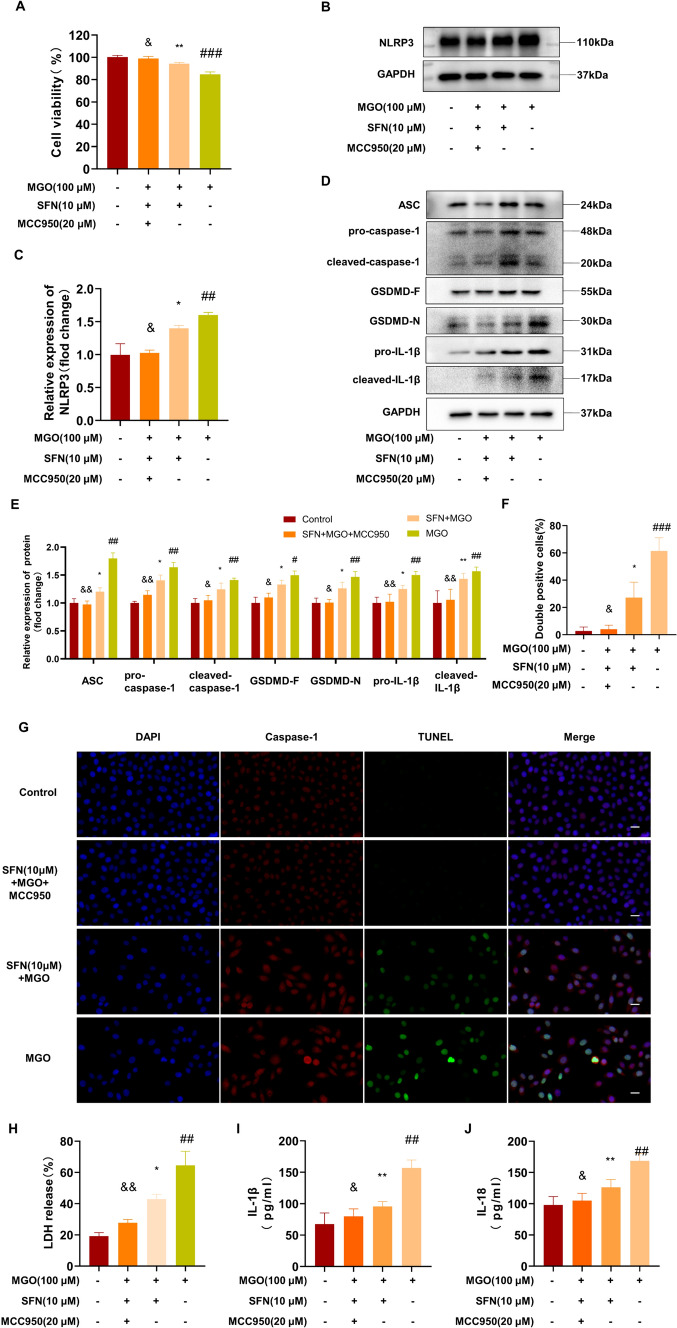
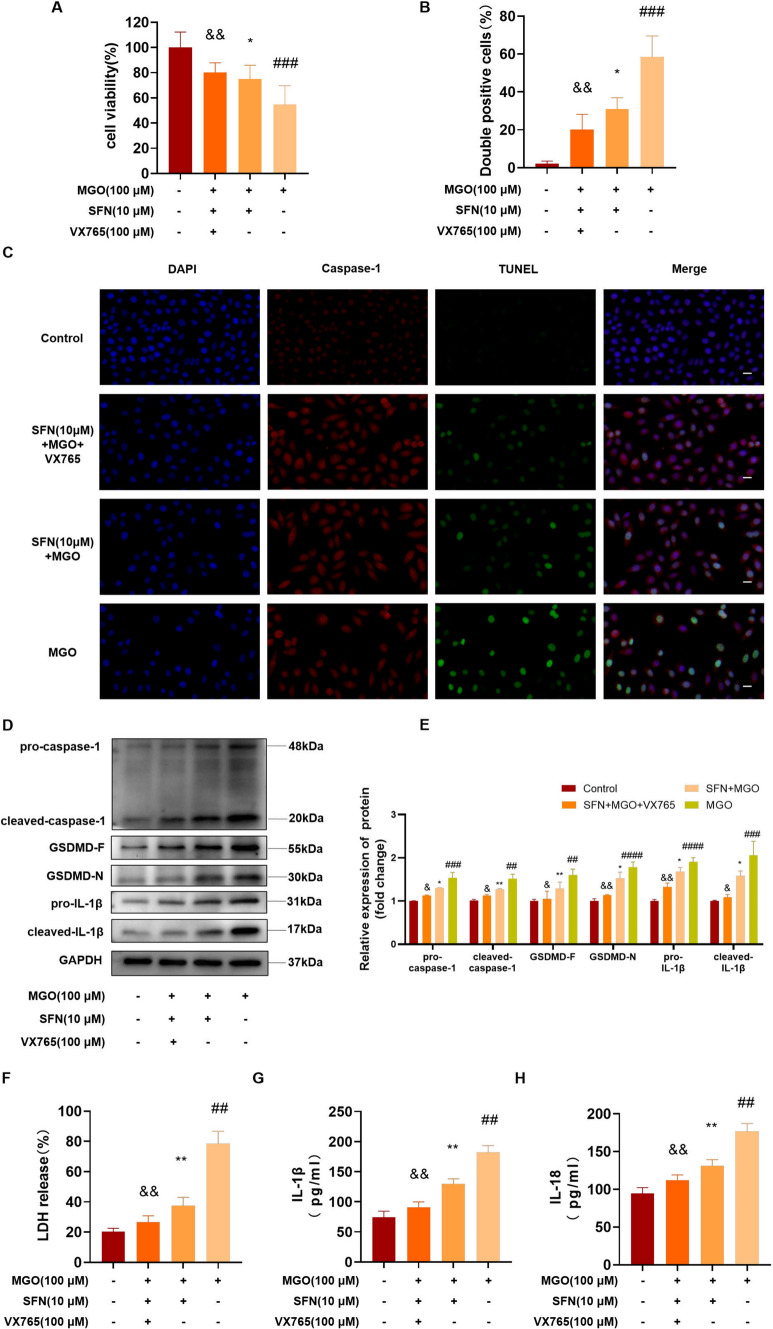
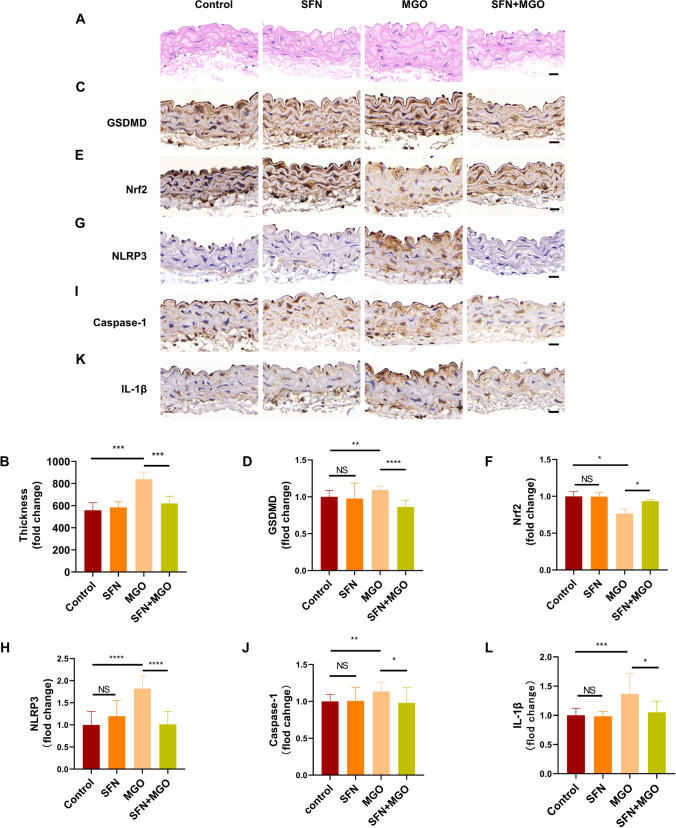
Methylglyoxal (MGO), a reactive dicarbonyl metabolite of glucose, plays a prominent role in the pathogenesis of diabetes and vascular complications. Our previous studies have shown that MGO is associated with increased oxidative stress, inflammatory responses and apoptotic cell death in endothelial cells (ECs). Pyroptosis is a novel form of inflammatory caspase-1-dependent programmed cell death that is closely associated with the activation of the NOD-like receptor 3 (NLRP3) inflammasome. Recent studies have shown that sulforaphane (SFN) can inhibit pyroptosis, but the effects and underlying mechanisms by which SFN affects MGO-induced pyroptosis in endothelial cells have not been determined. Here, we found that SFN prevented MGO-induced pyroptosis by suppressing oxidative stress and inflammation in vitro and in vivo. Our results revealed that SFN dose-dependently prevented MGO-induced HUVEC pyroptosis, inhibited pyroptosis-associated biochemical changes, and attenuated MGO-induced morphological alterations in mitochondria. SFN pretreatment significantly suppressed MGO-induced ROS production and the inflammatory response by inhibiting the NLRP3 inflammasome (NLRP3, ASC, and caspase-1) signaling pathway by activating Nrf2/HO-1 signaling. Similar results were obtained in vivo, and we demonstrated that SFN prevented MGO-induced oxidative damage, inflammation and pyroptosis by reversing the MGO-induced downregulation of the NLRP3 signaling pathway through the upregulation of Nrf2. Additionally, an Nrf2 inhibitor (ML385) noticeably attenuated the protective effects of SFN on MGO-induced pyroptosis and ROS generation by inhibiting the Nrf2/HO-1 signaling pathway, and a ROS scavenger (NAC) and a permeability transition pore inhibitor (CsA) completely reversed these effects. Moreover, NLRP3 inhibitor (MCC950) and caspase-1 inhibitor (VX765) further reduced pyroptosis in endothelial cells that were pretreated with SFN. Collectively, these findings broaden our understanding of the mechanism by which SFN inhibits pyroptosis induced by MGO and suggests important implications for the potential use of SFN in the treatment of vascular diseases.

Keywords: MGO; NLRP3 inflammasome; Pyroptosis; ROS; Sulforaphane.


Conflict of interest statement

The authors declare that they have no conflict of interest regarding the publication of this article. Figures were created with Bio Render software. Cbiorender.com.

Figures

Fig. 1
Fig. 1
SFN suppresses MGO-induced pyroptosis A, B The chemical structures of SFN and MGO. C HUVECs were treated with SFN (0–20 μM, 24 h), and the CCK-8 assay was subsequently performed to determine cell viability. D Cells were treated with MGO (0–200 μM) for 24 h. Cell viability was assessed by the CCK-8 assay. E ECs were pretreated with SFN (0, 2, 5, or 10 μM) for 2 h followed by MGO (100 μM) exposure for 24 h. Cell viability was assessed by the CCK-8 assay. F, G HUVECs were treated with SFN (0, 2, 5, or 10 μM) for 2 h, followed by MGO (100 μM) treatment for 24 h. Pyroptosis was examined by TUNEL (green) and caspase-1 (red) double-positive staining. The nuclei were stained blue with DAPI. Representative images of pyroptotic cells are shown. The scale bar represents 20 μm. H Pyroptosis was examined by measuring LDH release (%) in the cell culture supernatant. The values are presented as the means ± SD from three independent experiments. #P < 0.05 vs. Ctrl, ##P < 0.01 vs. Ctrl, ###P < 0.001 vs. Ctrl, *P < 0.1 vs. MGO, **P < 0.01 vs. MGO, ***P < 0.001 vs. MGO
Fig. 2
Fig. 2
SFN prevents MGO-mediated NLRP3 inflammasome activation and suppresses the impairment of the Nrf2/HO-1 pathway HUVECs were treated with SFN (0, 2, 5, or 10 μM) for 2 h, followed by MGO (100 μM) treatment for 24 h. A, B The effects of SFN on MGO-induced changes in the inflammasome-related proteins NLRP3, ASC, pro-caspase-1, and cleaved caspase-1, as well as the pyroptosis-related proteins GSDMD-F, GSDMD-N, pro-IL-1β, and cleaved-IL-1β, were examined by western blotting. GAPDH was used as the loading control. C, D The levels of IL-1β and IL-18 in the supernatants were determined by ELISA. E, F The levels of the oxidation-related proteins Nrf2 and HO-1 were investigated by western blotting. All the graphs correspond to the blots above and represent the densitometric analyses of three independent experiments; the data are expressed as the means ± SD. ##P < 0.01 vs. Control, ###P < 0.001 vs. Ctrl, *P < 0.05 vs. MGO, **P < 0.01 vs. MGO, ***P < 0.001 vs. MGO
Fig. 3
Fig. 3
SFN suppresses MGO-induced intracellular ROS generation and mitochondrial damage HUVECs were treated with SFN (0, 2, 5, or 10 μM) for 2 h and then exposed to MGO (100 μM) for 1 h. A, B The cells were stained with DCFH-DA, and the fluorescence intensity was measured at 488/525 nm using a microplate reader. Scale bar, 250 nm. (C-F) The levels of SOD, CAT, GSH-Px and MDA were measured with the indicated ELISA kits. G, H The MMP was assessed with the JC-1 probe. The fluorescence intensities of JC-1 monomers (490/530 nm) and JC-1 aggregates (525/590 nm) were measured using a microplate reader. The ratio of JC-1 aggregates/JC-1 monomers was calculated. Scale bar, 50 μm. I Ultrastructural alterations in mitochondria were detected by TEM. Scale bars: 200 nm. The data are shown as the means ± SD of three independent experiments. ##P < 0.01 vs. Control, ###P < 0.001 vs. Control, *P < 0.05 vs. MGO, **P < 0.01 vs. MGO, ***P < 0.001 vs. MGO
Fig. 4
Fig. 4
Effects of NAC and CsA on MGO-induced HUVEC pyroptosis and ROS generation HUVECs were pretreated with NAC (10 mM) and CsA (1 μM) for 2 h and then stimulated with MGO for 24 h. A, B Pyroptosis was examined by TUNEL (green) and caspase-1 (red) double-positive staining. The nuclei were stained blue with DAPI. Representative images of pyroptotic cells are shown. The scale bar represents 20 μm. C Pyroptotic cell death was determined by measuring LDH release. D, E ELISA analysis of IL-1β and IL-18 in the supernatants of HUVECs subjected to the different treatments. F, G The cells were stained with DCFH-DA, and the fluorescence intensity was measured at 488/525 nm using a microplate reader. Scale bar, 250 nm. HK The levels of SOD, CAT, GSH-Px, and MDA were measured with the appropriate kits according to the manufacturer’s instructions. The values (mean ± SD from three independent experiments) are relative to the control and are expressed as fold changes. ##P < 0.01 vs. Control, ###P < 0.001 vs. Control, *P < 0.05 vs. MGO, **P < 0.01 vs. MGO, NS: not significant
Fig. 5
Fig. 5
The Nrf2 inhibitor attenuates the protective effect of SFN against MGO-induced pyroptosis HUVECs were pretreated with SFN (10 μM), ML385 (20 μM, an Nrf2 inhibitor), or the vehicle control for 2 h and subsequently stimulated with MGO for 24 h. A Cell viability was determined by a CCK-8 assay. B, C ELISA analysis of IL-1β and IL-18 in the supernatants of HUVECs subjected to different treatments. D, E Pyroptosis was examined by TUNEL (green) and caspase-1 (red) double-positive staining. The nuclei were stained blue with DAPI. Representative images of pyroptotic cells are shown. Scale bar represents 20 μm. F Ultrastructural alterations in mitochondria were examined by TEM. Scale bars: 200 nm. G Pyroptosis was measured by measuring LDH release (%) in the cell culture supernatant. H, I Representative western blot analysis of total cell lysates with antibodies against Nrf2 and HO-1; the proteins were quantified by densitometry and are presented as ratios relative to GAPDH. J, K The protein expression levels of NLRP3, ASC, pro-caspase-1 and cleaved caspase-1 were measured by western blotting and quantified by ImageJ software. The expression of GSDMD-F, GSDMD-N, pro-IL-1β and cleaved IL-1β in the cell lysate was examined immunoblot assays and quantified by normalization to the control group. The values (mean ± SD from three independent experiments) are relative to the control and are expressed as fold changes. #P < 0.05 vs. Control, ##P < 0.01 vs. Control, *P < 0.05 vs. MGO, **P < 0.01 vs. MGO, &P < 0.05 vs. SFN + MGO, &&P < 0.01 vs. SFN + MGO, &&&P < 0.001 vs. SFN + MGO
Fig. 6
Fig. 6
SFN suppresses MGO-induced pyroptosis by inhibiting NLRP3 inflammasome activation HUVECs were pretreated with SFN (10 μM), MCC950 (20 μM, the NLRP3 inhibitor), or the vehicle control for 2 h and then stimulated with 100 μM MGO for 24 h. A Then, the CCK-8 assay was performed to examine cell viability. (B-C) NLRP3 protein expression in ECs was determined by western blotting and quantified by Image J software. D, E The protein levels of ASC, pro-caspase-1 and cleaved caspase-1 were examined by western blotting. The levels of the pyroptotic proteins GSDMD-F, GSDMD-N, pro-IL-1β and cleaved-IL-1β were analyzed by western blotting. GAPDH was used as an internal control. F, G Pyroptosis was examined by TUNEL (green) and caspase-1 (red) double-positive staining. The nuclei were stained blue with DAPI. Representative images of pyroptotic cells are shown. Scale bar represents 20 μm. H Pyroptosis was measured by measuring LDH release (%) in the cell culture supernatant. I, J ELISA analysis of IL-1β and IL-18 in the supernatants of HUVECs subjected to different treatments. The data are shown as the mean ± SD of at least three independent experiments. #P < 0.05 vs. Control, ##P < 0.01 vs. Control, ###P < 0.001 vs. Control, *P < 0.05 vs. MGO, **P < 0.01 vs. MGO, &P < 0.05 vs. SFN + MGO, &&P < 0.01 vs. SFN + MGO
Fig. 7
Fig. 7
Caspase-1 is involved in endothelial cells pyroptosis induced by MGO. HUVECs were pretreated with SFN (10 μM), VX765 (100 μM, a caspase-1 inhibitor), or the vehicle control for 2 h and then stimulated with 100 μM MGO for 24 h. A The CCK-8 assay was performed to examine cell viability. B, C Pyroptosis was examined by TUNEL (green) and caspase-1 (red) double-positive staining. The nuclei were stained blue with DAPI. Representative images of pyroptotic cells are shown. Scale bar represents 20 μm. D, E The protein levels of pro-caspase-1, cleaved caspase-1 were examined by western blotting. The levels of the pyroptotic proteins GSDMD-F, GSDMD-N, pro-IL-1β and cleaved-IL-1β were analyzed by western blotting and quantified by Image J software. GAPDH was used as an internal control. F Pyroptosis was measured by measuring LDH release (%) in the cell culture supernatant. G, H ELISA analysis of IL-1β and IL-18 in the supernatants of HUVECs subjected to different treatments. The data are shown as the mean ± SD of at least three independent experiments. ##P < 0.01 vs. Control, ###P < 0.001 vs. Control, ####P < 0.0001 vs. Control, *P < 0.05 vs. MGO, **P < 0.01 vs. MGO, &P < 0.05 vs. SFN + MGO, &&P < 0.01 vs. SFN + MGO
Fig. 8
Fig. 8
Effects of SFN and MGO on physiological changes, oxidative indices, and inflammatory factors in mice C57BL/6 mice were treated with MGO and SFN, and physiological and biochemical characteristics were analyzed. At the end of the experiment, blood samples were collected and analyzed. A Bodyweight. B Food intake. CE The levels of SOD, CAT, and GSH-Px were measured with the appropriate kits according to the manufacturer’s instructions. F MDA levels was measured. GI Changes in the proinflammatory cytokines IL-1β and IL-18 and LDH release were examined. J An MGO ELISA Kit was used to measure MGO levels in serum. The data are presented as the mean ± SD; n ≥ 5 for each group. *P < 0.05, **P < 0.01, ***P < 0.001, NS: not significant
Fig. 9
Fig. 9
SFN prevents MGO-induced pyroptosis by regulating the Nrf2/HO-1 and NLRP3 inflammasome pathways in vivo C57BL/6 mice were treated with MGO and SFN, after which the aortas were collected for biochemical parameter analysis. A, B Histological changes in the aortas were evaluated by H&E staining. C, D GSDMD expression was evaluated by immunohistochemical staining. E, F The oxidative factor Nrf2 was examined by immunohistochemical staining. GL The inflammatory factors NLRP3, caspase-1 and IL-1β were evaluated by immunohistochemical staining. The data are presented as the mean ± SD; n ≥ 5 for each group. *P < 0.05, **P < 0.01, ***P < 0.001, NS: not significant. Bar = 20 μm
Fig. 10
Fig. 10
Schematic diagram showing cytoprotective signaling associated with SFN during MGO-induced EC pyroptosis. The molecular mechanisms by which SFN affects MGO-induced dysfunction in human ECs were explored. SFN inhibited the pyroptotic signaling cascades initiated by MGO-induced ROS generation by modulating the Nrf2/HO-1 and NLRP3 inflammasome signaling pathways. Furthermore, SFN effectively protected against MGO-induced oxidative stress, mitochondrial dysfunction, pyroptosis, and inflammation in vitro and in vivo

References

    1. Newman JD et al (2018) The changing landscape of diabetes therapy for cardiovascular risk reduction: JACC state-of-the-art review. J Am Coll Cardiol 72:1856–1869. 10.1016/j.jacc.2018.07.071 10.1016/j.jacc.2018.07.071 - DOI - PMC - PubMed
    1. Newman JD, Schwartzbard AZ, Weintraub HS, Goldberg IJ, Berger JS (2017) Primary prevention of cardiovascular disease in diabetes mellitus. J Am Coll Cardiol 70:883–893. 10.1016/j.jacc.2017.07.001 10.1016/j.jacc.2017.07.001 - DOI - PMC - PubMed
    1. Dal Canto E et al (2019) Diabetes as a cardiovascular risk factor: an overview of global trends of macro and micro vascular complications. Eur J Prev Cardiol 26:25–32. 10.1177/2047487319878371 10.1177/2047487319878371 - DOI - PubMed
    1. Krüger-Genge A, Blocki A, Franke RP, Jung F (2019) Vascular endothelial cell biology: an update. Int J Mol Sci. 10.3390/ijms20184411 10.3390/ijms20184411 - DOI - PMC - PubMed
    1. Hasan SS, Fischer A (2021) The endothelium: an active regulator of lipid and glucose homeostasis. Trends Cell Biol 31:37–49. 10.1016/j.tcb.2020.10.003 10.1016/j.tcb.2020.10.003 - DOI - PubMed

MeSH terms

LinkOut - more resources