. 2024 Sep 13;9(99):eadi3487.
doi: 10.1126/sciimmunol.adi3487. Epub 2024 Sep 13.

Expansion of tumor-reactive CD8+ T cell clonotypes occurs in the spleen in response to immune checkpoint blockade

Affiliations

Expansion of tumor-reactive CD8+ T cell clonotypes occurs in the spleen in response to immune checkpoint blockade

Duncan M Morgan et al. Sci Immunol. .

Abstract

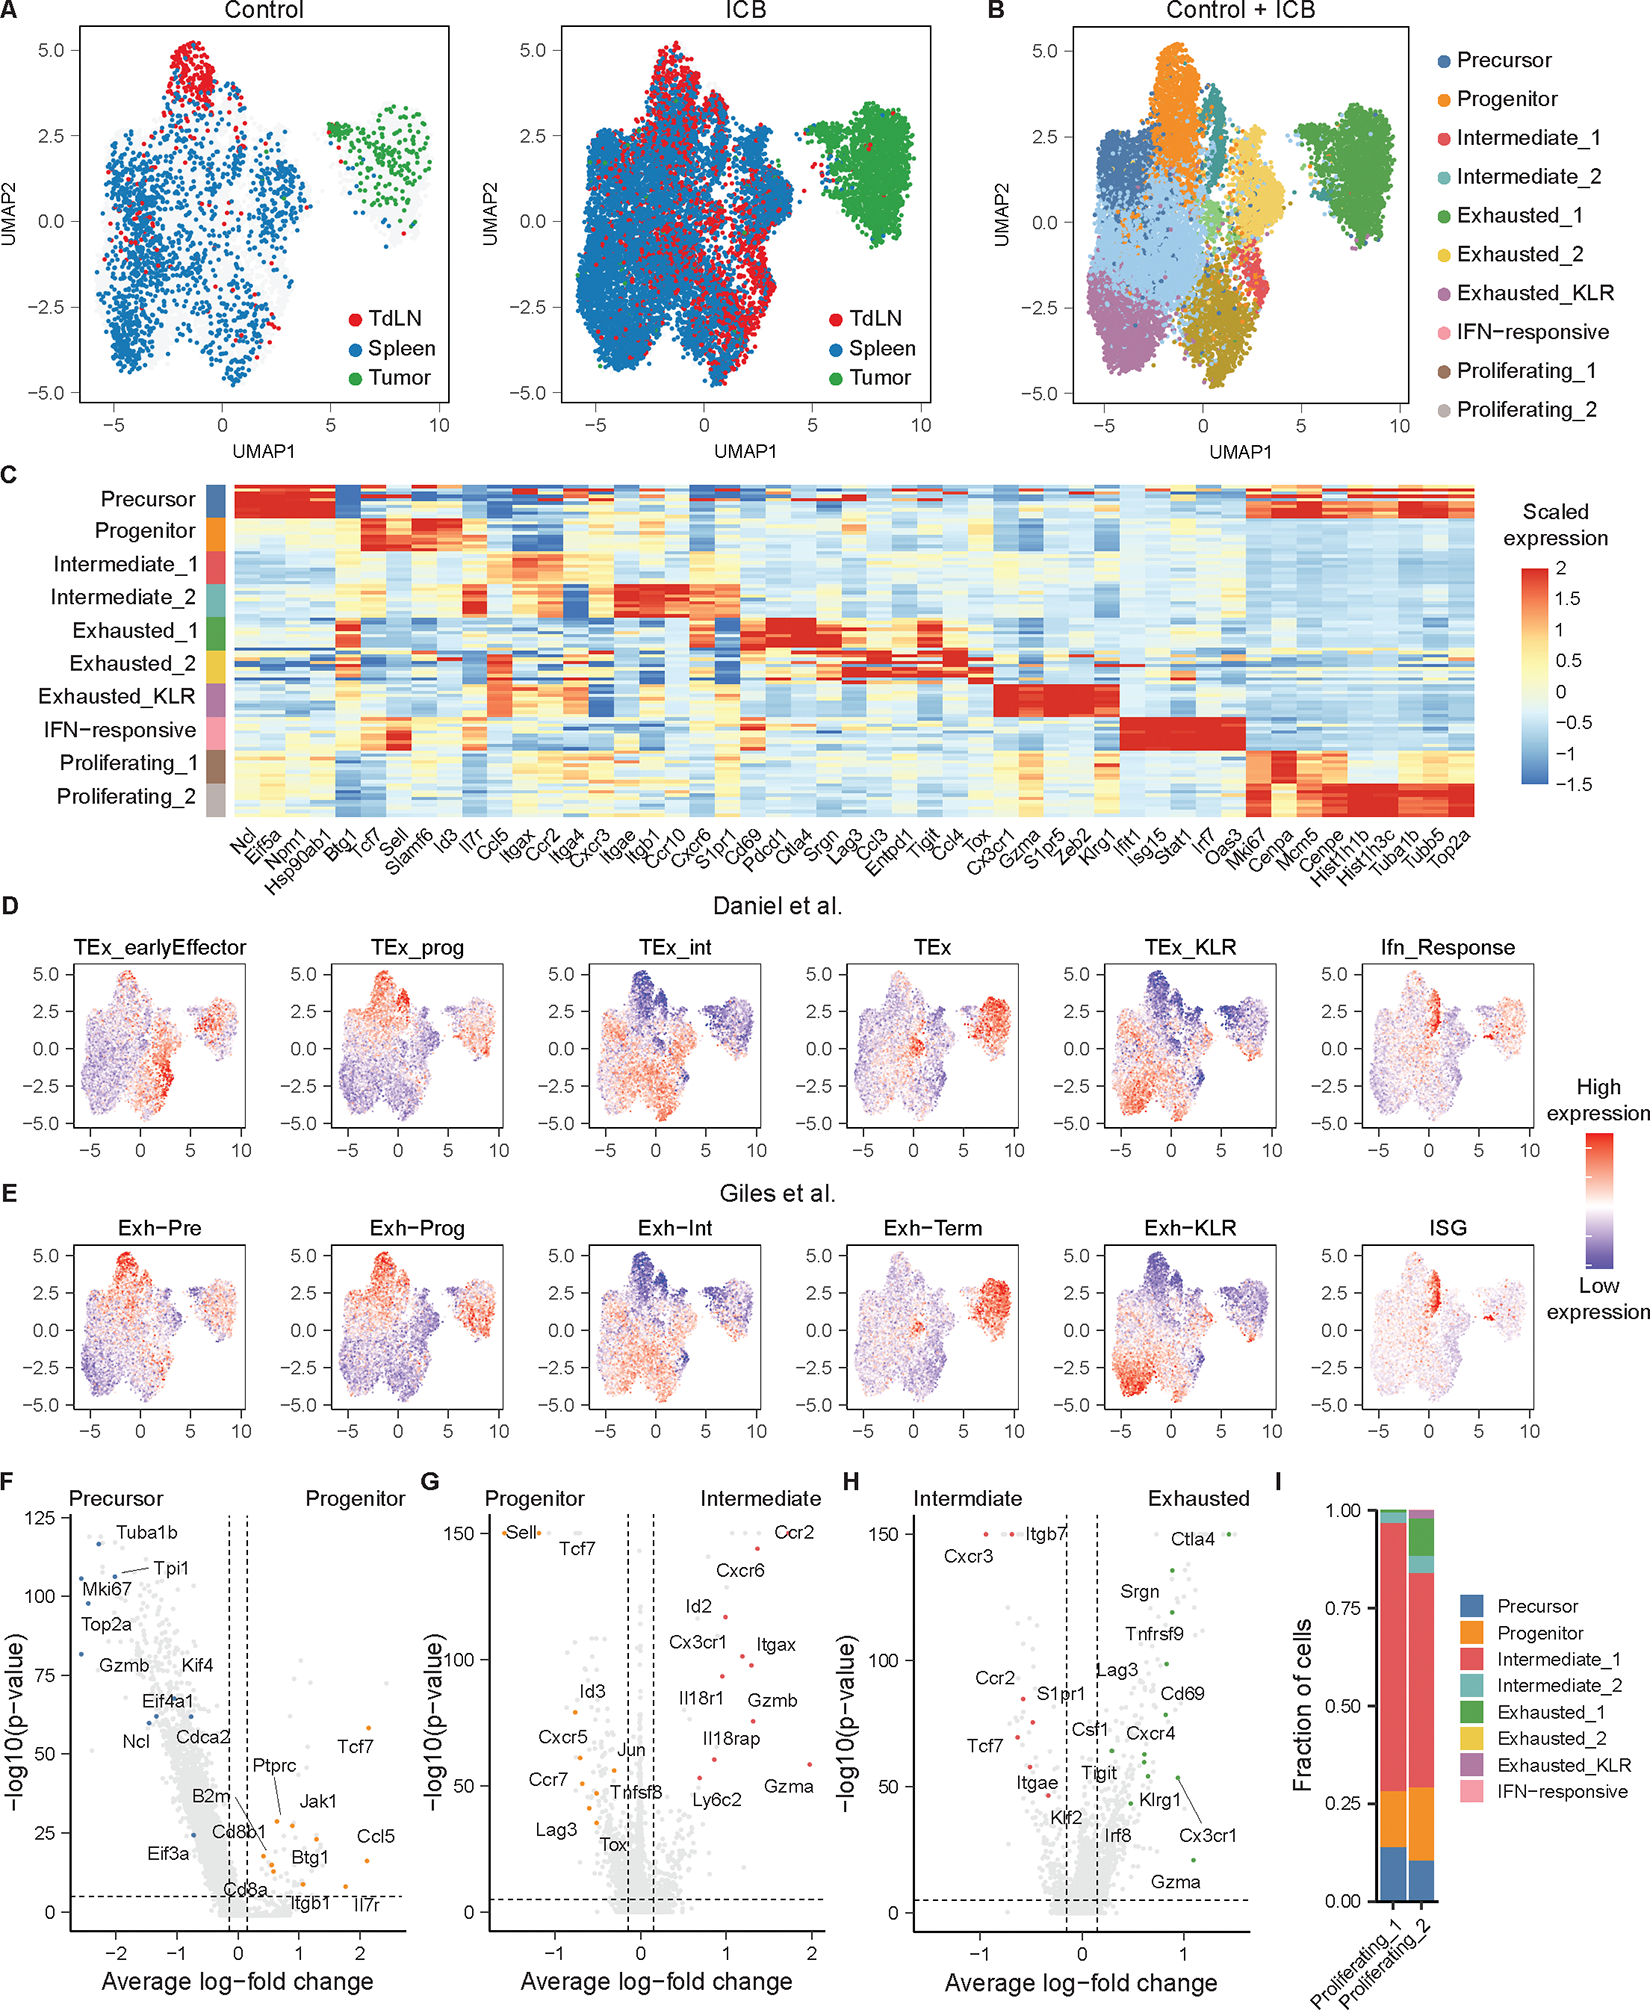
Immune checkpoint blockade (ICB) enhances T cell responses against cancer, leading to long-term survival in a fraction of patients. CD8+ T cell differentiation in response to chronic antigen stimulation is highly complex, and it remains unclear precisely which T cell differentiation states at which anatomic sites are critical for the response to ICB. We identified an intermediate-exhausted population in the white pulp of the spleen that underwent substantial expansion in response to ICB and gave rise to tumor-infiltrating clonotypes. Increased systemic antigen redirected differentiation of this population toward a more circulatory exhausted KLR state, whereas a lack of cross-presented tumor antigen reduced its differentiation in the spleen. An analogous population of exhausted KLR CD8+ T cells in human blood samples exhibited diminished tumor-trafficking ability. Collectively, our data demonstrate the critical role of antigen density within the spleen for the differentiation and expansion of T cell clonotypes in response to ICB.


Conflict of interest statement

Competing interests

J.C.L. is a co-founder and advisor to Honeycomb Biotechnologies. S.S. is a SAB member for Related Sciences, Arcus Biosciences, Ankyra Therapeutics, and Repertoire Immune Medicines. S.S. is a co-founder of Danger Bio. S.S. is a consultant for TAKEDA, Merck, and receives funding for unrelated projects from Leap Therapeutics and iTeos Therapeutics. J.C.L.’s and S.S.’s interests were reviewed and managed under MIT’s policies for potential conflicts of interest. All other authors declare no competing interests.

Figures

Figure 1:
Figure 1:. Tumor-reactive CD8+ T Cells accumulate in the white pulp of the spleens of immune checkpoint blockade-treated mice
A) Immune checkpoint blockade (ICB) treatment scheme of mice bearing subcutaneous KP tumors. B) KP flank tumor outgrowth, n=6, P-values calculated using 2-way ANOVA. C) ICB treatment scheme of mice bearing subcutaneous KP.SIY tumors. D) Weight of day 14 KP.SIY tumors, n=9, P-values calculated with a Mann-Whitney U test. E) Representative staining of SIY-reactive CD8+ T cells in TdLN, spleen, and tumor on day 14. F) Number of SIY-reactive CD8+ T cells in TdLN, spleen (white pulp), and tumor on day 14. Fold changes calculated using the median value from each condition, n=10, P-values calculated with one-way ANOVA. G) Percent of CD8+ T cells that are SIY-reactive in TdLN, spleen (white pulp), and tumor. Fold changes calculated using the median value from each condition, n=10, P-values calculated with a Mann-Whitney U test. H-I) Representative staining (H) and quantification (I) of the percentage of SIY-reactive CD8+ T cells in the white pulp (CD45-IV fraction) of the spleen, n=6. P-values calculated with a Mann-Whitney U test.
Figure 2:
Figure 2:. Single-cell, multi-tissue transcriptional atlas of SIY-reactive CD8+ T cells.
A) UMAP of SIY-reactive CD8+ T cells from untreated or ICB-treated KP tumor-bearing mice recovered colored by tissue (n = 5 untreated mice (hashed and pooled), n = 5 ICB-treated mice (hashed and pooled)). B) UMAP of SIY-reactive CD8+ T cells colored by phenotype. C) Heat map of scaled gene expression of marker genes in SIY-reactive CD8+ T cell phenotypes. Each row represents cells from one phenotype recovered from an individual mouse. D) UMAP of gene expression signatures defined among splenic gp33-reactive CD8+ T cells recovered from day 21 of clone 13 LCMV infection by Daniel et al. (33) E) UMAP of gene expression signatures defined among splenic gp33-reactive CD8+ T cells recovered from days 15 and 30 of clone 13 LCMV infection by Giles et al. (32, 61) F) Volcano plot of transcripts differentially expressed between precursor-exhausted T cells and progenitor-exhausted T cells. G) Volcano plot of transcripts differentially expressed between intermediate-exhausted T cells (Intermediate_1 and Intermediate_2) and progenitor-exhausted T cells. H) Volcano plot of transcripts differentially expressed between terminally-exhausted T cells (Exhausted_1, Exhausted_2, and Exhausted_KLR) and intermediate-exhausted T cells (Intermediate_1, Intermediate_2). I) Label transfer of non-proliferating T cell phenotypes onto proliferating phenotypes. P-values for volcano plots are calculated using a two-sided Wilcoxon rank-sum test and are adjusted using Bonferroni correction. Genes with an average log-fold change > 0.25 and an adjusted p-value < 1e-5 are considered significant. Genes of interest were manually curated and highlighted.
Figure 3:
Figure 3:. Distribution of transcriptional states between TdLN, white pulp, and tumor.
A) Frequency of exhausted states in each tissue. B) Frequency of transcriptional states associated with exhaustion in control and ICB-treated mice. P-values are calculated using a two-sided Wilcoxon rank-sum test and are adjusted using Bonferroni correction. C) Heat map of normalized Cxcr3 and Cx3cr1 expression by progenitor, intermediate_1, and exhausted_KLR T cells. Each box is the average expression in one mouse. D) Representative flow cytometry plots of CXCR3 and CX3CR1 expression by SIY-reactive T cells in TdLN, white pulp (spleen), and tumor. E) Quantification of CXCR3+CX3CR1+ SIY-reactive CD8+ T cells in TdLN, white pulp (spleen), and tumor. F) Frequency of TCF-1 expression by CXCR3+CX3CR1+ SIY-reactive CD8+ T cells in the TdLN and spleen. G) Frequency of CXCR3+CX3CR1+ cells among TCF-1+ SIY-reactive CD8+ T cells. For E-G, n=6, P-values are calculated with one-way ANOVA.
Figure 4:
Figure 4:. Clonal dynamics of SIY-reactive CD8+ T cells.
A) UMAP of SIY-reactive CD8+ T cells colored by clonal size. B) Stacked bar plots of clonal sizes among TdLN, white pulp (spleen), and tumor, of control and ICB-treated mice. Clonal sizes are computed separately in each tissue. C) Shannon diversity of TCR repertoire. D) Clonal richness of TCR repertoire. For C-D, n=5, P-values calculated using a two-sided Wilcoxon rank-sum test and are adjusted using Bonferroni correction. E) Heat map of phenotypes present within individual TCR clonotypes. A random sample of the top 150 most expanded clones is shown. Phenotypes present only once within a single clonotype are not shown. F) Transition matrix of transcriptional states. Boxes are shaded according to the geometric mean of normalized clonal frequencies between pairs of transcriptional states. G) Proposed model of T cell differentiation informed by clonal trajectories.
Figure 5.
Figure 5.. Clonal differentiation is accompanied by change in anatomic site.
A) Correlation between clonotype frequencies in the tumor, TdLN and white pulp (spleen). B) Tissue-site distribution of progenitor and intermediate_1 phenotypes and clonal sizes in progenitor->intermediate_1 clones. C) Tissue-site distribution of intermediate_1 and exhasuted_1 phenotypes and clonal sizes in intermediate_1 -> exhausted_1 clones. D) Tissue-site distribution of intermediate_1 and exhausted_KLR phenotypes and clonal sizes in intermediate_1 -> exhausted_KLR clones. For A-D, P-values are calculated with a paired, two-sided Wilcoxon rank-sum test and are adjusted with Bonferroni correction. E) Stacked bar chart of clonal behaviors assigned to single cells in control and ICB-treated mice. Only clonotypes consisting of more than two cells are shown. F) Absolute clonal sizes of transitioning clonotypes in control and ICB-treated mice. P-values are calculated with a two-sided Wilcoxon rank-sum test and are adjusted with Bonferroni correction. G) Clonal richness of transcriptional phenotypes in control and ICB-treated mice. P-values are calculated with a paired, two-sided Wilcoxon rank-sum test and are adjusted with Bonferroni correction.
Figure 6:
Figure 6:. Splenic tumor-reactive CD8+ T cells drive the response to ICB
A) Adoptive transfer experimental design. B-C) Frequency (B) and number (C) of 2C T cells in the TdLN and spleen 3 days after transfer into KP.SIY flank tumor-bearing mice, n = 10 (B) and n = 5 (C). P-values calculated with a Mann-Whitney U test. D) CTV dilution of 2C T cells in the TdLN and white pulp (spleen)3 days after transfer into KP.SIY flank tumor-bearing mice. E) Quantification of the fraction of 2C T cells in each cell division, n=4, P-values calculated with one-way ANOVA. F) Phenotype of 2C T cells 3 days after transfer to KP.SIY flank tumor-bearing mice. G) Quantification of the phenotype of 2C T cells 3 days after transfer to KP.SIY flank tumor-bearing mice, n = 10. P-value calculated with a Mann-Whitney U test. H) Experimental design of 2C T cell transfer into secondary recipients. I) Accumulation of transferred 2C T cells in secondary recipients. TdLN Control n = 13, TdLN ICB n=13, Spleen control n=14, Spleen ICB n=15. P-values calculated with one-way ANOVA.
Figure 7:
Figure 7:. Antigen levels and cross-presentation by DC1 impact SIY-reactive T cell differentiation in the spleen and subsequent trafficking to the tumor
A) Experimental scheme of 2C T cell adoptive transfer into KP.SIY or KP flank tumor-bearing secondary recipients. B) Numbers of recovered 2C T cells in secondary recipients with either KP.SIY or KP flank tumors, n=5 (or 4 for KP tumor). P-values calculated with Mann-Whitney U test. C) Experimental scheme of 2C T cell adoptive transfer into KP.SIY flank tumor-bearing WT or Batf3−/− secondary recipients. D) Numbers of recovered 2C T cells in KP.SIY flank tumor-bearing WT or Batf3−/− secondary recipients, n=5. P-values calculated with Mann-Whitney U test. E) Experimental Scheme of SIY-pulsed splenocyte transfer. F) Example flow cytometry plots of SIY-reactive T cell expression of CXCR3 and CX3CR1 in the spleen G) Percentage of splenic SIY-reactive CD8+ T cells that are CXCR3+CX3CR1+. H) Percentage of splenic SIY-reactive CD8+ T cells that are CXCR3CX3CR1+. I) CXCR3 MFI of splenic SIY-reactive CXCR3+CX3CR1+ CD8+ T cells. J) Relative CX3CR1 MFI of splenic SIY-reactive CXCR3+CX3CR1+ CD8+ T cell population. K) Number of SIY-reactive CD8+ T cells per gram of KP.SIY tumor in control mice with or without SIY-pulsed splenocyte transfer. L) Number of SIY-reactive CD8+ T cells per gram of KP.SIY tumor in ICB-treated mice with or without SIY-pulsed splenocyte transfer. For G-L, n=6, P-values calculated with one-way ANOVA (G-J) and Mann-Whitney U test (K-L).
Figure 8.
Figure 8.. Exhausted_KLR cells in human patients exhibit decreased migration from peripheral blood to tumor.
A-C) Expression of signatures for intermediate_1, exhausted_1, and exhausted_KLR phenotypes on clusters defined by Zheng et al. (43) D) Frequency of phenotypes present in peripheral blood among tumor-trafficking and non-tumor-trafficking clonotypes. P-values are calculated with a two-sided Wilcoxon rank-sum test and are adjusted with Bonferroni correction. E) Frequency of phenotypes present among tumor-infiltrating T cells related to Temra clonotypes from peripheral blood and all other tumor-infiltrating clonotypes. P-values are calculated with a two-sided Wilcoxon rank-sum test and are adjusted with Bonferroni correction. F) Frequency of phenotypes present among tumor-trafficking CD8+ T cells in blood and tumor. P-values are calculated with a two-sided Wilcoxon rank-sum test and are adjusted with Bonferroni correction. G) Ratio of clonal frequency in tissue to clonal frequency among Tm, Trm, Tem, Temra, and all other clonotypes. P-values are calculated by a Kruskal-Wallis rank-sum test followed by Dunn’s post-test. H) Frequency of endogenous CXCR3CX3CR1+ exhausted_KLR SIY-reactive CD8+ T cells from the white pulp, red pulp, and blood of day 14 KP.SIY tumor-bearing mice, n=11, P-values calculated with one-way ANOVA.

References

    1. Karasarides M, Cogdill AP, Robbins PB, Bowden M, Burton EM, Butterfield LH, et al. Hallmarks of Resistance to Immune-Checkpoint Inhibitors. Cancer Immunol Res. 2022;10(4):372–83. - PMC - PubMed
    1. Zehn D, Thimme R, Lugli E, de Almeida GP, Oxenius A. ‘Stem-like’ precursors are the fount to sustain persistent CD8(+) T cell responses. Nat Immunol. 2022;23(6):836–47. - PubMed
    1. Chow A, Perica K, Klebanoff CA, Wolchok JD. Clinical implications of T cell exhaustion for cancer immunotherapy. Nat Rev Clin Oncol. 2022;19(12):775–90. - PMC - PubMed
    1. Ribas A, Wolchok JD. Cancer immunotherapy using checkpoint blockade. Science. 2018;359(6382):1350–5. - PMC - PubMed
    1. Chen DS, Mellman I. Oncology meets immunology: the cancer-immunity cycle. Immunity. 2013;39(1):1–10. - PubMed

Publication types

Substances