. 2024 Sep 13;9(99):eadp6529.
doi: 10.1126/sciimmunol.adp6529. Epub 2024 Sep 13.

CD4+ T cells with convergent TCR recombination reprogram stroma and halt tumor progression in adoptive therapy

Affiliations

CD4+ T cells with convergent TCR recombination reprogram stroma and halt tumor progression in adoptive therapy

Steven P Wolf et al. Sci Immunol. .

Abstract

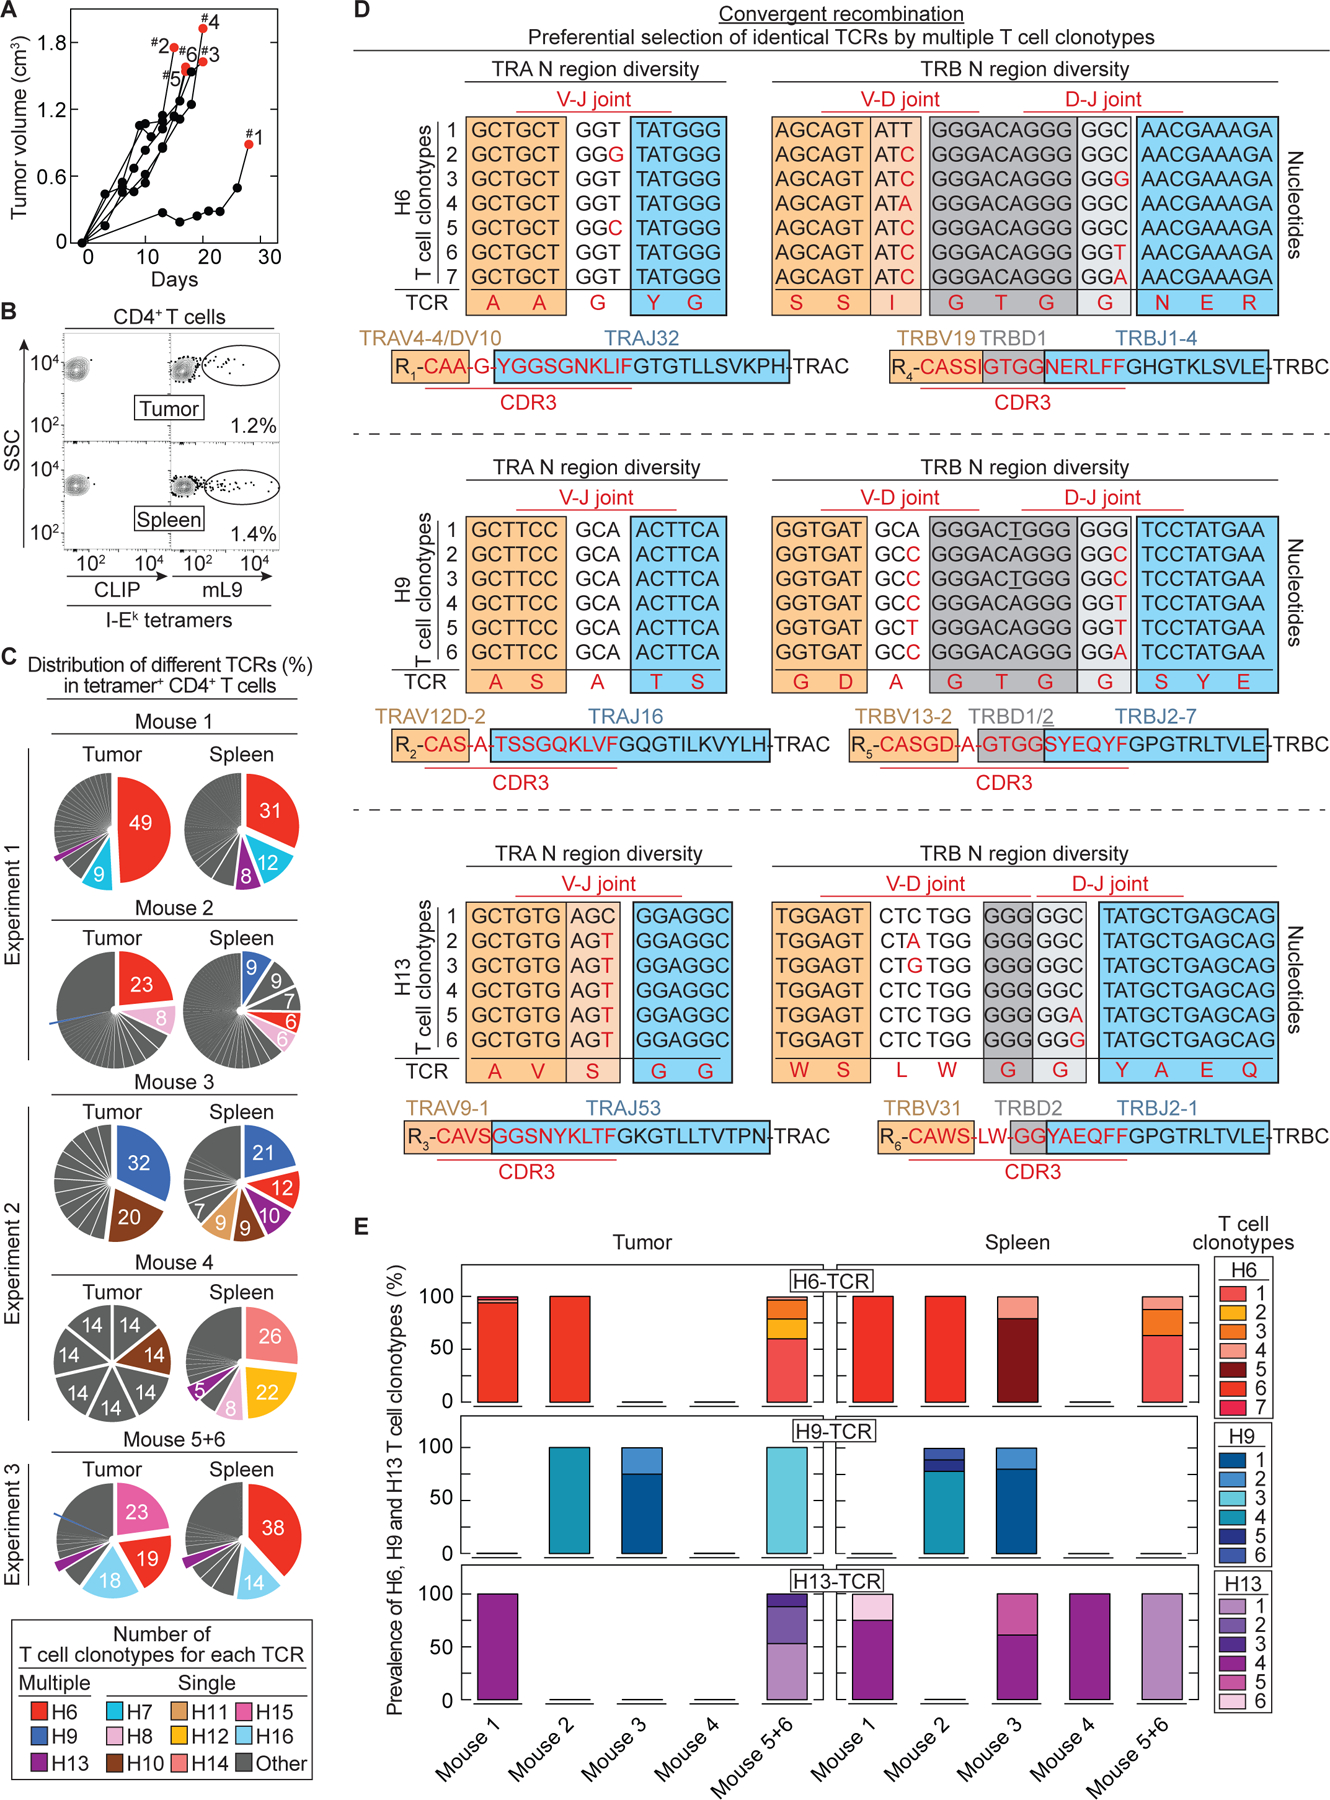
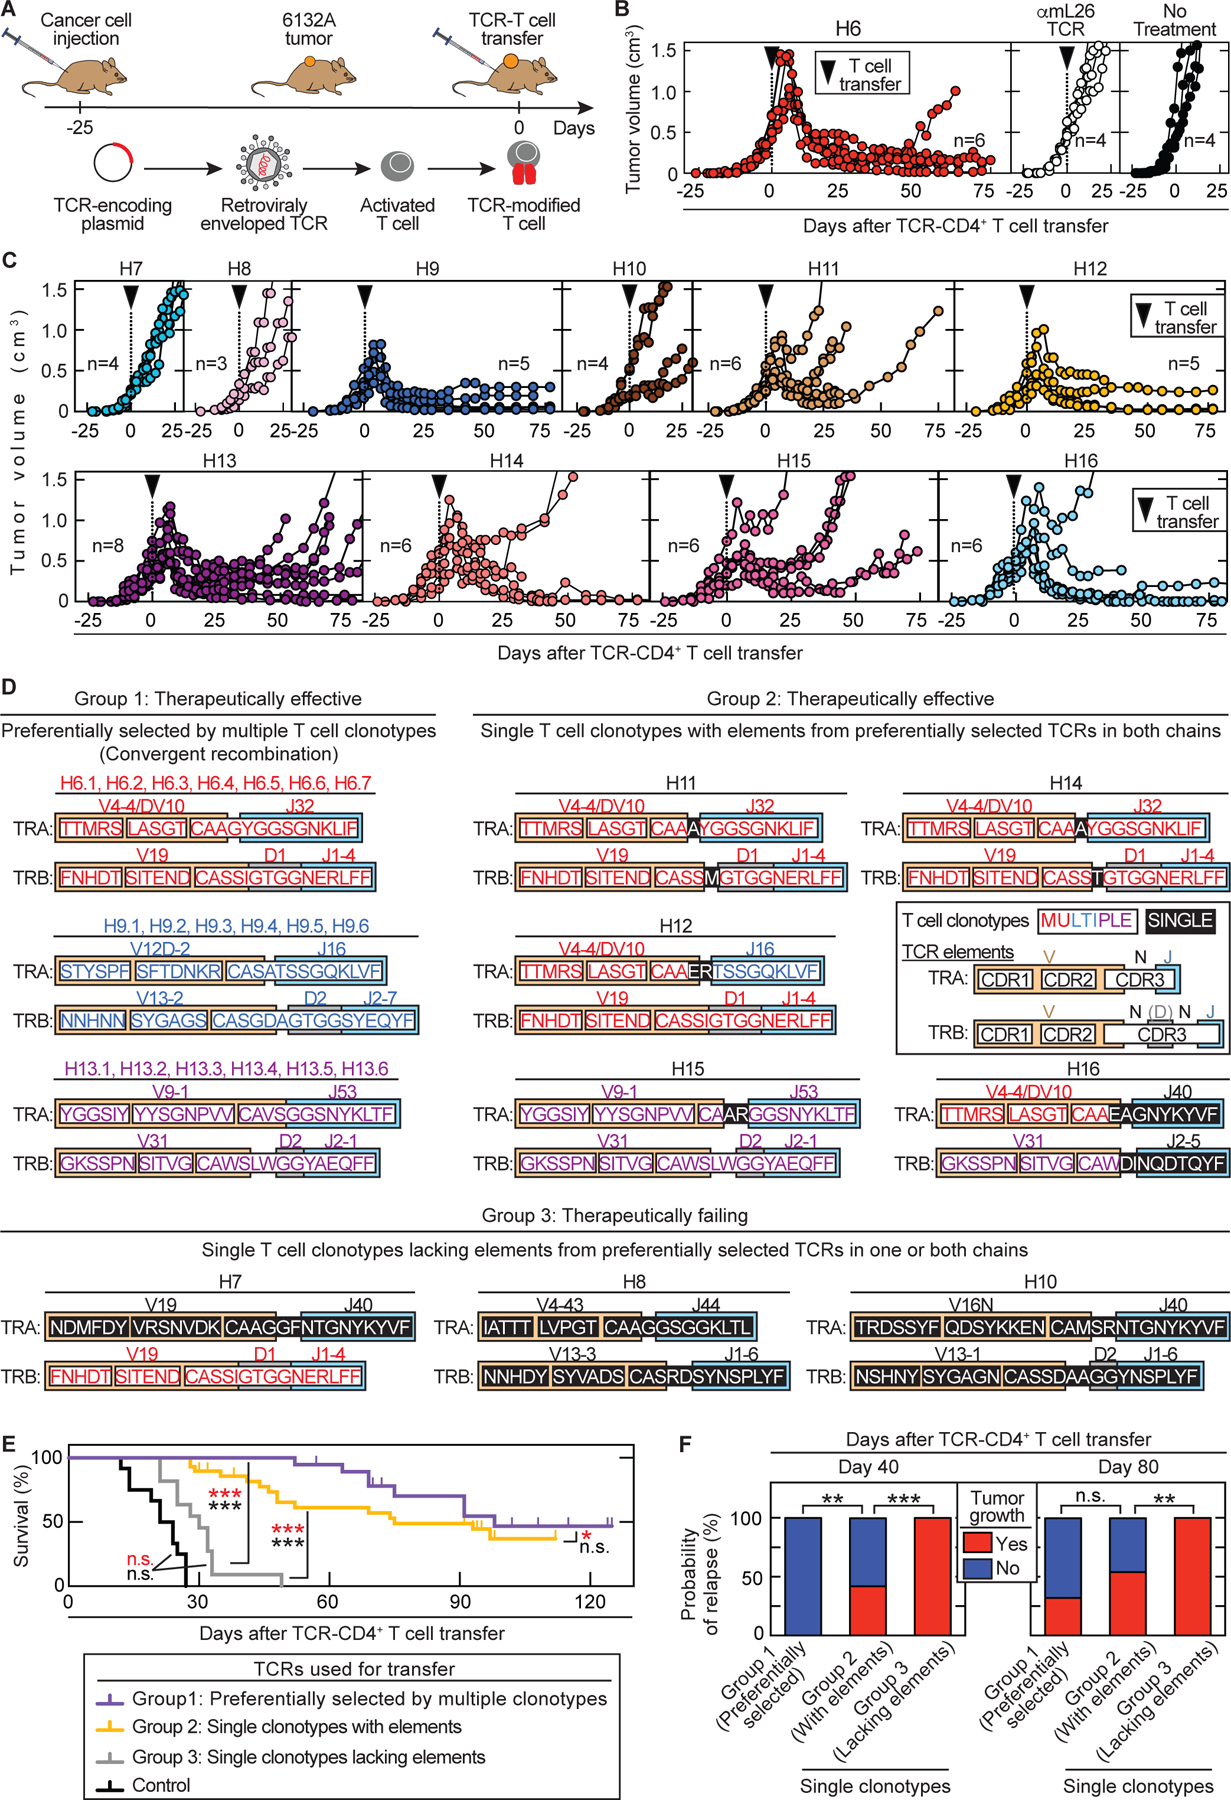
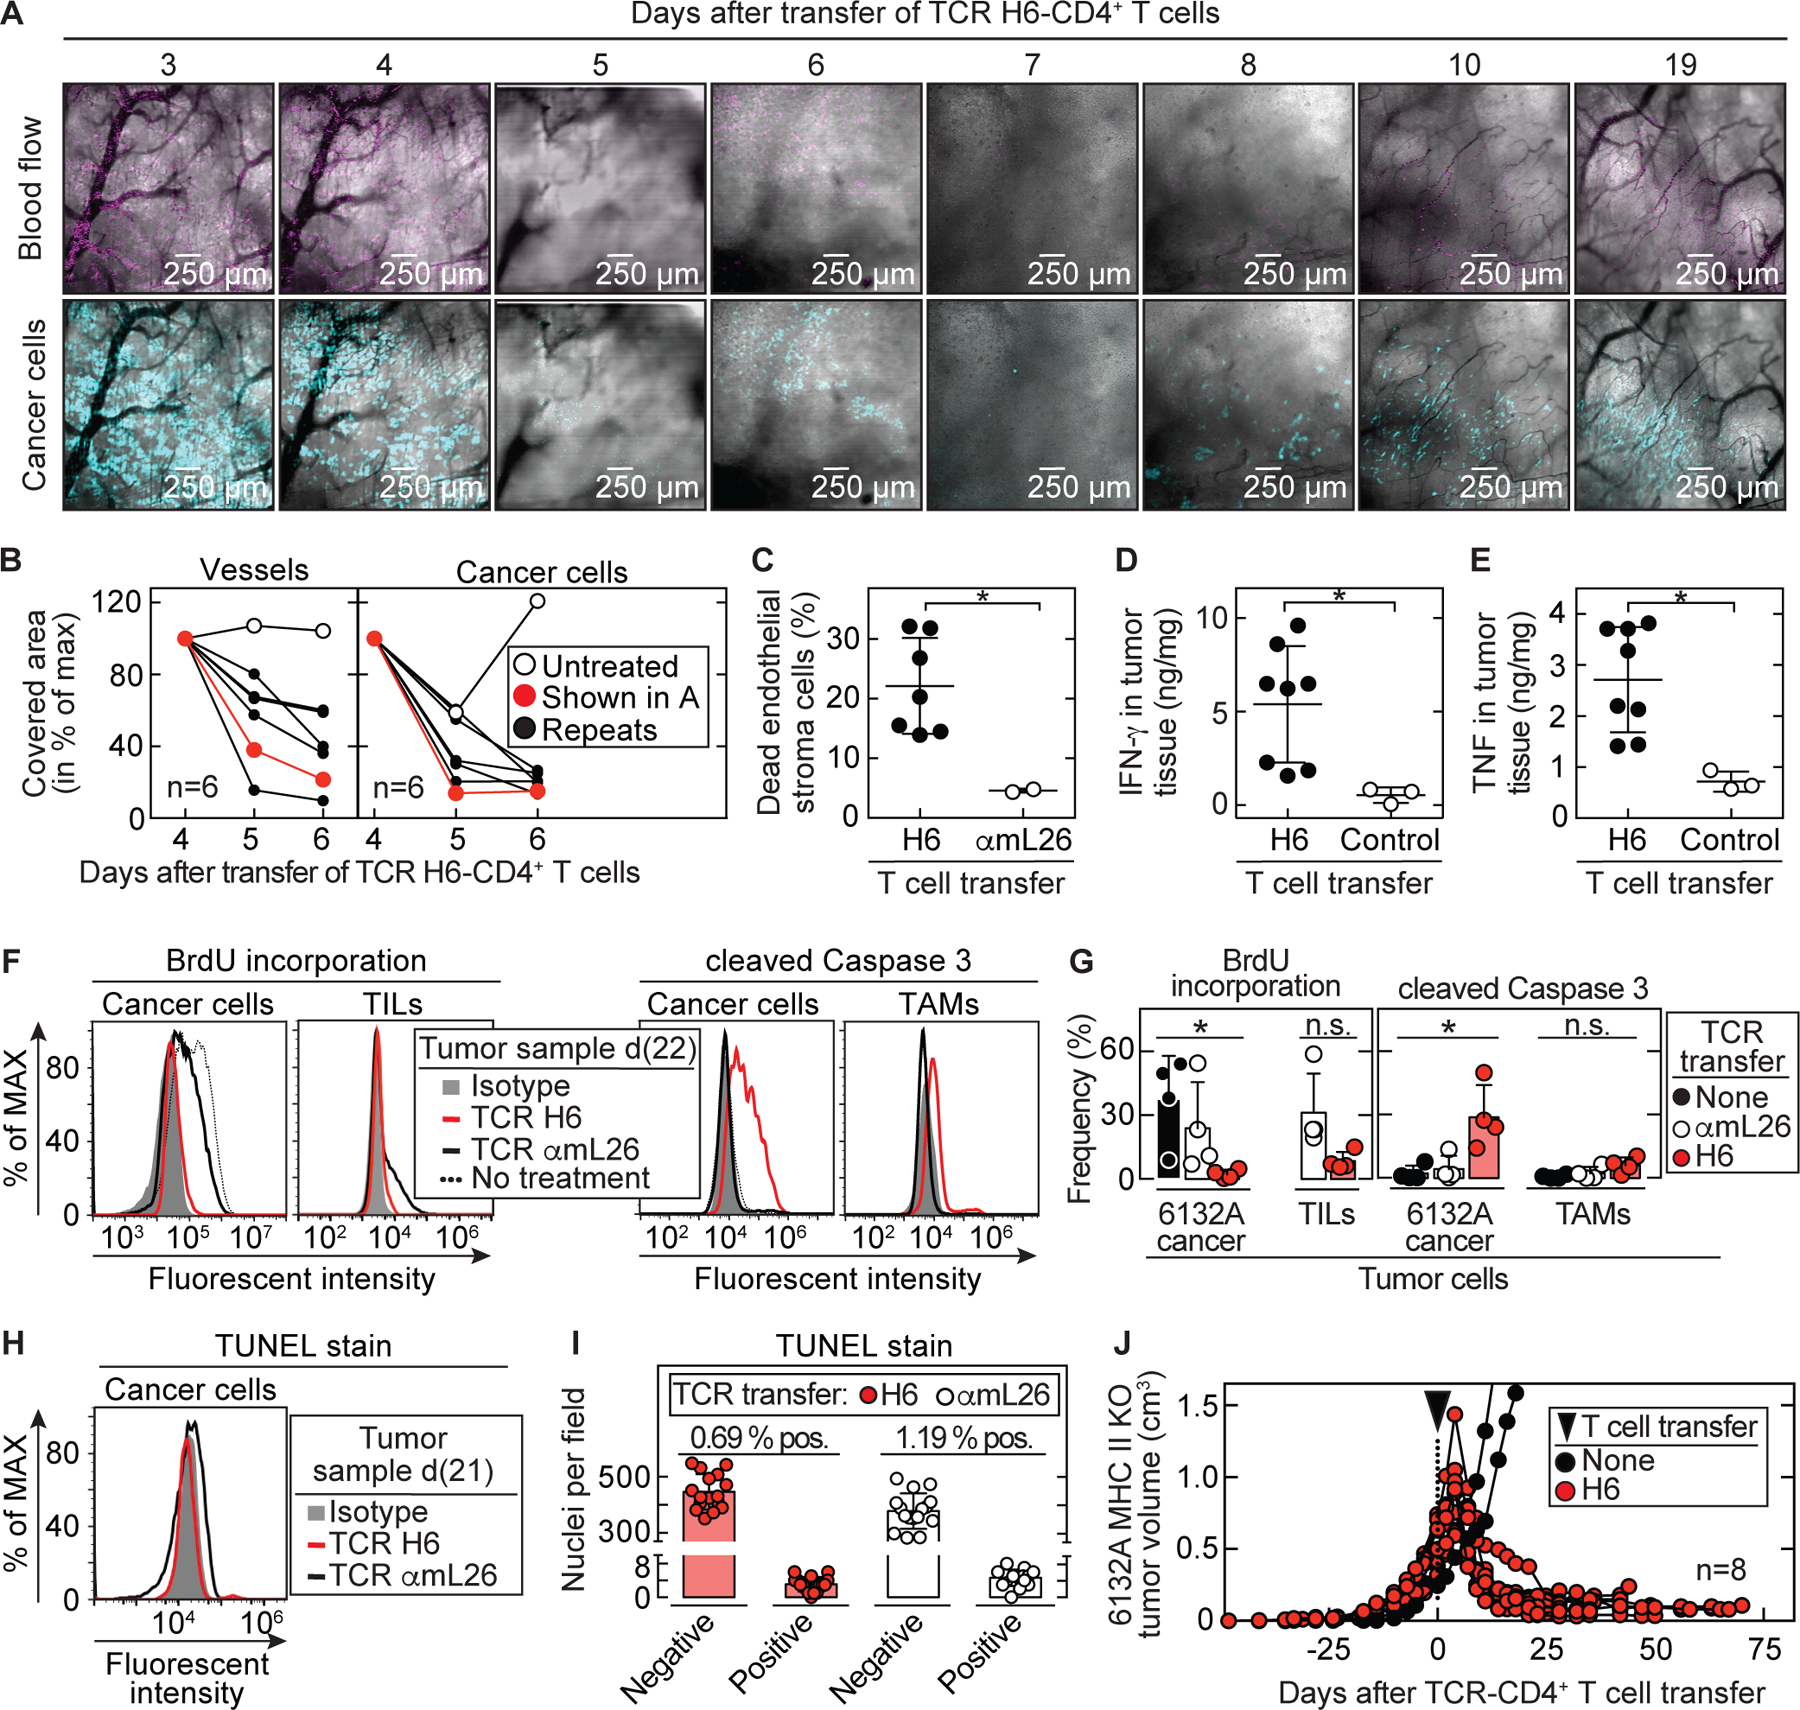
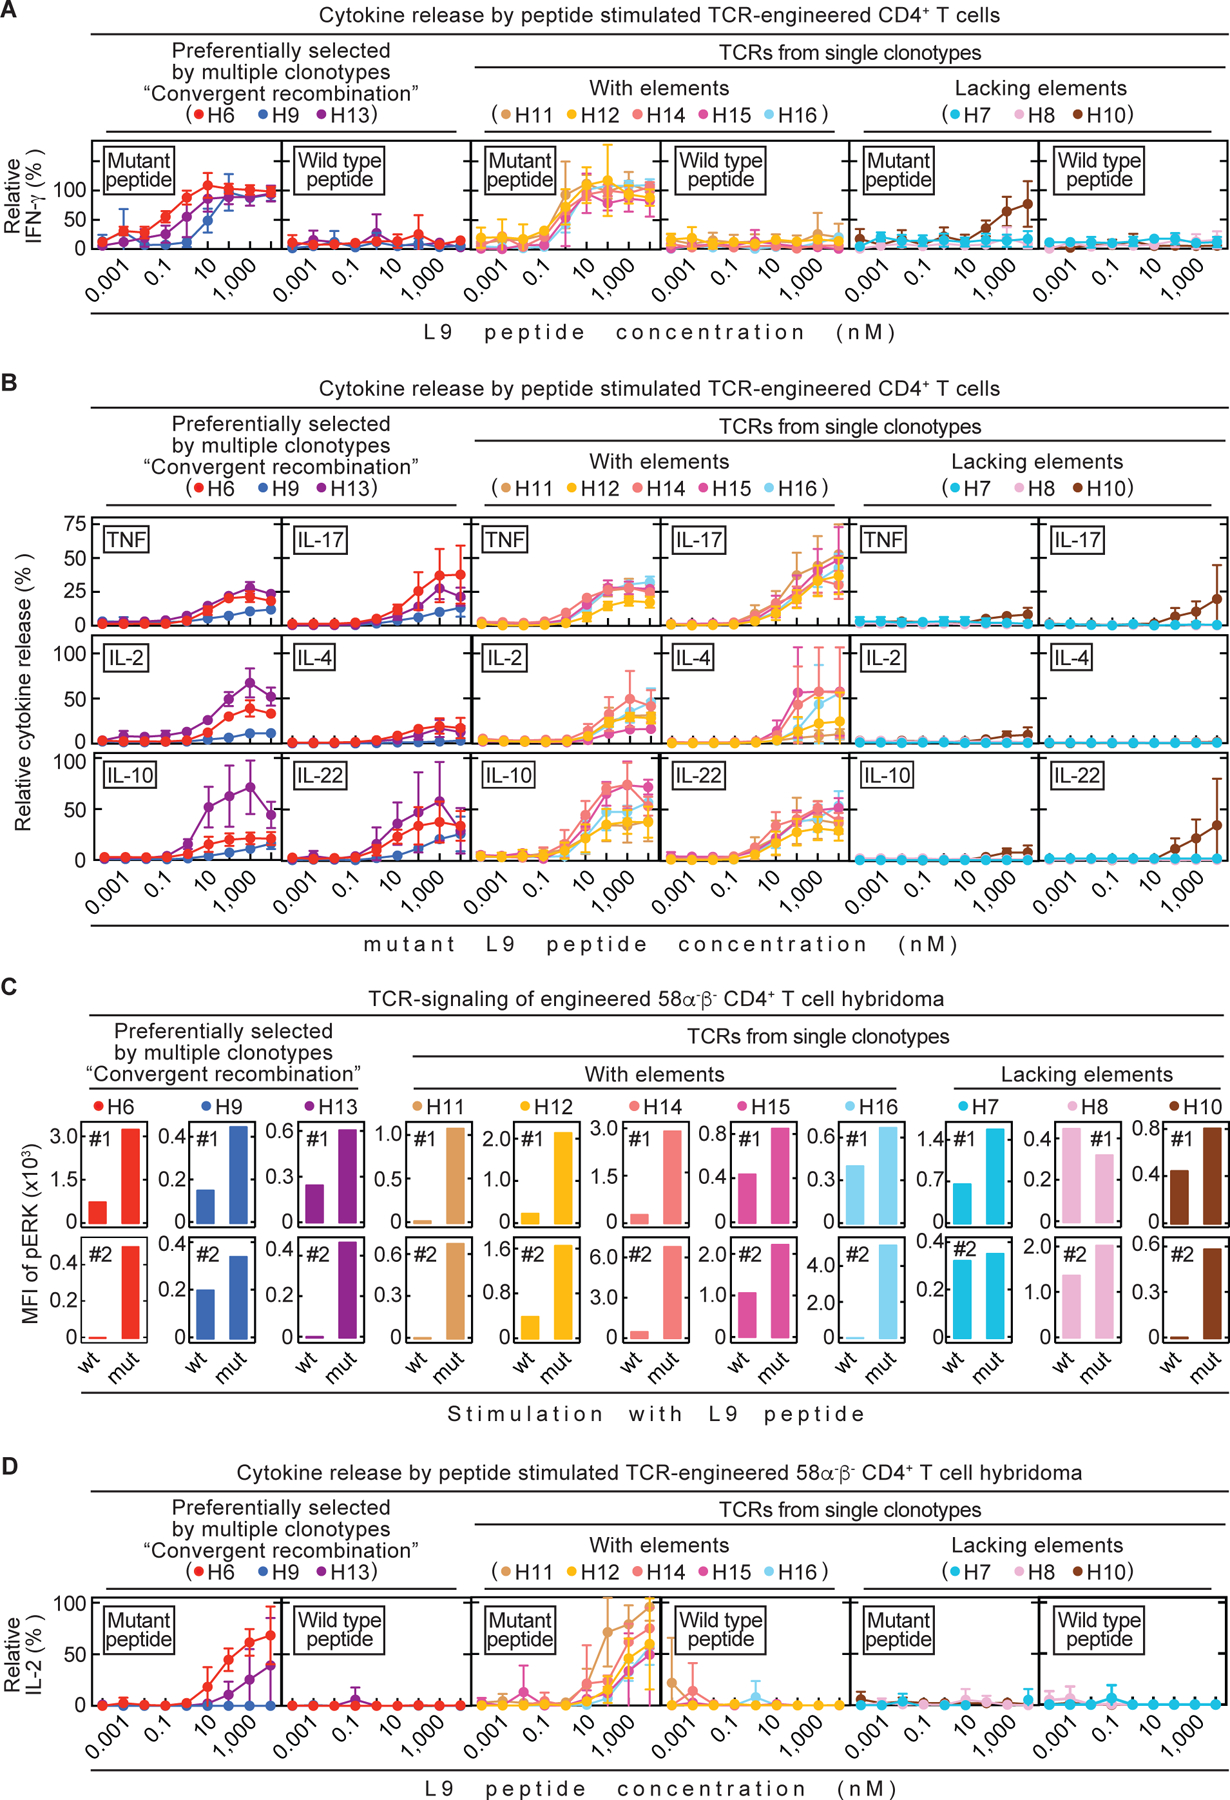
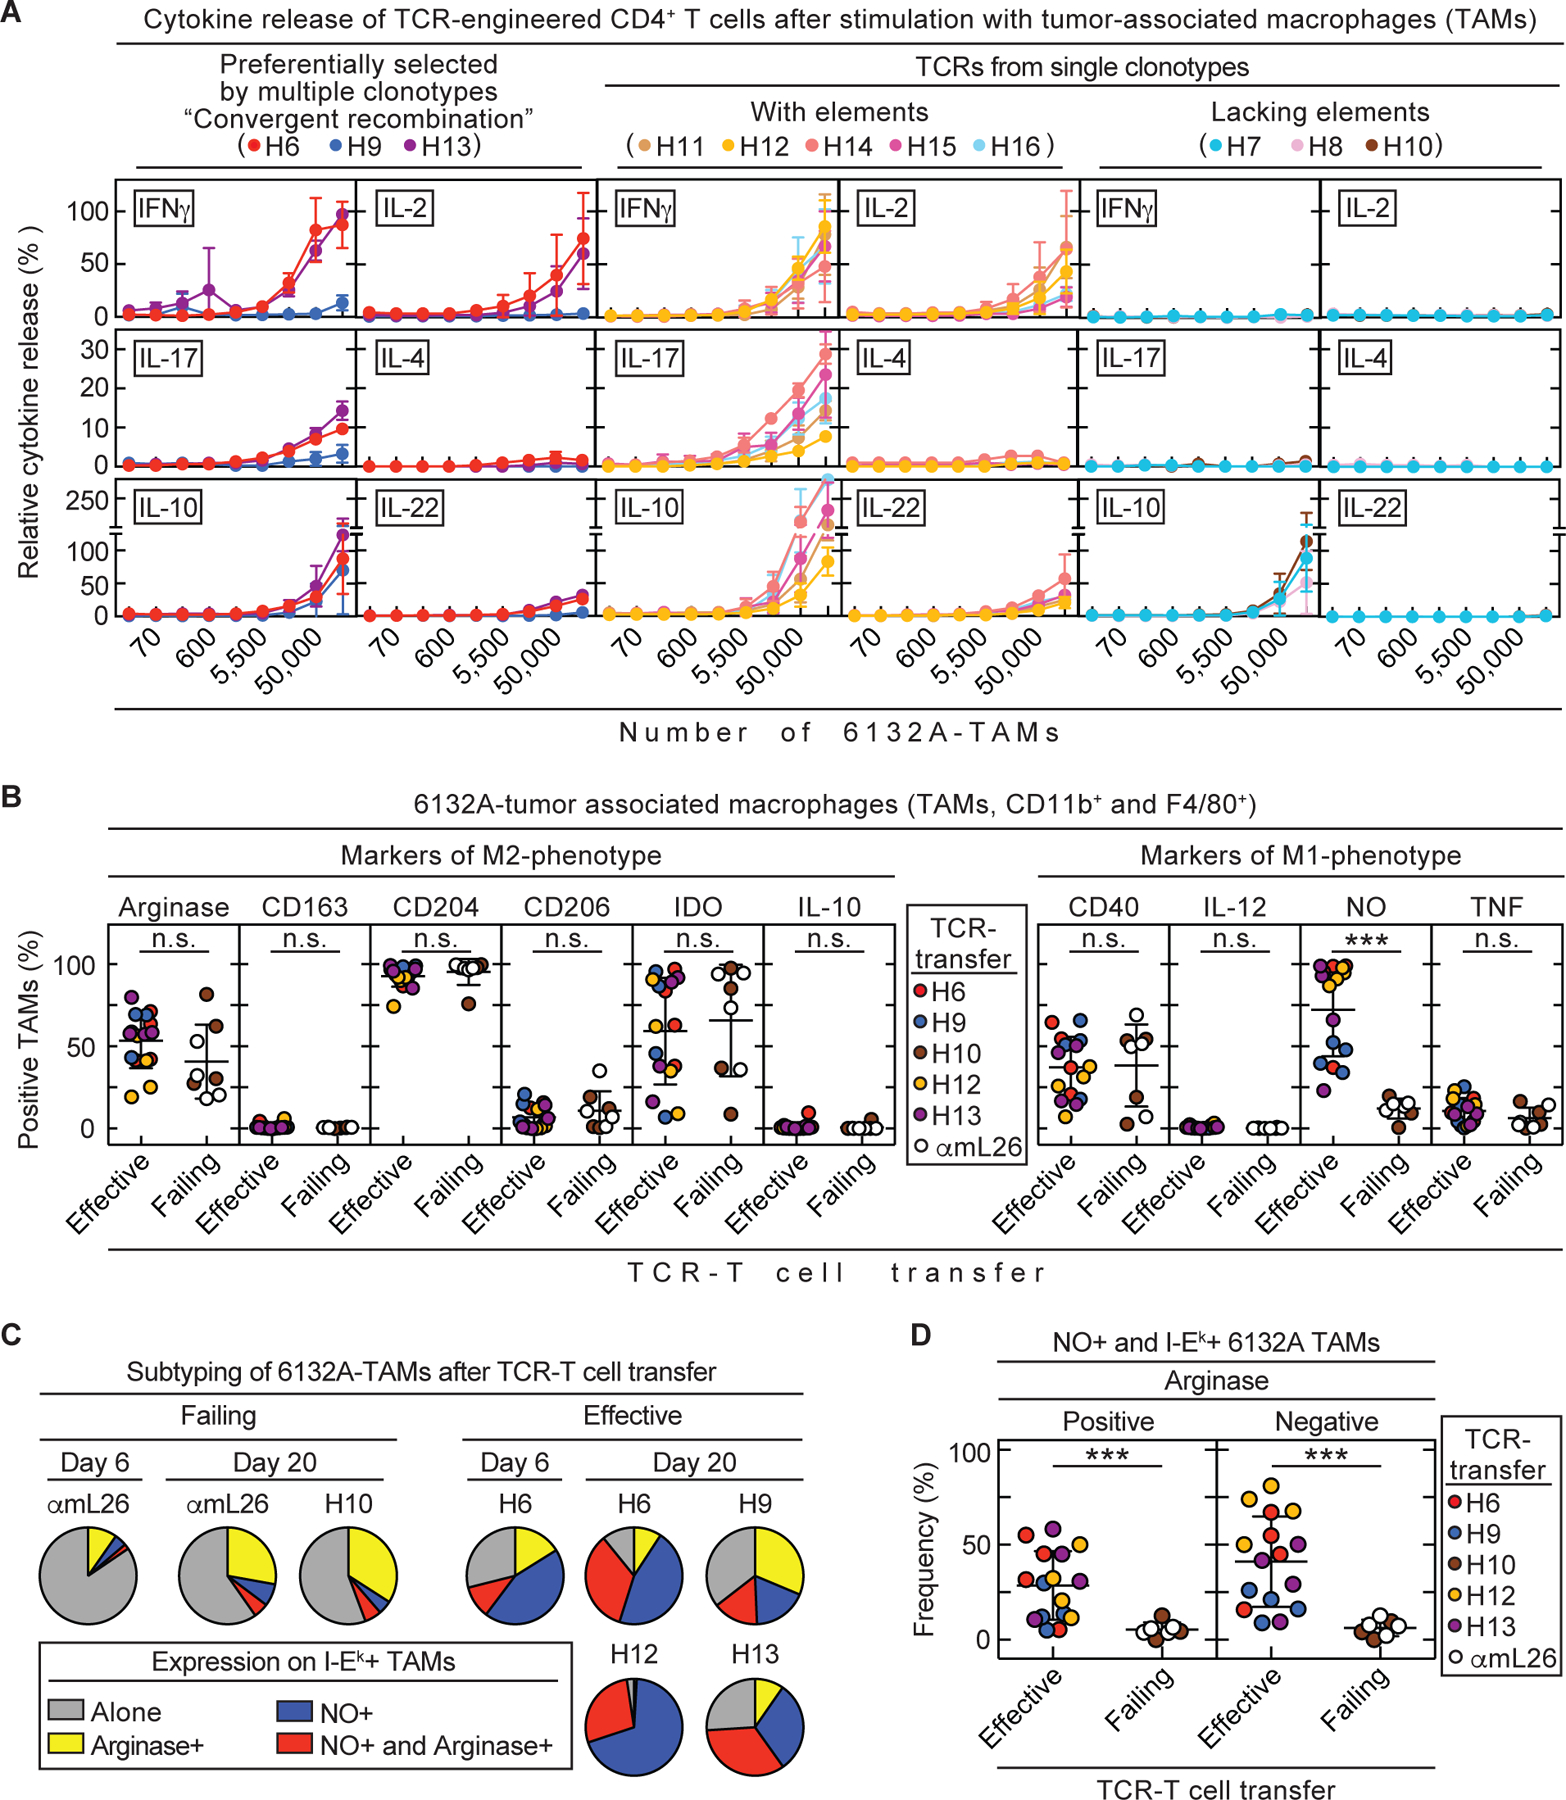
Cancers eventually kill hosts even when infiltrated by cancer-specific T cells. We examined whether cancer-specific T cell receptors of CD4+ T cells (CD4TCRs) from tumor-bearing hosts can be exploited for adoptive TCR therapy. We focused on CD4TCRs targeting an autochthonous mutant neoantigen that is only presented by stroma surrounding the MHC class II-negative cancer cells. The 11 most common tetramer-sorted CD4TCRs were tested using TCR-engineered CD4+ T cells. Three TCRs were characterized by convergent recombination for which multiple T cell clonotypes differed in their nucleotide sequences but encoded identical TCR α and β chains. These preferentially selected TCRs destroyed tumors equally well and halted progression through reprogramming of the tumor stroma. TCRs represented by single T cell clonotypes were similarly effective only if they shared CDR elements with preferentially selected TCRs in both α and β chains. Selecting candidate TCRs on the basis of these characteristics can help identify TCRs that are potentially therapeutically effective.


Conflict of interest statement

Competing interest: SPW, ML, KS and HS have patent WO2023049733A3 pending. The authors declare no other competing interests.

Figures

Fig. 1.
Fig. 1.. Convergent recombination of different T cell clonotypes encoding identical, preferentially selected TCRs against the mutant neoantigen mL9.
(A) 6132A tumor fragments were injected s.c. into C3H/HeN mice. Six mice are shown which developed tumors after fragment injection (55%, 11/20 injected C3H/HeN mice) and were used for TCR analysis. Results were compiled from three independent experiments. Red dots indicate day of T cell analysis. (B) An example is shown of T cells isolated from spleen and tumor sorted for live, CD3+, CD4+ and mL9-tetramer+ specificity. Percentages of mL9-tetramer positive T cells are indicated. CLIP-tetramer staining was used as negative control. (C) Frequencies of paired TCR CDR3 amino acid sequences in mL9-teramer sorted CD4+ T cells obtained from tumor and spleen of the six analyzed mice. (D) Identification of different T cell clonotypes encoding an identical TCR based on N nucleotide sequence diversity in the TRA and TRB V(D)J joints. This was determined for the TCRs H6 (upper TCR), H9 (middle TCR) and H13 (bottom TCR). (E) Frequency of the different T cell clonotypes encoding an identical TCR (either H6, H9 or H13) among the analyzed mice.
Fig. 2.
Fig. 2.. Therapeutically effective TCRs cause tumor destruction followed by long-term growth arrest and can be predicted by CDR elements of preferentially selected TCRs.
(A) Outline of adoptive transfer using TCR-engineered T cells. (B – C) Spleens from C3H CD8-/- mice were used as CD4+ T cell source for TCR engineering. C3H Rag-/- mice bearing 6132A tumors were treated with TCR-engineered CD4+ T cells 21 to 25 days after cancer cell injection as indicated by the arrow head. Total number of mice (n) is indicated. (B) Average tumor sizes were 0.558 cm3 ± 0.122 cm³ standard deviation at day of treatment. Data are summarized from three independent experiments. (left) Treatment was performed with H6-T cells (n = 6). (middle) Mice treated with αmL26-T cells, which are specific against an irrelevant antigen (n = 4) have the same outcome as (right) untreated mice (n = 4). (C) Average tumor sizes were 0.378 cm3 ± 0.156 cm³ standard deviation at day of treatment. Data are summarized from two independent experiments. Treatment with different TCR-engineered CD4+ T cells is indicated from left to right, top to bottom: H7 (n = 4), H8 (n = 3), H9 (n = 5), H10 (n = 4), H11 (n = 6), H12 (n = 5), H13 (n = 8), H14 (n = 6), H15 (n = 6) and H16 (n = 6). (D) The 11 TCRs fell into three groups based on therapeutic failure or efficacy (defined by >25% shrinkage of tumor volume) and whether being generated by multiple or single clonotypes. Color coding indicates whether CDR elements were shared in TRA and/or TRB with preferentially selected TCRs. (E – F) TCR-treatment Group 1: H6, H9, H13 (total n = 16). Group 2: H11, H12, H14, H15, H16 (total n = 29). Group 3: H7, H8 and H10 (total n = 11). (E) The three groups were compared in a survival analysis (*p ≤ 0.5, ***p ≤ 0.001 significance, n.s. – not significant). Log-rank test was used to determine significance indicated in black while significance indicated in red used the Wilcoxon test. (F) Probability of relapse at day 40 or 80 after start of T cell transfer among the three TCR-treatment groups. **p ≤ 0.01 and ***p ≤ 0.001 significance determined using a two-tailed Fischer’s exact test (n.s. – not significant).
Fig. 3.
Fig. 3.. Stroma recognition by CD4+ T cells is sufficient to cause tumor destruction followed by growth arrest.
(A) Example of longitudinal microscopy in 6132A-cerulean tumor bearing C3H Rag-/- mice after transfer of H6-T cells. Tumor areas were randomly chosen before therapy and analyzed for (B) vessel and cancer cell reduction (total n = 6). DiD-labeled erythrocytes were used to visualize blood flow. Imaged area (in pixels) that was covered by vessels (black) or cancer cells (blue) from day 4 was set to 100%. Following days were assigned as percentage of maximum covered area. Indicated are an untreated control mouse (open circle) and the H6-treated mouse (red) shown in (A). Histology of tumor and vessel destruction on day 6 are shown in Fig. S7. (C – E) Tumor tissue was analyzed on day 6, 7 and 8 after therapy by flow cytometry. Control tumors received either no T cells (total n = 1) or αmL26-T cells (total n = 2) and were analyzed at day 8. Results are means ± SD from two independent experiments. Significance between groups was determined by a two-tailed Student’s t-test with *p ≤ 0.05. (C) Tumors were analyzed for dead endothelial cells (Sytox-positive, CD146 and CD31 double-positive cell populations) (total n = 7). (D) IFN-γ and (E) TNF concentrations in tumor tissue were determined (total n = 8). (F – I) 6132A-ECFP was used for injection into C3H Rag-/- mice. (F – G) Tumors were left untreated (total n = 4) or treated with either H6- (total n = 4) or αmL26-T cells (total n = 4). Mice were injected with BrdU twice a day for three consecutive days before tumor tissue was isolated at day 20 – 25 after T cell transfer. (F) A representative flow cytometry analysis is shown. (left) 6132A-ECFP cancer cells and TILs (CD3+, CD4+ and mL9-tetramer+) were analyzed by flow cytometry for frequency of BrdU incorporation. (right) 6132A-ECFP cancer cells and TAMs (CD11b+, F4/80+) were analyzed by flow cytometry for activation of cleaved caspase 3. (G) Significance between groups of 6132A cancer cells was determined by an ordinary one-way ANOVA with *p 0.05 (n.s. – not significant). Results are compiled from three independent experiments. (H – I) Tumors were treated either with H6- or αmL26-T cells. Tumor tissue was isolated at day 20 – 22 after T cell transfer (H) Life 6132A-ECFP cancer cells were analyzed by TUNEL-stain using flow cytometry. One representative flow cytometry analysis is shown out of two independent experiments. (I) DNA damage on formalin-fixed paraffin-embedded 6132A tumor slides was determined using TUNEL stain by immunohistochemistry. Eight fields were counted per slide. Shown is the total number of nuclei that were either stained negative or positive for TUNEL. The proportion (%) of TUNEL positive nuclei was slightly higher (p = 0.0017) in αmL26-treated control samples (1.19 ± 0.45 %) compared to H6-treated samples (0.69 ± 0.39 %). (J) C3H Rag-/- mice bearing 6132A MHC II KO tumors (red, total n = 8) were treated with H6-T cells 31 to 35 days after cancer cell injection, indicated by the arrow head. Spleens from C3H CD8-/- mice were used as CD4+ T cell source for TCR-engineering. Average tumor sizes were 0.530 cm3 ± 0.170 cm³ standard deviation at day of treatment. Data are summarized from two independent experiments. Shown are untreated tumors (black, total n = 2) as control.
Fig. 4.
Fig. 4.. Analysis of TCR-engineered CD4+ T cells in vitro did not reliably predict therapeutic value in vivo.
All 11 TCRs were tested in vitro. (A – B) Spleens from C3H CD8-/- mice were used as source for CD4+ T cells. TCR-engineered CD4+ T cells were co-cultured 24 h with C3H/HeN spleen cells and various mutant or wild type L9 peptide concentrations. Data are means ± standard deviation and compiled from two independent experiments. (A) Supernatants were analyzed for IFN-γ concentrations by ELISA. (B) Supernatants were analyzed for various cytokines by flow cytometry. (C – D) TCR-engineered 58α-β- CD4+ T cell hybridomas were used for co-cultures together with LK35 B cell hybridoma as antigen presenting cell (APC) of either mutant or wild type L9 peptide. (C) Phosphorylation of ERK1/2, as a measure of TCR-signaling, was determined by flow cytometry (Mean fluorescent intensity (MFI)). Life, TCR β-chain positive 58α-β- cells were analyzed. Shown are both (#1, #2) independently performed experiments. (D) Co-cultures were performed for 24 h using various mutant or wild type L9 peptide concentrations. Supernatants were analyzed for IL-2 by ELISA. Data are means ± standard deviation and compiled from two independent experiments.
Fig. 5.
Fig. 5.. NO expression in 6132A tumor-associated macrophages is induced by T cells when transduced with therapeutically effective CD4TCRs.
(A – D) Spleens from C3H CD8-/- mice were used as CD4+ T cell source for TCR-engineering. (A) TCR-engineered CD4+ T cells were co-cultured 24 h with 3-fold dilutions of tumor-associated macrophages (F4/80+ cells) isolated from 6132A tumors grown in C3H Rag-/- mice. Supernatants were analyzed for various cytokines by flow cytometry. Data are means ± standard deviation and compiled from two independent experiments. (B – D) C3H Rag-/- mice bearing 6132A tumors were treated with either H6- (n = 4), H9- (n = 4), H10- (n = 4), H12- (n = 4), H13- (n = 4) or αmL26- (n = 4) TCR-engineered T cells 21 to 23 days after cancer cell injection. Tumor tissue was isolated at day 20 – 22 after T cell transfer. Tumors were analyzed by flow cytometry for frequency of life CD11b+ and F4/80+ 6132A tumor-associated macrophages (TAMs) expressing M1-type (CD40, IL-12, NO and TNF) or M2-type (arginase, CD163, CD204, CD206, IDO and IL-10) markers. TCR-Treatment was divided into effective (H6, H9, H12 and H13, n = 16) and failing (H10 and αmL26, n = 8) therapy groups. Therapeutically effective TCRs are able to induce tumor shrinkage by more than >25% volume within 12 days after T cell transfer. All other TCRs are considered therapeutically failing which also includes the control TCR αmL26. Number (n) indicates the total number of tumors analyzed from independent mice. (B) Comparison of M1- and M2-type markers of TAMs from effective or failing TCR-T cell therapy. Significance between groups was determined by an unpaired, two-tailed Student’s t-test with ***p ≤ 0.001 (n.s. – not significant). Data are compiled from two independent experiments (C) MHC class II I-Ek positive TAMs were further analyzed by their frequency of expressing either arginase, NO, both or none. Data are compiled from three independent experiments (D) Frequency of NO and I-Ek expressing TAMs that were either positive or negative for arginase. Significance between groups was determined by an unpaired, two-tailed Student’s t-test with ***p ≤ 0.001. Data are compiled from two independent experiments.

References

    1. Vogelstein B, Papadopoulos N, Velculescu VE, Zhou S, Diaz LA Jr., Kinzler KW, Cancer genome landscapes. Science 339, 1546–1558 (2013). - PMC - PubMed
    1. Monach PA, Meredith SC, Siegel CT, Schreiber H, A unique tumor antigen produced by a single amino acid substitution. Immunity 2, 45–59 (1995). - PubMed
    1. Wölfel T, Hauer M, Schneider J, Serrano M, Wölfel C, Klehmann-Hieb E, De Plaen E, Hankeln T, Meyer zum Buschenfelde KH, Beach D, A p16INK4a-insensitive CDK4 mutant targeted by cytolytic T lymphocytes in a human melanoma. Science 269, 1281–1284 (1995). - PubMed
    1. Tran E, Robbins PF, Rosenberg SA, 'Final common pathway' of human cancer immunotherapy: targeting random somatic mutations. Nat Immunol 18, 255–262 (2017). - PMC - PubMed
    1. Haslam A, Prasad V, Estimation of the Percentage of US Patients With Cancer Who Are Eligible for and Respond to Checkpoint Inhibitor Immunotherapy Drugs. JAMA Netw Open 2, e192535 (2019). - PMC - PubMed

Publication types

Substances