. 2024 Sep 13;10(37):eado5545.
doi: 10.1126/sciadv.ado5545. Epub 2024 Sep 13.

A pleiotropic recurrent dominant ITPR3 variant causes a complex multisystemic disease

Anne Molitor  1   2 Alexandre Lederle  1   2 Mirjana Radosavljevic  1   2   3 Vinay Sapuru  4   5 Megan E Zavorka Thomas  6 Jianying Yang  1   2 Mahsa Shirin  1   2 Virginie Collin-Bund  1   2 Katerina Jerabkova-Roda  1   7 Zhichao Miao  8   9 Alice Bernard  1   2   3 Véronique Rolli  1   2   3 Pierre Grenot  1   2 Carla Noemi Castro  10 Michelle Rosenzwajg  11   12 Elyssa G Lewis  13 Richard Person  14 Uxía-Saraiva Esperón-Moldes  15 Milja Kaare  15 Pekka T Nokelainen  15 Nurit Assia Batzir  16 Gal Zaks Hoffer  16 Nicodème Paul  1   2 Tristan Stemmelen  1   2   3 Lydie Naegely  1   2 Antoine Hanauer  1   2 Sabrina Bibi-Triki  1   2 Sarah Grün  10   17 Sophie Jung  1   18 Ignacio Busnelli  1 Kornelia Tripolszki  19 Ruslan Al-Ali  19 Natalia Ordonez  19 Peter Bauer  19 Eunkyung Song  20 Kristin Zajo  21 Santiago Partida-Sanchez  22 Frank Robledo-Avila  22 Attila Kumanovics  23 Yoram Louzoun  24 Aurélie Hirschler  25 Angélique Pichot  1   2 Ori Toker  26   27 Cesar Andrés Muñoz Mejía  28 Nima Parvaneh  29 Esther Knapp  13 Joseph H Hersh  13 Heather Kenney  30 Ottavia M Delmonte  30 Luigi D Notarangelo  30 Jacky G Goetz  1   7 Samir B Kahwash  6 Christine Carapito  25 Rajinder P S Bajwa  31 Caroline Thomas  32 Stephan Ehl  10 Bertrand Isidor  33 Raphael Carapito  1   2   3 Roshini S Abraham  6 Richard K Hite  4 Nufar Marcus  34   35   36 Aida Bertoli-Avella  19 Seiamak Bahram  1   2   3
Affiliations

A pleiotropic recurrent dominant ITPR3 variant causes a complex multisystemic disease

Anne Molitor et al. Sci Adv. .

Abstract

Inositol 1,4,5-trisphosphate (IP3) receptor type 1 (ITPR1), 2 (ITPR2), and 3 (ITPR3) encode the IP3 receptor (IP3R), a key player in intracellular calcium release. In four unrelated patients, we report that an identical ITPR3 de novo variant-NM_002224.3:c.7570C>T, p.Arg2524Cys-causes, through a dominant-negative effect, a complex multisystemic disorder with immunodeficiency. This leads to defective calcium homeostasis, mitochondrial malfunction, CD4+ lymphopenia, a quasi-absence of naïve CD4+ and CD8+ cells, an increase in memory cells, and a distinct TCR repertoire. The calcium defect was recapitulated in Jurkat knock-in. Site-directed mutagenesis displayed the exquisite sensitivity of Arg2524 to any amino acid change. Despite the fact that all patients had severe immunodeficiency, they also displayed variable multisystemic involvements, including ectodermal dysplasia, Charcot-Marie-Tooth disease, short stature, and bone marrow failure. In conclusion, unlike previously reported ITPR1-3 deficiencies leading to narrow, mainly neurological phenotypes, a recurrent dominant ITPR3 variant leads to a multisystemic disease, defining a unique role for IP3R3 in the tetrameric IP3R complex.


Figures

Fig. 1.
Fig. 1.. An identical de novo pathogenic ITPR3 variant in four independent families.
(A) Pedigrees of four affected families suffering from a complex immunodeficiency syndrome in childhood. Generations are designated by Roman numerals and subjects by Arabic numerals. Squares: male subjects; circles: female subjects; triangle: miscarriage; filled (black) symbols indicate patients, while unfilled (white) symbols indicate unaffected family members. Arrows denote probands in each family. Stars indicate individuals subjected to WES. All probands were heterozygous, and the parents and the tested unaffected siblings were wild type (WT) (W: WT allele, M: mutant/variant allele). (B) Ectodermal dysplasia: In patient 1 (left two pictures), sparse and thin scalp hair, sparse and hypopigmented eyebrows, dysmorphic cone-shaped mandibular primary incisors, and lastly the presence of diastema between the teeth is shown (see also an orthopantomogram as well as additional pictures of the patient in fig. S1A). Patient 2 (middle two pictures) displays sparse/thin hair and xerosis (further pictures are available in fig. S1B). One further notes an abnormal shape for teeth, e.g., cone-shaped primary incisors (except maxillary central incisors), and the presence of diastema between the teeth. Patient 4 (right two pictures) had similar anomalies to those of other patients. Additional pictures in fig. S1.
Fig. 2.
Fig. 2.. Effects of the ITPR3 variant on ITPR3 mRNA and IP3R2 and IP3R3 protein expression.
(A) ITPR3 mRNA expression in patient 1’s HDFs (n = 2 independent experiments), patient 2’s PBMCs (n = 3), patient 4’s HDFs (n = 3), and blood (n = 3) versus those from various controls and (B) in CRISPR-Cas9–edited Jurkat cells (n = 3, KI = IP3R3 R2524C knock-in, KO = IP3R3 knock-out) as measured by reverse transcription quantitative polymerase chain reaction (RT-qPCR), normalized to housekeeping genes GAPDH and β-actin. (C and D) Representative Western blot of IP3R3 (top) and calnexin (bottom) in (C) patient 1’s HDFs versus age-matched control HDFs and (D) in five CRISPR-Cas9–edited Jurkat cells. Right [(C) and (D)]: Relative IP3R3 expression quantification by Western blot band intensity normalized to calnexin (n = 3 independent experiments each). (E and F) Representative Western blot of IP3R2 (top) and calnexin (bottom) in (E) patient 1’s HDFs compared to control HDFs and (F) in the above-described five CRISPR-Cas9–edited Jurkat cells as well as in a negative control (IP3R2 CRISPR-Cas9 KO in Jurkat cells). Right [(E) and (F)]: Relative IP3R2 expression quantification by Western blot band intensity normalized to calnexin [n = 3 for both (E) and (F)]. All values are represented as mean ± SD. Statistics: (A), (C), and (E): T test; (B), (D), and (F): One-way analysis of variance (ANOVA) [*P < 0.05, **P < 0.01, ***P < 0.001, ****P <0.0001, and P > 0.05 (not shown)]. Data values are provided in Table S3.
Fig. 3.
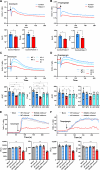
Fig. 3.. Consequences of IP3R3 R2524C variant on calcium flux.
(A to D) Calcium flux kinetics of patient 1’s HDFs (n = 3) and Jurkat cells (n = 5) measured by the Ca2+ indicator Indo-1 fluorescence ratio after stimulation (arrow) with 1 μM ionomycin [(A) and (C)] or 1 μM thapsigargin [(B) and (D)] in the presence of 5 mM EGTA over 200 time points with 650-ms intervals (mean of n = 3 independent experiments). Bottom left represents mean AUC, and bottom right represents mean peaks. (E and F) Representative calcium flux kinetics of Jurkat cells (from n = 6 replicates) transfected with the indicated ITPR3-expressing plasmids as measured by the Ca2+ indicator Indo-1 fluorescence ratio after stimulation (arrow) with 1 μM ionomycin (E) or 1 μM thapsigargin (F). All bar graph values are represented as mean ± SD. Statistics: (A) and (B): T test; (C) to (F): One-way ANOVA [*P < 0.05, **P < 0.01, ***P < 0.001, ****P < 0.0001, and P > 0.05 (not shown)]. Data values are provided in table S3.
Fig. 4.
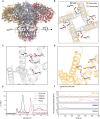
Fig. 4.. Structure function assessment of IP3R3 R2524 variants.
(A) Cartoon representation of the side view of tetrameric human IP3R3. R2524 is located in the dashed box that is shown in (B). (B) Superposition of closed and open states of IP3R3 (residues 2488 to 2537) highlighting the movement of R2524 during transition from the closed, resting state (gray) to an open, activated state (orange). (C and D) Representation showing interprotomer interactions formed by R2524 in the resting state (C) and in the activated state (D). (E) Fluorescence detection size exclusion chromatography profile of HEK293T-IP3R-null cells and cells expressing WT-IP3R3, R2524C, R2524A, or R2524E. Inset magnifies the ~12-ml peak for cells expressing WT-IP3R3, R2524C, or untransduced cells. The ~8-ml peak corresponds to the void volume of the column, which is present in all samples, The ~12-ml peak corresponds to folded, tetrameric channels and is absent from the untransduced cells. The ~16-ml peak corresponds to an endogenous protein that we can detect in all samples. (F) Representative Cal-520-AM fluorescence traces recorded from a cell expressing WT-IP3R3, R2524C, R2524A, and R2524E variants, respectively, in an IP3R-null background following stimulation by carbachol. LU, luminescence units; AU, arbitrary units; AFU, arbitrary fluorescence units.
Fig. 5.
Fig. 5.. Proteomics and RNA-seq analyses of ITPR3 patients.
(A) Volcano plot representing the differentially expressed proteins in dermal fibroblasts of patient 1 compared to four controls. The red dots represent the proteins that are differentially expressed with a corrected P value < 0.05 and a minimal fold change of 1.5. Labels correspond to proteins of the MAMs family that are all down-regulated. (B) GSEA plot showing negative enrichment of proteins of the mitochondrial cellular compartment. (C) Positive and negative enrichment of Gene Ontology (GO) cellular processes in fibroblasts of patient 1. (D) Volcano plot representing the differentially expressed genes and proteins in PBMCs of patient 2 compared to six controls. The dots represent the proteins (red) and the transcripts (blue) that are differentially expressed with a corrected P value < 0.05 and a minimal fold change of 1.5. Labels correspond to up-regulated genes and up-regulated proteins of the GO category “regulation of vesicle-mediated transport.” (E) GSEA plot showing positive enrichment of proteins of the secretory vesicle pathways. NES, normalized enrichment score. (F) Positive and negative enrichment of GO cellular processes in patient 2. (G) Volcano plot representing the differentially expressed genes in whole blood of patient 4 compared to three age-matched controls. The blue dots represent genes that are differentially expressed with a corrected P value < 0.05 and a minimal fold change of 2. Labels correspond to up-regulated genes of the GO category regulation of vesicle-mediated transport. (H) GSEA plot showing positive enrichment of genes of the secretory vesicle pathways. (I) Positive and negative enrichment of GO cellular processes in whole blood of patient 4.
Fig. 6.
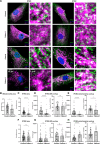
Fig. 6.. IP3R3 localization in patient 1 HDFs by immunofluorescence and confocal microscopy.
(A) Confocal microscopy images of patient 1 and age-matched control HDFs labeled against IP3R3 (left two columns) (green), IP3R2 (right two columns) (green), ER (top, magenta), or mitochondria (bottom, magenta). Each condition is represented as a whole cell image and a ×40 magnification of regions highlighted by yellow squares. All conditions were also labeled for nuclei (blue). Colocalizing regions appear in white. (B) Mitochondrial area normalized to the total cell area of patient 1 and age-matched control HDFs (n = 50 and n = 64, respectively). (C) IP3R3 area normalized to the total cell area in patient 1 and age-matched control HDFs (n = 59 and n = 59, respectively). (D) IP3R3 and ER area overlaps represented as total overlap count (left) and as percentage of whole cell IP3R3 area (right) (patient n = 31 and control n = 30). (E) IP3R3 and mitochondrial overlaps represented as the total overlap count (left) and as percentage of whole cell IP3R3 area (right) (patient n = 28 and control n = 29). (F) IP3R2 area normalized to the total cell area in patient 1 and age-matched control HDFs (n = 60 and n = 75, respectively). (G) IP3R2 and ER overlaps represented as the total overlap count (left) and as the percentage of whole-cell IP3R2 area (right) (patient n = 37 and control n = 37). (H) IP3R2 and mitochondria overlaps represented as the total overlap count (left) and as a percentage of whole cell IP3R2 area (right) (patient n = 23 and control n = 38). All experiments were performed in triplicate. Mann-Whitney test was used. *P < 0.05, **P < 0.01, and ****P < 0.0001. ns, not significant.
Fig. 7.
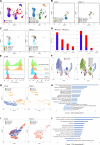
Fig. 7.. Immunophenotyping, cell proliferation, and scRNA-seq analyses.
(A) General uniform manifold approximation and projection (UMAP) representing the major cell populations identified in the whole blood samples from patient 2 and healthy control individuals as analyzed by 40 color spectral flow cytometry (left) with a focus on T/NK cells (right). (B) CD8+ T cell subpopulations in control and patient 2 are shown on a UMAP. (C) CD4+ T cell subpopulations in control and patient 2 are shown on a UMAP. (D) Frequencies (bar graph) of cell repartition of naïve, EM, TEMRA, and CM cells in CD8+ and CD4+ T compartments for patient 2 and control. (E) Healthy control (left) and patient 4 (right) CD45+CD3+ cell proliferation upon stimulation with the indicated stimuli measured by the Click-iT EdU assay showing that patient 4 T cells are less responsive to stimulation. Data are representative of a minimum of two independent experiments. (F) General UMAP representing major cell populations detected in the whole blood of patient 2 and healthy control individual by scRNA-seq. (G) scRNA-seq–identified CD8+ T cell subpopulations in control and patient 2 are shown on a UMAP. (H) Positive and negative enrichment of GO cellular processes in scRNA-seq–identified CD8+ T cells of patient 2. All signaling pathways have a q value < 0.05. (I) scRNA-seq–identified CD4+ T cell subpopulations in control and patient 2 are shown on a UMAP. Cell numbers are indicated in parentheses. (J) Positive and negative enrichment of GO cellular processes in scRNA-seq–identified CD4+ T cells of patient 2. All signaling pathways had a q value < 0.05.

References

    1. Luan S., Wang C., Calcium signaling mechanisms across kingdoms. Annu. Rev. Cell Dev. Biol. 37, 311–340 (2021). - PubMed
    1. Bakowski D., Murray F., Parekh A. B., Store-operated Ca2+ channels: Mechanism, function, pharmacology, and therapeutic targets. Annu. Rev. Pharmacol. Toxicol. 61, 629–654 (2021). - PubMed
    1. Trebak M., Kinet J. P., Calcium signalling in T cells. Nat. Rev. Immunol. 19, 154–169 (2019). - PMC - PubMed
    1. Berridge M. J., The inositol trisphosphate/calcium signaling pathway in health and disease. Physiol. Rev. 96, 1261–1296 (2016). - PubMed
    1. Paknejad N., Hite R. K., Structural basis for the regulation of inositol trisphosphate receptors by Ca2+ and IP3. Nat. Struct. Mol. Biol. 25, 660–668 (2018). - PMC - PubMed