. 2024 Sep 13;10(37):eadi7673.
doi: 10.1126/sciadv.adi7673. Epub 2024 Sep 13.

Blocking tumor-intrinsic MNK1 kinase restricts metabolic adaptation and diminishes liver metastasis

Affiliations

Blocking tumor-intrinsic MNK1 kinase restricts metabolic adaptation and diminishes liver metastasis

Samuel E J Preston et al. Sci Adv. .

Abstract

Dysregulation of the mitogen-activated protein kinase interacting kinases 1/2 (MNK1/2)-eukaryotic initiation factor 4E (eIF4E) signaling axis promotes breast cancer progression. MNK1 is known to influence cancer stem cells (CSCs); self-renewing populations that support metastasis, recurrence, and chemotherapeutic resistance, making them a clinically relevant target. The precise function of MNK1 in regulating CSCs, however, remains unexplored. Here, we generated MNK1 knockout cancer cell lines, resulting in diminished CSC properties in vitro and slowed tumor growth in vivo. Using a multiomics approach, we functionally demonstrated that loss of MNK1 restricts tumor cell metabolic adaptation by reducing glycolysis and increasing dependence on oxidative phosphorylation. Furthermore, MNK1-null breast and pancreatic tumor cells demonstrated suppressed metastasis to the liver, but not the lung. Analysis of The Cancer Genome Atlas (TCGA) data from breast cancer patients validated the positive correlation between MNK1 and glycolytic enzyme protein expression. This study defines metabolic perturbations as a previously unknown consequence of targeting MNK1/2, which may be therapeutically exploited.


Figures
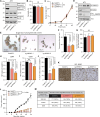
Fig. 1.
Fig. 1.. MNK1 ablation dampens 4T1 stemness properties.
(A) Western blotting of the indicated proteins in 4T1 cells. Circled proteins are significantly differentially expressed between cell lines (see fig. S9 for quantification). (B) Percentage of live cells of indicated cell lines. Error bars represent SD, one-way analysis of variance (ANOVA) with Tukey’s multiple comparison test, n = 4. NS, not significant. (C) Proliferation of indicated cell lines over 96 hours following serum starvation. Error bars represent SD, two-way ANOVA with Tukey’s multiple comparison test, n = 3. (D) Western blotting of the indicated proteins in 4T1 cells. Circled proteins are significantly differentially expressed between cell lines (see fig. S9 for quantification). (E) Representative bright-field images of the indicated cell lines grown under low-adherence tumorsphere culture. 3D, three-dimensional. (F and G) Average tumorsphere size (F) and tumorsphere number (G) grown from 5000 of the indicated cells. Quantification performed on tumorspheres 7 days after seeding. Error bars represent SD, one-way ANOVA with Tukey’s multiple comparison test, n = 3 (25 spheres analyzed per cell line per repeat). (H and I) Average surface expression of CD44 (H) and CD24 (I) in the indicated cell lines. Error bars represent SD, one-way ANOVA with Tukey’s multiple comparison, n = 3. MFI, mean fluorescence intensity. (J) Quantification of ALDH activity in the indicated cell lines. Data represent the percentage of ALDH+ cells relative to Cas9CTL; error bars represent SD, one-way ANOVA with Tukey’s multiple comparison test, n = 3. (K) Representative images of IHC staining against MNK1 [3,3′-diaminobenzidine (DAB)] in indicated tumors. (L) Growth rates of tumors formed from the indicated cell lines following mammary fat pad injection. Error bars represent SEM, two-way ANOVA with Tukey’s multiple comparison test, n = 7 (Cas9CTL) and 5 (sg-MKNK1-1 and sg-MKNK1-2). (M) Number and percentage of mice engrafted following mammary fat pad injection of serially diluted Cas9CTL, sg-MKNK1-1, and sg-MKNK1-2 cell lines.
Fig. 2.
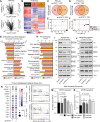
Fig. 2.. RNA-seq and proteomic profiling of Cas9CTL and sg-MKNK1 4T1 cell lines.
(A) Volcano plots summarizing differential gene expression as detected by RNA-seq. For RNA-seq data: n = 3 (Cas9CTL and sg-MKNK1-2) and 4 (sgMKNK1-1). (B) Heatmap expressing relative abundance values for all proteins identified by MS. For proteomics data, n = 4 per group. (C and D) Venn diagrams depicting the number of differentially expressed genes (DEGs) (C) and differentially expressed proteins (DEPs) (D) between cell lines. (E and F) PCA of RNA-seq (E) and proteomics (F) datasets. (G) GSEA of RNA-seq data through the Kyoto Encyclopedia of Genes and Genomes (KEGG) database. Signatures shown represent the top 5 up- and down-regulated pathways relative to Cas9CTL cells, according to normalized enrichment scores. Only signatures with significant differential regulation (adjusted P < 0.1) in both sg-MKNK1 cell lines are shown. Bar color denotes cell line. PPAR, peroxisome proliferator–activated receptor. (H) Ingenuity Pathway Analysis (IPA) of proteomics data in the indicated cell lines relative to Cas9CTL cells. Pathways shown represent the top 10 differentially expressed, irrespective of direction of regulation, according to enrichment z-score values. (I and J) Western blotting of the indicated proteins in 4T1 cells. Circled proteins are significantly differentially expressed between cell lines (see fig. S9 for quantification). (K and L) Expression of a proliver metastasis gene signature across RNA-seq and proteomics datasets. Proteomics data are shown as a bubble plot (K); color corresponds with expression relative to Cas9CTL, and bubble size corresponds to P value. RNA-seq data are shown as GSEA plots (L); normalized enrichment score (NES) and false discovery rate (FDR) values are listed. (M and N) Expression of MKNK1 (M) and MKNK2 (N) in parental, tumor-explant, liver-, lung-, and bone-tropic 4T1 cells. Values acquired from publicly available RNA microarray data. Error bars represent SD, multiple unpaired t tests with Welch’s correction and Holm-Sidak multiple comparison test, n = 3. ACO2, aconitase 2; ADLO, aldolase A; CS, citrate synthase; ENO1, enolase 1; EMT, epithelial-to-mesenchymal transition; FH, fumarate hydratase; GAPDH, glyceraldehyde-3-phosphate dehydrogenase; HGF, hepatocyte growth factor; HK2, hexokinase 2; IDH2, isocitrate dehydrogenase 2; LDHA, lactate dehydrogenase A; MPC2, mitochondrial pyruvate carrier 2; NDUFS1/NDUFA10, NADH:ubiquinone oxidoreductase core subunit S1/subunit A10; PDH, pyruvate dehydrogenase; PPAR, peroxisome proliferation-activated receptor; SHDA, succinate dehydrogenase complex flavoprotein subunit A.
Fig. 3.
Fig. 3.. MNK1-null tumor cells have a reduced ability to form liver metastases.
(A) Schematic of the intrasplenic injection model. (B) Number of metastases visible on the liver 21 days after injection of the indicated cell lines. Error bars represent SEM, n = 14 (Cas9CTL), 10 (sg-MKNK1-1), and 8 (sg-MKNK1-2). (C) Kaplan-Meier curves showing mouse survival following intrasplenic injection of the indicated cells. n = 10 (Cas9CTL), 8 (sg-MKNK1-1), and 7 (sg-MKNK1-2). (D and E) Quantification of tumor burden in H&E-stained liver sections, showing the average number of metastases (D) and percentage tumor area (E). Error bars represent SEM, n = 10 (Cas9CTL), 5 (sg-MKNK1-1), and 8 (sg-MKNK1-2). (F) Schematic of in vivo seeding competition assay. (G) Representative flow cytometry plots and quantification of Cas9CTL and sg-MKNK1 cells in the liver 48 hours after injection. Error bars represent SEM, n = 7 (Cas9CTL:sg-MKNK1-1) and 5 (Cas9CTL:sg-MKNK1-2). (H) Tumor burden in the lung 14 days after tail vein injection of the indicated cells. Error bars represent SEM, n = 10 per group. (I) Western blot analysis of the indicated proteins in Cas9CTL, sg-MKNK1-EV, and sg-MKNK1-AB 4T1 cells. Circled proteins are significantly differentially expressed between cell lines (see fig. S9 for quantification). (J) Number of metastases visible on the liver 21 days after intrasplenic injection of the indicated cell lines. Error bars represent SEM, unpaired t test with Welch’s correction, n = 5 (sg-MKNK1-EV and sg-MKNK1-AB), 12 (pLKO), and 11 (shLDHA). (K) Western blotting of the indicated proteins in FC1199 cell lines. Circled proteins are significantly differentially expressed between cell lines (see fig. S9 for quantification). (L) Number of metastases visible on the liver 21 days after intrasplenic injection of the indicated cell lines. Error bars represent SEM, unpaired t test with Welch’s correction, n = 5 (Cas9CTL-1, sg-MKNK1-1, and sg-MKNK1-2) and 4 (Cas9CTL-2). For (B), (D), (E), (G), (H), and (L), one-way ANOVA with Tukey’s multiple comparison test was used.
Fig. 4.
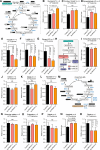
Fig. 4.. U-[13C]-glucose and U-[13C]-glutamine SITA of Cas9CTL and sg-MKNK1 4T1 cells.
(A) Stable isotope tracing diagram for U-[13C]-glucose through glycolysis and into the TCA cycle via PDH and pyruvate carboxylase (PC). (B to G) U-[13C]-glucose tracing into glycolysis (glucose-6-phosphate and fructose-1,6-bisphosphate m + 6, G3P, pyruvate, and lactate m + 3, 4-hour tracer) and glycerol-3-phosphate (m + 3, 4-hour tracer) in the indicated 4T1 cell lines expressed as relative size of the labeled pool. (H) Schematic summary of the glycolytic pathway in relation to the data in (B) to (G). (I) U-[13C]-glucose tracing into extracellular lactate (m + 3, 4-hour tracer) in the indicated 4T1 cell lines expressed as relative size of the labeled pool. (J to L) U-[13C]-glucose tracing into the TCA cycle via PDH (citrate, malate, and aspartate m + 2, 4-hour tracer) in the indicated 4T1 cell lines expressed as relative size of the labeled pool. (M) Stable isotope tracing diagram for U-[13C]-glutamine into the TCA cycle. (N to R) U-[13C]-glutamine tracing to glutamate (glutamine uptake and glutamate m + 5, 4-hour tracer) and into the TCA cycle (citrate, malate, and aspartate m + 4, 4-hour tracer) in the indicated 4T1 cell lines expressed as relative size of the labeled pool. For all panels, experiments were performed in technical triplicates and repeated three times. Graphs shown correspond to one representative experiment; error bars represent SD of technical triplicates. Statistics shown were calculated for technical repeats, one-way ANOVA with Tukey’s multiple comparison test. DHAP, dihydroxyacetone phosphate; GLS1/2, glutaminase 1/2; GLUD1, glutamate dehydrogenase 1; GLUL, glutamate-ammonia ligase; GOT1/2, glutamic-oxaloacetic transaminase 1/2; GPI, glucose-6-phosphate isomerase; GPT1/2, glutamic-pyruvic transaminase 1/2; MDH2, malate dehydrogenase 2; OGDH, oxoglutarate dehydrogenase; PC, pyruvate carboxylase; PFK, phosphofructokinase; PGAM, phosphoglycerate mutase; PGK, phosphoglycerate kinase; PKM, pyruvate kinase; SCS, succinyl CoA synthase.
Fig. 5.
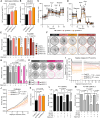
Fig. 5.. Bioenergetic assessment of Cas9CTL and sg-MKNK1 4T1 and FC1199 cells.
(A and B) Average mitochondrial mass (A) and mitochondrial reactive oxygen species levels (B) of the indicated 4T1 cells. Error bars represent SD, one-way ANOVA with Tukey’s multiple comparison test, n = 4. (C and D) Analysis of ECAR (C) and OCR (D) in indicated 4T1 cells, normalized to cell number. Data shown display one representative repeat; error bars represent SD of technical repeats. R/AA, rotenone/antimycin A. (E to H) Effect of oligomycin (1 μM) treatment on cell growth over 48 hours, relative to a solvent control, in the indicated cells. Oligomycin was removed after 8 hours. Error bars represent SD, two-way ANOVA with Tukey’s multiple comparison test, n = 3. Representative images are shown in (F) and (H). (I and J) Relative ATP level (I) and proliferation (J) of the listed 4T1 cell lines over 24 hours of oligomycin (1 μM) treatment under low-glucose conditions (10 mM glucose). Solid lines represent mean value, and shaded areas represent SD. Two-way ANOVA with Tukey’s multiple comparison test, n = 3 per group. (K) Doubling time of the indicated 4T1 cell lines as calculated from data in (J). Error bars represent SD, one-way ANOVA with Tukey’s multiple comparison test, n = 3. (L and M) Effect of combining oligomycin (1 μM), SEL201 (2.5 μM), and EFT508 (1 μM) on Cas9CTL 4T1 (L) and Cas9CTL-2 FC1199 (M) cell growth over 48 hours, relative to a no treatment control. Cells were dosed with MNKi for 72 hours total, starting 24 hours before oligomycin treatment. Oligomycin was removed after 8 hours. Data for oligomycin treatment without MNKi are the same as shown in (E). Error bars represent SD, two-way ANOVA with Tukey’s multiple comparison test, n = 3 per group.
Fig. 6.
Fig. 6.. Analysis of TCGA MS data from patients with BC.
(A to C) Clustered heatmaps visualizing the relative protein expression of MNK1 and glycolysis-related enzymes, as listed in the KEGG glycolysis/gluconeogenesis (A), TCA cycle (B), and OxPhos (C) gene sets. Data are stratified according to MNK1 expression. Each column represents one patient, and each row represents one protein. (D) Correlation of MNK1 protein expression with the protein expression of listed enzymes. Pearson rank-order correlation, solid black lines show linear regression. P and R values are indicated. (E to G) Correlation of MNK1 protein expression with ssGSEA enrichment scores for the glycolysis/gluconeogenesis (E), TCA cycle (F), and OxPhos (G) pathways. Pearson rank-order correlation, solid black lines show linear regression, and shaded areas represent 95% confidence intervals of the linear regression. P and R values are indicated. For (A) to (G), n = 102. (H) Kaplan-Meier curve showing overall survival of patient with high versus low MNK1 protein expression. Log-rank (Mantel-Cox) test, n = 25 per group.

References

    1. Bray F., Ferlay J., Soerjomataram I., Siegel R. L., Torre L. A., Jemal A., Global cancer statistics 2018: GLOBOCAN estimates of incidence and mortality worldwide for 36 cancers in 185 countries. CA Cancer J. Clin. 68, 394–424 (2018). - PubMed
    1. American Cancer Society, Cancer Facts & Figures 2020 (American Cancer Society, 2020).
    1. Zhao H.-Y., Gong Y., Ye F.-G., Ling H., Hu X., Incidence and prognostic factors of patients with synchronous liver metastases upon initial diagnosis of breast cancer: A population-based study. Cancer Manag. Res. 10, 5937–5950 (2018). - PMC - PubMed
    1. Chu J., Cargnello M., Topisirovic I., Pelletier J., Translation initiation factors: Reprogramming protein synthesis in cancer. Trends Cell Biol. 26, 918–933 (2016). - PubMed
    1. Lazaris-Karatzas A., Montine K. S., Sonenberg N., Malignant transformation by a eukaryotic initiation factor subunit that binds to mRNA 5′ cap. Nature 345, 544–547 (1990). - PubMed

Publication types

MeSH terms

Substances