. 2024 Oct 14;42(10):1693-1712.e24.
doi: 10.1016/j.ccell.2024.08.015. Epub 2024 Sep 12.

Distinct tumor architectures and microenvironments for the initiation of breast cancer metastasis in the brain

Affiliations

Distinct tumor architectures and microenvironments for the initiation of breast cancer metastasis in the brain

Siting Gan et al. Cancer Cell. .

Abstract

Brain metastasis, a serious complication of cancer, hinges on the initial survival, microenvironment adaptation, and outgrowth of disseminated cancer cells. To understand the early stages of brain colonization, we investigated two prevalent sources of cerebral relapse, triple-negative (TNBC) and HER2+ (HER2BC) breast cancers. Using mouse models and human tissue samples, we found that these tumor types colonize the brain, with a preference for distinctive tumor architectures, stromal interfaces, and autocrine programs. TNBC models tend to form perivascular sheaths with diffusive contact with astrocytes and microglia. In contrast, HER2BC models tend to form compact spheroids driven by autonomous tenascin C production, segregating stromal cells to the periphery. Single-cell transcriptomics of the tumor microenvironment revealed that these architectures evoke differential Alzheimer's disease-associated microglia (DAM) responses and engagement of the GAS6 receptor AXL. The spatial features of the two modes of brain colonization have relevance for leveraging the stroma to treat brain metastasis.

Keywords: brain metastasis; breast cancer; extracellular matrix; microglia; tumor architecture; tumor microenvironment.


Conflict of interest statement

Declaration of interests N.S.M. has consulted for AstraZeneca. D.P. is on the scientific advisory board of Insitro. J.M. holds company stock of Scholar Rock, Inc.

Figures

Figure 1.
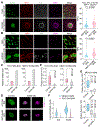
Figure 1.. Perivascular and spheroidal brain colonization patterns and stromal interfaces.
(A) Representative immunofluorescence (IF) staining of vasculature (CD31) and tumor lesions formed by brain metastatic derivatives (BrM) of indicated cell lines. BrM cells were selected by inoculating primary cancer cells into the arterial circulation of mice (human cells into athymic mice, and mouse cells into syngeneic immunocompetent mice) and isolating subpopulations that preferentially metastasize to the brain parenchyma,. Tumor, GFP. Scale bars, 50 μm. (B) Percent of spheroidal colonies in indicated brain metastasis models (n = 5-6 mice/group). Box plot shows the median, first and third quartiles, and whiskers extend to the minimum and maximum. Two-way ANOVA test with Tukey’s multiple comparison test correction. (C) Representative IF staining showing the distribution of astrocytes (GFAP) and microglia and macrophages (IBA1) in indicated models. Tumor, GFP. Scale bars, 50 μm. (D-E) (D) Quantification and (E) and representative IF staining showing variable degrees of brain vasculature engagement in minuscule foci of patient metastatic breast cancer cells. See Table 1 for clinical information and STAR Methods for quantification details. (E) Cancer cells surround (top panel) or form clusters (bottom panel) adjacent to blood vessels (CD31), captured in longitudinal or transverse orientations as indicated. Tumor, cytokeratin. Scale bars, 25 μm. (D) Box plot summarizes the quantification of relative distances of metastatic cancer cells to their closest blood vessels in individual foci of cancer cells. Each data point represents the median relative distance among cells from a focus of cancer cells, with all corresponding values shown in Figure S1E. The tumor foci in (E) are highlighted with matching index numbers in Figure S1E. Box plot shows the median, first and third quartiles, and whiskers extend to the minimum and maximum. Two-way ANOVA and Tukey’s test. (F) Quantification of microglia and macrophage infiltration scores in surgically resected brain metastasis tissue samples derived from TNBC patients (n = 13) and HER2BC patients (n = 18). See Table S1 for scoring of individual samples and Figure S1F for corresponding representative staining. See also Figure S1, Table S1, and Video S1.
Figure 2.
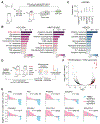
Figure 2.. Delineating TME cellular components by metastatic niche labeling and scRNA-seq analysis.
(A) Schematic of the metastatic niche labeling system. (B) Representative IF staining showing HCC1954-BrM HER2BC cells (GFP+ mCherry+), proximal labeled TME cells (mCherry+), and distal unlabeled cells (mCherry). Scale bar, 50 μm. See Figure S2A for corresponding staining in the MDA231-BrM model. (C) Schematic of the workflow for profiling single-cell transcriptome of the three indicated FACS-sorted groups of cells from dissociated metastases-bearing mouse brains. MDA231-BrM TNBC and HCC1954-BrM HER2BC samples were processed in parallel with cell hashing. See STAR Methods for details. (D-F) Calling the cell types of all non-cancer cells from scRNA-seq experiments 1 and 2. (D) UMAP plot of the identified cell populations from 31657 cells. All macrophages, including BAM, BMDM, and MG, are highlighted by dashed gray lines. (E) Clustering showing the population average (indicated by color) for the marker genes of reference cell type and state clusters (columns) in each annotated cell population, denoted by the same abbreviated terms used in (D) (rows, with each row standardized to between 0 and 1). (F) Heatmap of global expression correlation (indicated by color) between annotated cell populations (rows) and the cell type and state clusters of reference single-cell transcriptome atlas of the mouse nervous system (columns), z-normalized per row. Rows and columns are organized in identical order with clustermap in (E) to assist visual inspection. Cell types (BMDM, NK, NEUT, BAM, BC) absent in the reference atlas are grayed out.(E, F) See STAR Methods and Table S2 for cell type annotation details. (G) Tissue dissociation-associated ex vivo activation scores (violin plot) and percent of the indicated subsets of macrophages (bar plot) among all (labeled and unlabeled) or only labeled macrophages, collected in two independent experiments (1, 2) from whole brain tissues bearing MDA231-BrM or HCC1954-BrM metastases. MG, microglia computationally identified to be in the G1 phase or not cycling. MG (cycling), microglia inferred to be cycling, given high scores of the S and G2/M phases. BAM, BMDM, abbreviated as in (D). All signature genes are listed in Table S2. See also Figures S2 and S3 and Table S2.
Figure 3.
Figure 3.. Tumor-associated microglia activate canonical DAM programs.
All results computed on the non-cycling microglia from experiment 1. See Figure S4 for replication by experiment 2. (A) (Left panel) UMAP embedding of the four indicated sources of altogether 11407 cells, and (right panel) contour plots of each source in the embedding. (B) Differential abundance of TNBC-labeled and HER2BC-labeled cells compared to unlabeled cells in all phenotypic neighborhoods, overlayed on UMAP embedding of the index cells of phenotypic neighborhoods. Color and dot size represent the log fold change (logFC) and Benjamini-Hochberg (BH)-adjusted P values of differential abundance, respectively. UMAP embedding of all cells are shown in the background to facilitate visually locating the index cells. (C) Volcano plot of the logFC in gene expression against corresponding BH-adjusted P values, comparing the groups of phenotypic neighborhoods that are concordantly enriched in versus depleted of breast cancer (BC) cell-labeled non-cycling microglia, which identified 838 differentially expressed genes (DEGs, Table S3). logFC thresholds used for calling DEGs are indicated by dashed lines. (D) Normalized enrichment scores (NES) of the top five positively or negatively enriched gene sets among 838 DEGs. BH-adjusted P values < 0.005. See STAR Methods and Tables S4 for full GSEA results. (E) (Left panel) UMAP plot showing the first diffusion component (DC1) values computed on all cells by color map; and (right panel) heatmap showing fitted trends (rows, z-normalized per row across neighborhoods) for indicated neighborhood-level signature scores and labeled cell enrichment (quantified by the logFC values shown in (B)) along the DC1 values of neighborhood index cells (shown in color, left panel). (C-E) All marker genes and signatures are listed in Table S2. (F) Similar to (E), heatmap showing fitted expression trends of neighborhood-level signatures and their constituent genes (indicated by left parentheses) along the DC1 values of neighborhood index cells (rows, z-normalized per row across neighborhoods). See also Figure S4 and Tables S2–S4.
Figure 4.
Figure 4.. Diverse roles of GAS6-AXL signaling in MDA231 TNBC and HCC1954 HER2BC brain metastases.
(A-B) Quantification and representative IF staining of AXL in IBA1+ microglia/macrophages associated with brain metastatic colonies formed by indicated TNBC and HER2BC cells. (Left panels) (A) Tumor, GFP. (B) Tumor, luciferase. Scale bars, 50 μm. (Right panels) Average intensity of AXL in IBA1+ cells associated with GFP+ or luciferase+ cancer cells in micrometastatic colonies (< 2.5 × 105 μm2 in xenograft models, < 1.0 × 105 μm2 in syngeneic models). RFU, relative fluorescence units. n = 30-70 colonies in 2-3 mice/group. Two-tailed Mann-Whitney U test. See STAR Methods for IF staining and quantification details. (C) Relative mRNA levels of GAS6 in indicated HER2BC cells overexpressing (OE) GAS6 or control vector, measured by qRT-PCR. Mean ± SEM of technical replicates of the assay, representative of two independent experiments. (D) Representative IF staining of GAS6 in brain metastatic colonies formed by indicated HER2BC cells overexpressing (OE) GAS6 or control vector. Tumor, luciferase. Scale bar, 50 μm. (E) Effect of GAS6 OE in HCC1954-BrM cells (n = 9 mice/group, 26 days post-intracardiac inoculation) and MMTV-ErbB2-BrM cells (n = 12-13 mice/group, 16 days post-intracardiac inoculation) on brain colonization measured by ex vivo bioluminescence imaging (BLI) of the brain. Box plot shows the median, first and third quartiles, and the whiskers extend to the minimum and maximum. Two-tailed Mann-Whitney U test. (F) AXL and GAS6 expression levels in indicated human cancer cells in vivo. Log-transformed, normalized UMI counts in single cells, computed on the cancer cells from both scRNA-seq experiments. Log fold change (logFC) comparing MDA231-BrM cells to HCC1954-BrM cells: AXL, logFC = 1.264, GAS6, logFC = 2.336. BH-adjusted P values < 0.01 for both genes. (G) Effect of AXL and GAS6 shRNA knockdown in MDA231-BrM cells (two shRNAs per target gene) on brain colonization measured by ex vivo BLI of the brain (n = 6-7 mice/group, 26 days post-intracardiac inoculation). Box plot shows the median, first and third quartiles, and whiskers extend to the minimum and maximum. Two-tailed Mann-Whitney U test. See also Figures S5–S7.
Figure 5.
Figure 5.. Heightened gene expression of ECM components in HER2BC brain metastases.
(A) Schematic of the workflow of isolating, culturing, and comparing the transcriptome of BrM derivatives to parental breast cancer cell lines. (B) GSEA comparing indicated BrM derivatives to corresponding parental cell lines. Color shades indicate BH-adjusted P values of normalized enrichment scores. (C) Forest plots showing the hazard ratio of the expression of matrisome genes for relapse-free survival of HER2BC breast cancer patients. P values from left (S100A7A) to right (COL4A1) are as follows: 0.0889, 0.1649, 0.0641, 0.0894, 0.0135, 0.0012. (D) Schematic of the MetMap workflow using barcoded cancer cell line pools for high-throughput metastatic potential profiling (adapted from Ref.). Relative metastatic potential was quantified by deep sequencing of barcode abundance from tissue. Comparing the transcriptome of in vivo brain metastases to in vitro cell culture per multiplexed cell line pool yielded the log2 fold change (log2FC) of gene expression shown in (E). (E) Relative in vivo expression, visualized by the log2FC values shown in a descending order, of the top ECM component genes differentially upregulated in brain metastasis samples composed predominantly of HER2BC cells (pink) than of TNBC cells (blue). Wilcoxon rank sum test (see STAR Methods for details). (F) GSEA showing the enrichment of ECM-related pathways in multiplexed brain metastasis samples composed predominantly of HER2BC cells (denoted in pink in (E)) than of TNBC cells (blue in (E)). Top four positively enriched gene sets: Gene Ontology (GO) terms of 1, collagen containing ECM (GO:0062023), 2, ECM (GO:0031012), 3, extracellular structure organization (GO:0043062), and 4, ECM structural constituent (GO:0005201). See also Figure S8 and Table S5.
Figure 6.
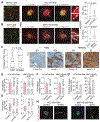
Figure 6.. Impact of peritumoral TNC deposition on spheroidal HER2BC brain colonization.
(A-B) Quantification and representative IF staining comparing peritumoral TNC deposition in indicated HER2BC or TNBC brain metastases (colonies of human cancer cells and mouse cancer cells formed in athymic mice and corresponding syngeneic mice, respectively). (A) Tumor, GFP. (B) Tumor, luciferase. Scale bars, 50 μm. (Right panels) Tumor-associated TNC signal per colony (see STAR Methods for quantification). RFU, relative fluorescence units. n = 10-40 colonies in 2-3 mice/group. Two-tailed Mann-Whitney U test. (C) Scoring and representative IHC staining of TNC levels in surgically resected brain metastasis tissue samples derived from TNBC patients (n = 13) and HER2BC patients (n = 18). Corresponding H&E staining shown in Figure S1F. T, tumor regions (encircled by white dotted lines) were annotated by a pathologist (T.A.B.). Scale bars, 200 μm. Two-tailed Mann-Whitney U test. (D) Effect of suppressing TNC expression on oncosphere formation by shRNA in HCC1954-BrM cells and by CRISPRi in MMTV-ErbB2-BrM, measured by the size of colonies after five days of growth in vitro. Two shRNAs or two sgRNAs. n = 100-175 colonies/group. Mean ± SEM. Unpaired t test. (E) Effect of the suppression of TNC expression on brain colonization by shRNA in HCC1954-BrM cells (n = 5 mice/group, 22 days after intracardiac inoculation into athymic mice, two shRNAs) and by CRISPRi in MMTV-ErbB2-BrM cells (n = 5-9 mice/group, 21 days post-intracardiac inoculation into athymic mice, two sgRNAs), both measured by the normalized ex vivo BLI signal of the brain. Box plot shows the median, first and third quartiles, and whiskers extend to the minimum and maximum. Unpaired t test. (F-H) (F, G) Quantification and (H) representative IF staining of brain metastatic colonies formed by indicated HER2BC cells expressing either a control vector or the shRNA or sgRNA that depletes TNC expression with highest efficiency. The number of colonies was normalized to the mean of the control. (F) The number of colonies and (G) percent of vascular-cooptive cells were determined 21 and 7 days post-intracardiac inoculation into athymic mice, respectively. n = 3-4 mice/group, including all colonies from 1/10 of the brain. Mean ± SEM. Unpaired t test. (H) Tumor, GFP. Scale bars, 25 μm. See also Figure S8 and Table S1.
Figure 7
Figure 7. Cancer cell-derived TNC induces stage 2 DAM in HER2BC brain metastases.
(A-B) (B) Quantification and (A) representative IF staining of AXL in IBA1+ microglia/macrophages associated with brain metastatic colonies formed by HCC1954-BrM cells (21 days post-intracardiac inoculation into athymic mice) and MMTV-ErbB2-BrM cells (14 days post-intracardiac inoculation into FVB/N mice), expressing either a control vector or the shRNA or sgRNA that depletes TNC expression with highest efficiency. Two-tailed Mann-Whitney U test. (A) Tumor, GFP. Scale bars, 50 μm. (B) n = 40-70 colonies in 2-3 mice/group. (C) Relative mRNA levels, measured by qRT-PCR, of the indicated homeostasis and DAM marker genes in primary mouse microglia treated (left panel) with recombinant TNC protein (2 μg/mL) and/or TLR4 inhibitor (TLR4i, 5 μM) for 18 hours or (right panel) with recombinant IFN-β (20 ng/mL) for 6 hours. For each in vitro treatment, the experimental group (right panel) or groups (left panel) were compared to the untreated control group normalized to 1. Mean ± SEM of technical replicates of the assay, representative of two independent experiments. (D) Relative mRNA levels of specified genes and IFN-β concentrations in culture supernatants, measured by qRT-PCR and ELISA respectively, in primary mouse microglia treated with recombinant TNC protein (2 μg/mL) at various time points. For Ifnb1, as the transcript level of the untreated group was below the detection limit of qRT-PCR, the 3, 6, 12, and 18-hour time points were compared to the 24-hour time point set to 1, with the untreated group assigned a value of 0. For all other genes, each time point was compared to the untreated group normalized to 1. Mean ± SEM of technical replicates of the assay, representative of two independent experiments. Error bars are not visible due to their small size. Original data available at Mendeley. (E) A type I IFN-responsive cluster identified in non-cycling microglia from scRNA-seq experiment 1. See Figure S9A for replication in experiment 2. (Top panel) Heatmap of cluster-averaged Axl expression (log-transformed, normalized UMI counts) and homeostasis, DAM, and type I IFN response signature scores (all signature genes listed in Table S2). Phonograph clusters were organized along increasing DAM scores (columns). Expression of each feature was standardized across clusters to between 0 and 1 (rows). (Bottom panel) Volcano plot of the logFC in gene expression against corresponding BH-adjusted P values, comparing the IFN-responsive Phenograph cluster 7 to the rest (see Table S6 for results). Gray dashed lines indicate the absolute logFC threshold values set to 0.322. (F) Schematic illustrates distinctive modes of colonization and stromal interface, various cancer cell-intrinsic mediators of colonization, and the induction of distinct DAM responses during the initiation of brain colonization in TNBC and HER2BC. See also Figure S9 and Tables S2 and S6.

References

    1. Achrol AS, Rennert RC, Anders C, Soffietti R, Ahluwalia MS, Nayak L, Peters S, Arvold ND, Harsh GR, Steeg PS, et al. (2019). Brain metastases. Nat. Rev. Dis. Primer 5, 1–26. 10.1038/s41572-018-0055-y. - DOI - PubMed
    1. Ahluwalia M, Metellus P, and Soffietti R eds. (2020). Central Nervous System Metastases (Springer International Publishing) 10.1007/978-3-030-23417-1. - DOI
    1. Amsbaugh MJ, and Kim CS (2022). Brain Metastasis. In StatPearls (StatPearls Publishing). - PubMed
    1. Hosonaga M, Saya H, and Arima Y (2020). Molecular and cellular mechanisms underlying brain metastasis of breast cancer. Cancer Metastasis Rev. 39, 711–720. 10.1007/s10555-020-09881-y. - DOI - PMC - PubMed
    1. Zimmer AS, Steinberg SM, Smart DD, Gilbert MR, Armstrong TS, Burton E, Houston N, Biassou N, Gril B, Brastianos PK, et al. (2020). Temozolomide in secondary prevention of HER2-positive breast cancer brain metastases. Future Oncol. 16, 899–909. 10.2217/fon-2020-0094. - DOI - PMC - PubMed

MeSH terms