. 2024 Oct 23;112(20):3424-3433.e8.
doi: 10.1016/j.neuron.2024.08.012. Epub 2024 Sep 12.

A neural basis of choking under pressure

Affiliations

A neural basis of choking under pressure

Adam L Smoulder et al. Neuron. .

Abstract

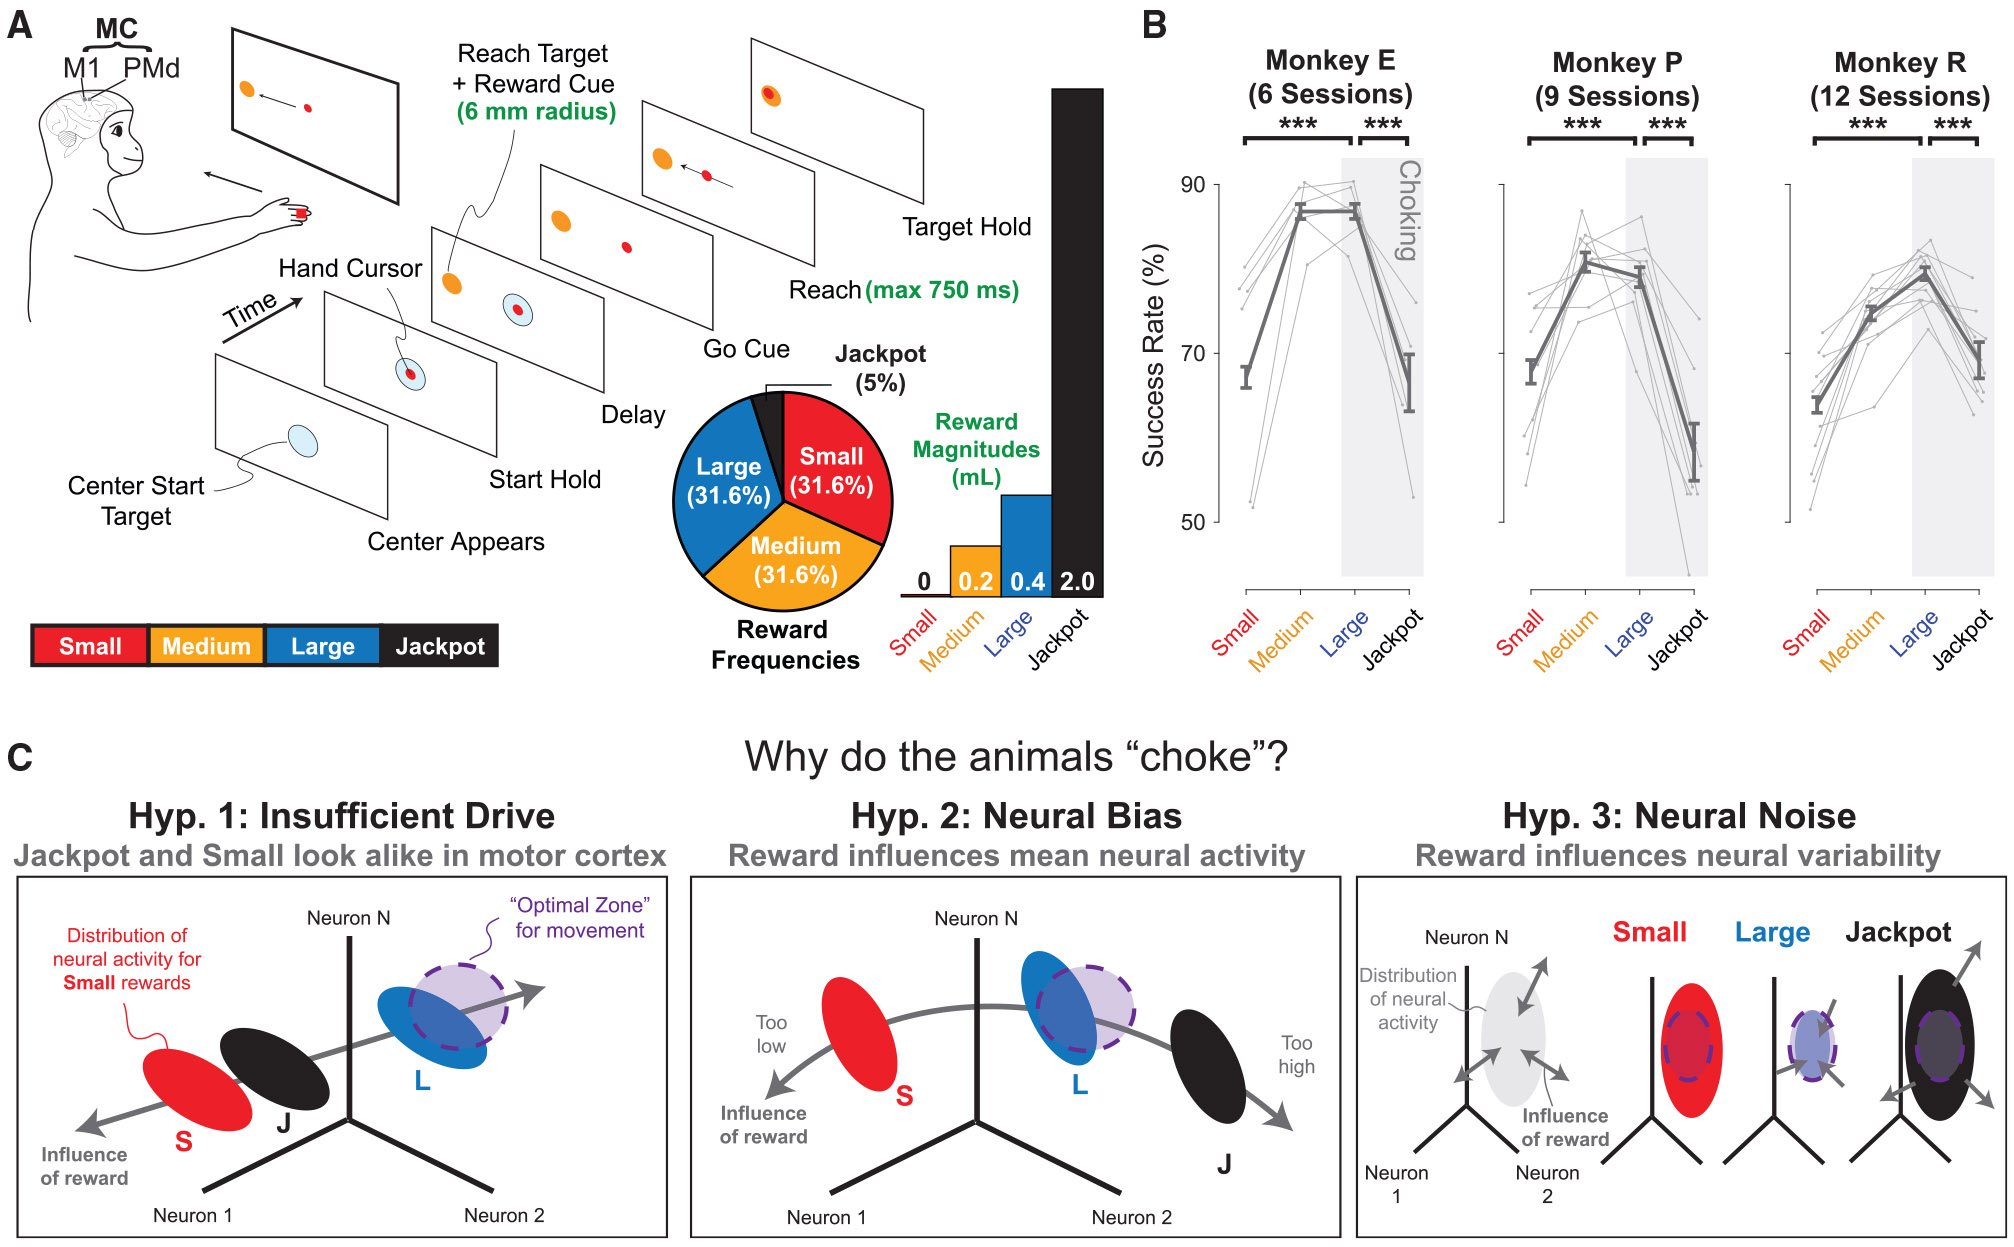
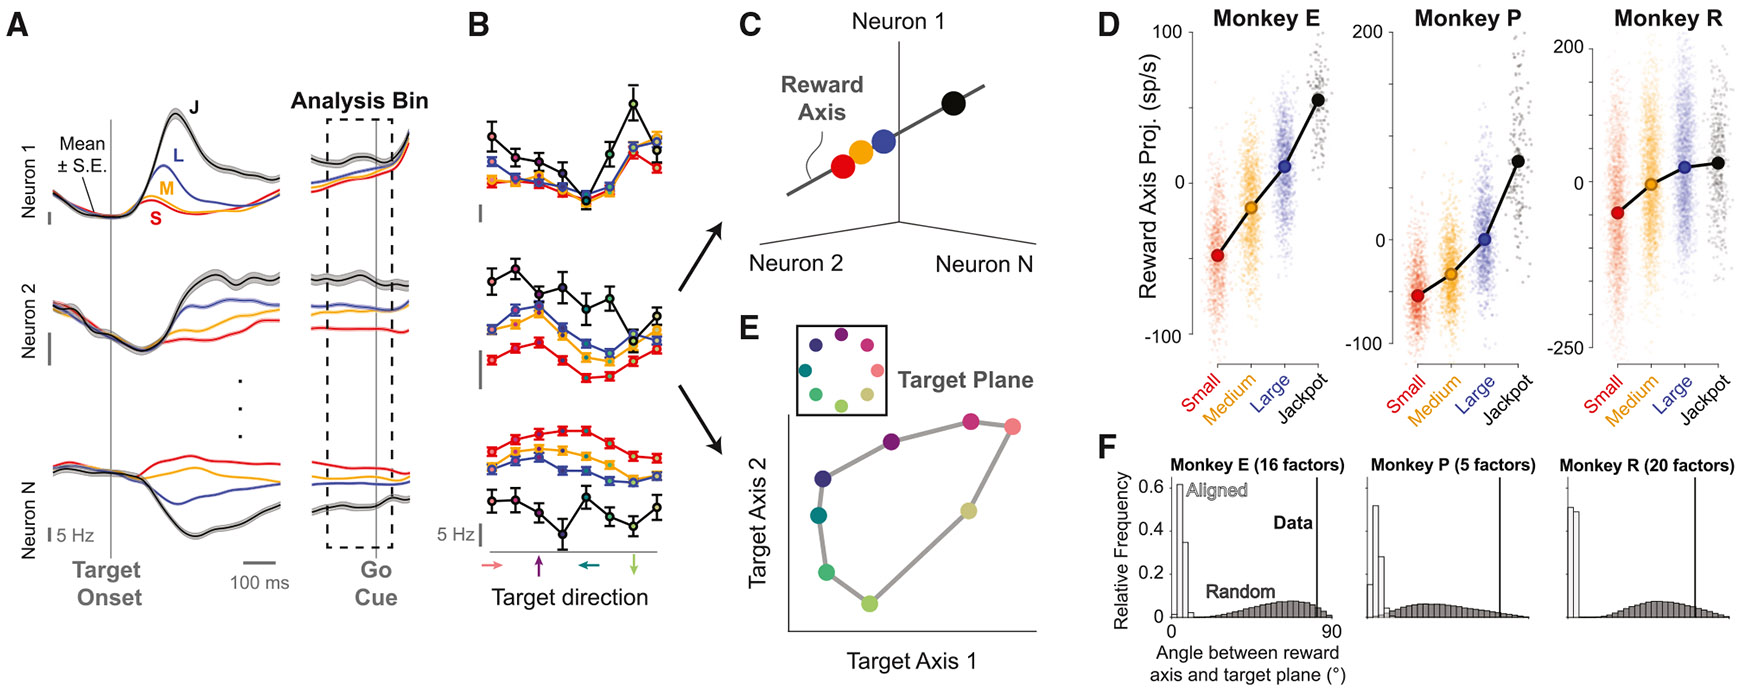
Incentives tend to drive improvements in performance. But when incentives get too high, we can "choke under pressure" and underperform right when it matters most. What neural processes might lead to choking under pressure? We studied rhesus monkeys performing a challenging reaching task in which they underperformed when an unusually large "jackpot" reward was at stake, and we sought a neural mechanism that might result in that underperformance. We found that increases in reward drive neural activity during movement preparation into, and then past, a zone of optimal performance. We conclude that neural signals of reward and motor preparation interact in the motor cortex (MC) in a manner that can explain why we choke under pressure.

Keywords: motivation; motor cortex; movement preparation; paradoxical performance decrement; reaching; reward; reward-mediated performance.


Conflict of interest statement

Declaration of interests The authors declare no competing interests.

Figures

Figure 1.
Figure 1.. Potential neural mechanisms of choking under pressure
(A) Monkeys were trained to prepare a brisk reach to a small target. The color (monkeys E and P) or shape (monkey R) instructed the reward size. Parameters bolded in green were selected individually for each animal to keep the task challenging and motivating (Table S1 shows all parameter values). A separate choice task indicated that animals understood reward cues (Table S2). Simultaneously, we recorded from primary motor (M1) and/or dorsal premotor cortex (PMd), together termed MC, using 96-channel microelectrode “Utah” arrays (Blackrock Microsystems, see Table S1 for array location details). (B) Success rates improved from small to large rewards (binomial proportion test, ***p < 0.001), indicating that performance in this difficult task is influenced by motivation. All animals choked under pressure, indicated by the significant decrease in success rates from large to jackpot. Error bars represent SE of overall success rate shown in dark gray. Light gray traces show individual sessions. Table S3 shows full statistics. (C) We considered three mechanisms that could relate motor cortical activity to the inverted-U in success rates that indicate choking under pressure. In each, large reward neural activity lies best in the optimal preparatory zone for the upcoming movement (purple shaded area). (Left) “Insufficient drive”: jackpot rewards induce paradoxically low reward drive to motor cortex. (Middle) “Neural bias”: increasing offered rewards pushes neural activity toward, but then beyond, the optimal preparatory state for performance. (Right) “Neural noise”: higher reward reduces neural variability to contain more of the distribution in the optimal zone, but the pressure of jackpot rewards causes dysregulation by increasing variability.
Figure 2.
Figure 2.. Reward tuning in motor cortex remains monotonic for jackpot rewards, ruling out the insufficient drive hypothesis
(A) Individual neurons exhibited monotonic tuning to reward size. Firing rates from three example neurons from monkey E are shown, averaged within each reward condition (±SE). Table S4 shows single-unit reward tuning statistics. For further analyses, we calculated the firing rate for each neuron and each trial in an analysis bin at the end of the delay period from 150 ms before to 50 ms after the go cue. (B) MC neurons showed tuning to the target direction, which was largely separable from the reward tuning. (C) Simultaneous neural firing rates can be visualized in a state space in which the firing rate of each neuron corresponds to one dimension (axis) within the space. Three neurons were used here for illustration; in actuality, hundreds of neurons recorded over 6–12 days were used, and neural data were combined across sessions using a neural stitching algorithm (STAR Methods). Using the average neural activity for each reward condition, we can identify a “reward axis” capturing the majority of reward-related variance. (D) Projections along the reward axis are monotonic with cued reward, even though behavior is not. Small dots show single-trial values. Large dots show the mean of the reward condition. Horizontal jitter is for visualization. Because the primary effect of reward is shifting activity along the reward axis monotonically (not an inverted-U), this rules out the insufficient drive hypothesis. (E) Using the average activity for each target direction (dots, color indicates target location), we identify two “target axes” forming a plane that captures the majority of direction-related variance (STAR Methods). For visualization, adjacent reach directions are connected to form a ring. (F) The reward axis is nearly orthogonal to the target plane (STAR Methods, monkey E: 82°, 93rd percentile of random distribution, monkey P: 74°, 95th percentile, monkey R: 71°, 86th percentile).
Figure 3.
Figure 3.. An inverted-U interaction between reward and reach direction preparatory activity supports the neural bias hypothesis
(A) Neural population activity corresponding to motor preparation for different reach directions is pushed apart with increasing cued reward from small through large. However, for jackpots, the activity for different reach directions collapses back toward each other, diminishing their discriminability. We projected neural activity averaged separately for each reward and direction condition into a 3D space reflecting reward (reward axis) and target information (target axis 1 and 2). For visualization, adjacent reach directions (dot color) are connected to form a ring for each reward (line color), and insets (bottom) highlight one target in the target plane. (B) To quantify single-trial separability of preparatory states, we found a “target preparation axis” for each reward and target direction (STAR Methods). (C) When neural activity for individual trials is projected onto these target preparation axes, it exhibits an inverted-U as a function of cued reward that parallels how behavior is influenced by reward. Dots represent single trials, and large filled circles show the mean within each reward condition (Welch’s t test, *p < 0.05, **p < 0.01, ***p < 0.001; n.s., not significant). We tested several methods for quantification and observed similar results (Figure S2). We note that this same effect of expansion-then-collapse in neural encoding with reward can also be observed in single-neuron direction tuning curves (Figure S3). (D) We considered whether a relationship exists between target preparation axis projections (small purple dots) and quality of reach preparation for individual trials. (E) Success rates (green) and failure rates broken down by failure type (light gray: undershoots; dark gray: overshoots). Compared with large rewards, jackpots had more undershoots, whereas small rewards evoked both more undershoots and overshoots (binomial proportion test). (F) Failed trials showed a consistent decrease in the average target preparation axis projection across animals (shape) and rewards (color) compared with successes. When divided by failure mode, undershoots strongly exhibited the decrease, whereas overshoots showed little difference. Thick lines and accompanying stars indicate a significant difference within that reward condition (Welch’s t test). (G) To summarize the relationship between target preparation axis projections and failure modes, we pooled across rewards after Z scoring within each (STAR Methods, mean ± SE). Undershoot trials (left, light gray) show a significant decrease in target preparation axis projections (Welch’s t test), while overshoot failures (right, dark gray) show a much smaller effect. Because reward caused a shift in the average neural activity that corresponds with the inverted-U observed in behavior, our data support the neural bias hypothesis.
Figure 4.
Figure 4.. Trial-to-trial variability does not consistently explain choking under pressure, providing evidence against the neural noise hypothesis
(A) Example of “noise variance,” or trial-to-trial variability about a condition average, in the target plane. Points represent the average neural activity for each reach direction as seen in Figure 3A. Ellipses indicate the within-condition covariance of the single trials. (B) Total noise variance (STAR Methods). Error bars are SE calculated using bootstrapping. (C) Noise variance from the target axes’ projection. This refutes the neural noise hypothesis as a consistent explanation of the animals’ choking, as there are not consistent U-shaped trends of noise variance as a function of reward.

Update of

References

    1. Baumeister RF (1984). Choking under pressure: self-consciousness and paradoxical effects of incentives on skillful performance. J. Pers. Soc. Psychol 46, 610–620. 10.1037//0022-3514.46.3.610. - DOI - PubMed
    1. Beilock SL, and Carr TH (2005). When high-powered people fail: working memory and “choking under pressure” in math. Psychol. Sci 16, 101–105. 10.1111/j.0956-7976.2005.00789.x. - DOI - PubMed
    1. Kimble CE, and Rezabek JS (1992). Playing games before an audience: social facilitation or choking. Soc. Behav. Pers 20, 115–120. 10.2224/sbp.1992.20.2.115. - DOI
    1. Ariely D, Gneezy U, Loewenstein G, and Mazar N (2009). Large stakes and big mistakes. Rev. Econ. Stud 76,451–469. 10.1111/j.1467-937X.2009.00534.x. - DOI
    1. Lewis BP, and Linder DE (1997). Thinking about choking? Attentional processes and paradoxical performance. Pers. Soc. Psychol. Bull 23, 937–944. 10.1177/0146167297239003. - DOI - PubMed

LinkOut - more resources