. 2024 Sep 3;8(5):zrae097.
doi: 10.1093/bjsopen/zrae097.

Heart rate variability as a dynamic marker of surgeons' stress during vascular surgery

Affiliations

Heart rate variability as a dynamic marker of surgeons' stress during vascular surgery

Calvin D De Louche et al. BJS Open. .

Abstract

Background: A surgeon experiences elevated stress levels when operating. Acute stress is linked to cognitive overload, worsening surgical performance. Chronic stress poses a significant risk to a surgeon's health. Identifying intraoperative stress may allow for preventative strategies that reduce surgeons' stress and subsequently improve patient outcomes. The aim of this study was to assess the feasibility of using heart rate variability as a marker of stress during vascular surgery.

Methods: A total of 11 senior surgeons were evaluated performing three different vascular surgery procedures. Heart rate variability metrics (low-frequency to high-frequency ratio and standard deviation of the normal-normal interval) were determined from single-lead ECG traces at predetermined procedural performance points. State-Trait Anxiety Inventory-6, a validated stress tool, was used to assess surgeon-reported stress. Subjective reports of procedural difficulty were also collected. One-way ANOVA compared heart rate variability at key performance points with baseline. Pearson's coefficient assessed correlation between heart rate variability and subjective stress.

Results: Data were collected for six carotid endarterectomies, six open abdominal aortic aneurysm repairs, and five lower limb bypasses. Heart rate variability metrics indicating markedly greater stress were observed at key performance points across all procedures. Peaks in stress were consistent across different surgeons performing the same procedure. A significant correlation was observed between heart rate variability metrics and subjective State-Trait Anxiety Inventory-6 stress reports (r = 0.768, P =<0.001). The most difficult procedural steps reported corresponded with heart rate variability metrics displaying the greatest stress.

Conclusion: Heart rate variability may be a viable approach to assess intraoperative stress and cognitive load during vascular surgery and could be used to evaluate whether a theatre intervention (for example timeout) could reduce stress in areas of surgical difficulty.


Figures

Fig. 1
Fig. 1
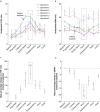
Changes in heart rate variability associated with key performance points during the carotid endarterectomy procedure a Unadjusted changes in the heart rate variability metric in the frequency domain (low-frequency to high-frequency ratio) for each carotid endarterectomy operation and any procedure or non-procedure-related interruptions that occurred. b Unadjusted changes in the heart rate variability metric in the time domain (standard deviation of the normal-normal interval) for each carotid endarterectomy operation and any procedure or non-procedure-related interruptions that occurred. An increase in low-frequency to high-frequency ratio and a decrease in standard deviation of the normal-normal interval indicate greater stress. Individual points represent the mean values at each step; error bars represent s.e.m. The black dotted box surrounds the subjectively reported most difficult step. c Mean percentage change in the frequency (low-frequency to high-frequency ratio) heart rate variability metric relative to baseline across all carotid endarterectomy procedures. d Mean percentage change in the time (standard deviation of the normal-normal interval) heart rate variability metric relative to baseline across all carotid endarterectomy procedures. Points represent the mean percentage change in metric relative to baseline; error bars represent s.e.m. The black dotted box surrounds the subjectively reported most difficult step. One-way ANOVA with Dunnett’s multiple comparisons was performed to compare the mean percentage change in metric at key performance points with baseline (six CEAs). P < 0.05 was considered statistically significant. *P < 0.05. **P < 0.01. ***P < 0.001. ****P < 0.0001. When not indicated, the mean percentage change in metric relative to baseline was deemed non-significant (P ≥ 0.05). LF/HF, low-frequency to high-frequency; SDNN, standard deviation of the normal-normal interval.
Fig. 2
Fig. 2
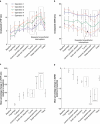
Changes in heart rate variability associated with key performance points during the open abdominal aortic aneurysm repair procedure a Unadjusted changes in the heart rate variability metric in the frequency domain (low-frequency to high-frequency ratio) for each open abdominal aortic aneurysm repair operation. b Unadjusted changes in the heart rate variability metric in the time domain (standard deviation of the normal-normal interval) for each open abdominal aortic aneurysm repair operation. An increase in low-frequency to high-frequency ratio and a decrease in standard deviation of the normal-normal interval indicate greater stress. Individual points represent the mean values at each step; error bars represent s.e.m. The black dotted box surrounds the subjectively reported most difficult step. c Mean percentage change in the frequency (low-frequency to high-frequency ratio) heart rate variability metric relative to baseline across all open abdominal aortic aneurysm repair procedures. d Mean percentage change in the time (standard deviation of the normal-normal interval) heart rate variability metric relative to baseline across all open abdominal aortic aneurysm repair procedures. Points represent the mean percentage change in metric relative to baseline; error bars represent s.e.m. The black dotted box surrounds the subjectively reported most difficult step. One-way ANOVA with Dunnett’s multiple comparisons was performed to compare the mean percentage change in metric at key performance points with baseline (six open abdominal aortic aneurysm repairs). P < 0.05 was considered statistically significant. *P < 0.05. **P < 0.01. ***P < 0.001. ****P < 0.0001. When not indicated, the mean percentage change in metric relative to baseline was deemed non-significant (P ≥ 0.05). LF/HF, low-frequency to high-frequency; SDNN, standard deviation of the normal-normal interval.
Fig. 3
Fig. 3
Changes in heart rate variability associated with key performance points during the lower limb bypass procedure a Unadjusted changes in the heart rate variability metric in the frequency domain (low-frequency to high-frequency ratio) for each lower limb bypass operation and any procedure or non-procedure-related interruptions that occurred. b Unadjusted changes in the heart rate variability metric in the time domain (standard deviation of the normal-normal interval) for each lower limb bypass operation and any procedure or non-procedure-related interruptions that occurred. An increase in low-frequency to high-frequency ratio and a decrease in standard deviation of the normal-normal interval indicate greater stress. Individual points represent the mean values at each step; error bars represent s.e.m. The black dotted box surrounds the subjectively reported most difficult step. c Mean percentage change in the frequency (low-frequency to high-frequency ratio) heart rate variability metric relative to baseline across all lower limb bypass procedures. d Mean percentage change in the time (standard deviation of the normal-normal interval) heart rate variability metric relative to baseline across all lower limb bypass procedures. Points represent the mean percentage change in metric relative to baseline; error bars represent s.e.m. The black dotted box surrounds the subjectively reported most difficult step. One-way ANOVA with Dunnett’s multiple comparisons was performed to compare the mean percentage change in metric at key performance points with baseline (five lower limb bypasses). P < 0.05 was considered statistically significant. *P < 0.05. **P < 0.01. ***P < 0.001. ****P < 0.0001. When not indicated, the mean percentage change in metric relative to baseline was deemed non-significant (P ≥ 0.05). LF/HF, low-frequency to high-frequency; SDNN, standard deviation of the normal-normal interval; prox/dist, proximal and distal.
Fig. 4
Fig. 4
Percentage changes in mean intraoperative heart rate variability metrics relative to baseline depending on procedure classification a Percentage change in mean intraoperative low-frequency to high-frequency ratio relative to baseline across all three procedures depending on procedure classification. A greater percentage increase represents greater stress. Points represent the percentage change in mean intraoperative low-frequency to high-frequency ratio relative to baseline for individual procedures. Bars represent the mean percentage change in mean intraoperative low-frequency to high-frequency ratio relative to baseline; error bars represent s.e.m. b Percentage change in mean intraoperative standard deviation of the normal-normal interval relative to baseline across all three procedures depending on procedure classification. A greater percentage decrease represents greater stress. Points represent the percentage change in mean intraoperative standard deviation of the normal-normal interval relative to baseline for individual procedures. Bars represent the mean percentage change in mean intraoperative standard deviation of the normal-normal interval relative to baseline; error bars represent s.e.m. An unpaired t test was used to compare the percentage change in mean intraoperative heart rate variability metric depending on classification (six non-stressed procedures and 11 stressed procedures). P < 0.05 was considered statistically significant. *P < 0.05. LF/HF, low-frequency to high-frequency; SDNN, standard deviation of the normal-normal interval.
Fig. 5
Fig. 5
Correlation between the percentage change in State-Trait Anxiety Inventory-6 score (after surgery compared with before surgery) and the percentage changes in mean intraoperative heart rate variability metrics a Correlation between the percentage change in State-Trait Anxiety Inventory-6 score (after surgery compared with before surgery) and the percentage change in mean intraoperative low-frequency to high-frequency ratio relative to baseline. A greater percentage increase in State-Trait Anxiety Inventory-6 score and a greater percentage increase in mean low-frequency to high-frequency ratio relative to baseline indicate greater stress. Points represent different procedures. A significant strong positive correlation between the parameters can be observed. b Correlation between the percentage change in State-Trait Anxiety Inventory-6 score (after surgery compared with before surgery) and the percentage change in mean intraoperative standard deviation of the normal-normal interval relative to baseline. A greater percentage increase in State-Trait Anxiety Inventory-6 score and a greater percentage decrease in mean standard deviation of the normal-normal interval relative to baseline indicate greater stress. Points represent different procedures. A significant strong negative correlation between the parameters can be observed. Pearson’s correlation coefficient was determined to assess the correlation between the percentage change in mean intraoperative heart rate variability metrics and the percentage change in State-Trait Anxiety Inventory-6 score (17 procedures). P < 0.05 was considered statistically significant. STAI, State-Trait Anxiety Inventory; LF/HF, low-frequency to high-frequency; SDNN, standard deviation of the normal-normal interval.

Similar articles

Cited by

References

    1. Arora S, Sevdalis N, Nestel D, Woloshynowych M, Darzi A, Kneebone R. The impact of stress on surgical performance: a systematic review of the literature. Surgery 2010;147:318–330.e1–e6 - PubMed
    1. Demirtas Y, Tulmac M, Yavuzer R, Yalcin R, Ayhan S, Latifoglu O et al. Plastic surgeon’s life: marvelous for mind, exhausting for body. Plast Reconstr Surg 2004;114:923–931, discussion 932–933 - PubMed
    1. Memon AG, Naeem Z, Zaman A, Zahid F. Occupational health related concerns among surgeons. Int J Health Sci (Qassim) 2016;10:279–291 - PMC - PubMed
    1. Selye H. The evolution of the stress concept. Am Sci 1973;61:692–699 - PubMed
    1. Yaribeygi H, Panahi Y, Sahraei H, Johnston TP, Sahebkar A. The impact of stress on body function: a review. EXCLI J 2017;16:1057–1072 - PMC - PubMed