. 2024 Oct 28;52(19):e93.
doi: 10.1093/nar/gkae793.

IRescue: uncertainty-aware quantification of transposable elements expression at single cell level

Affiliations

IRescue: uncertainty-aware quantification of transposable elements expression at single cell level

Benedetto Polimeni et al. Nucleic Acids Res. .

Abstract

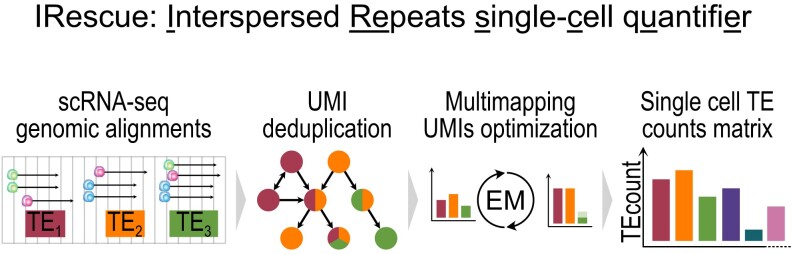
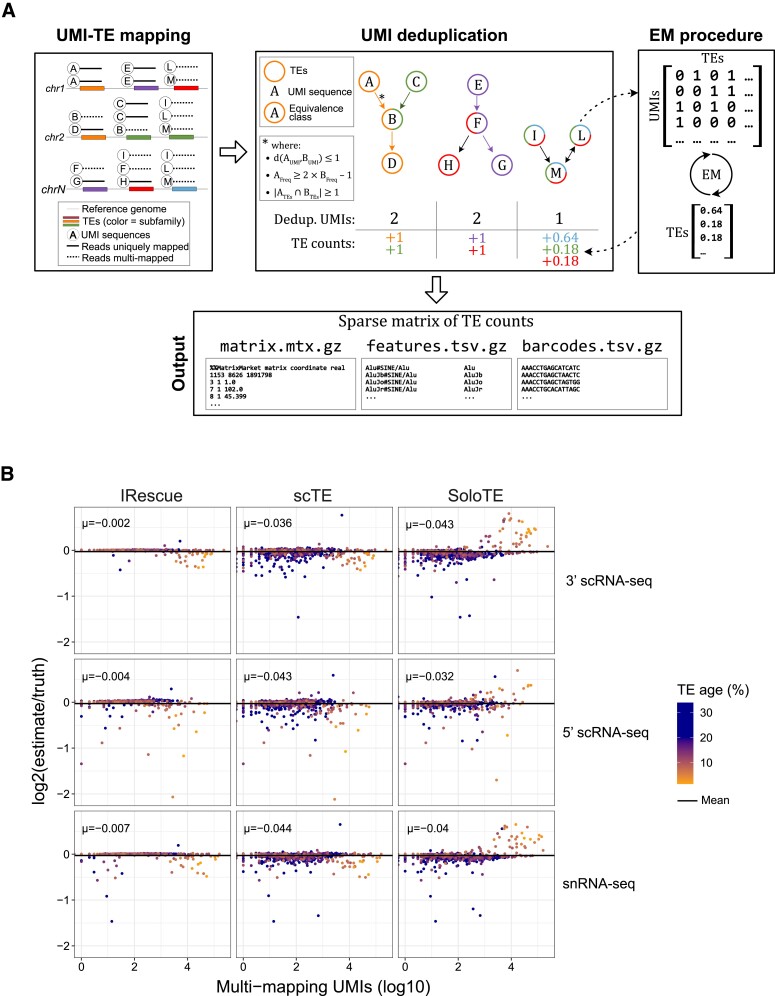
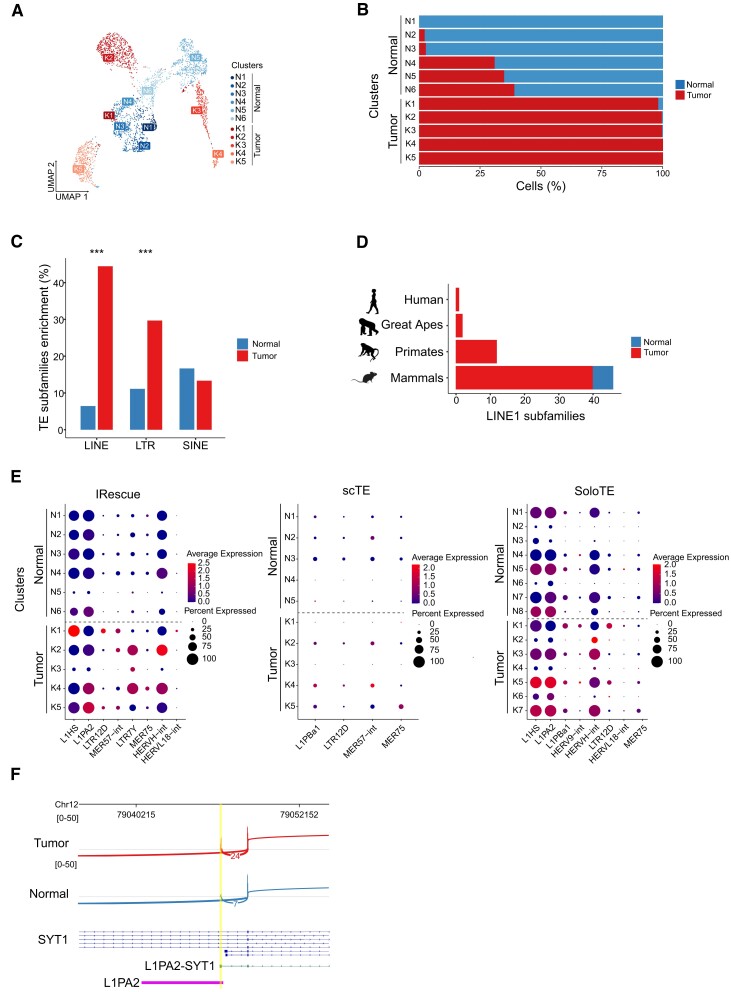
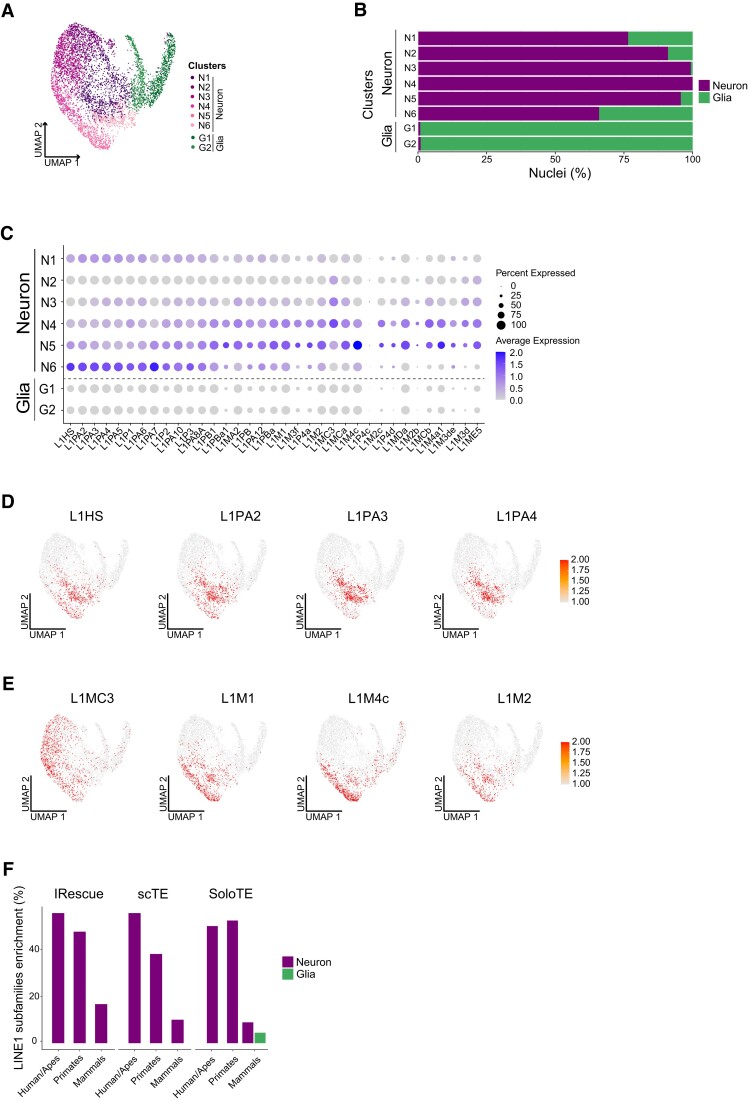
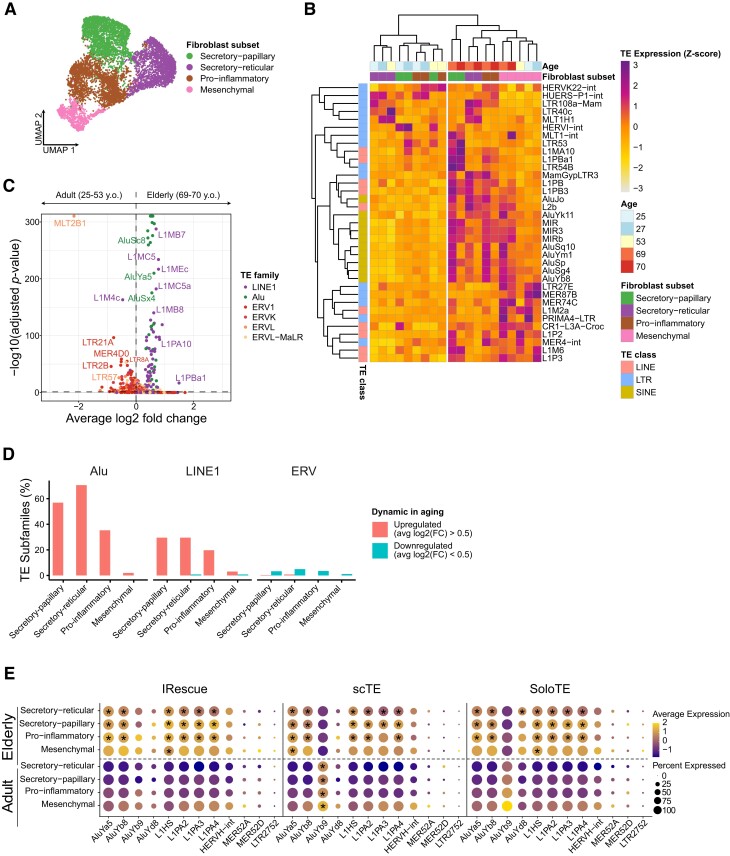
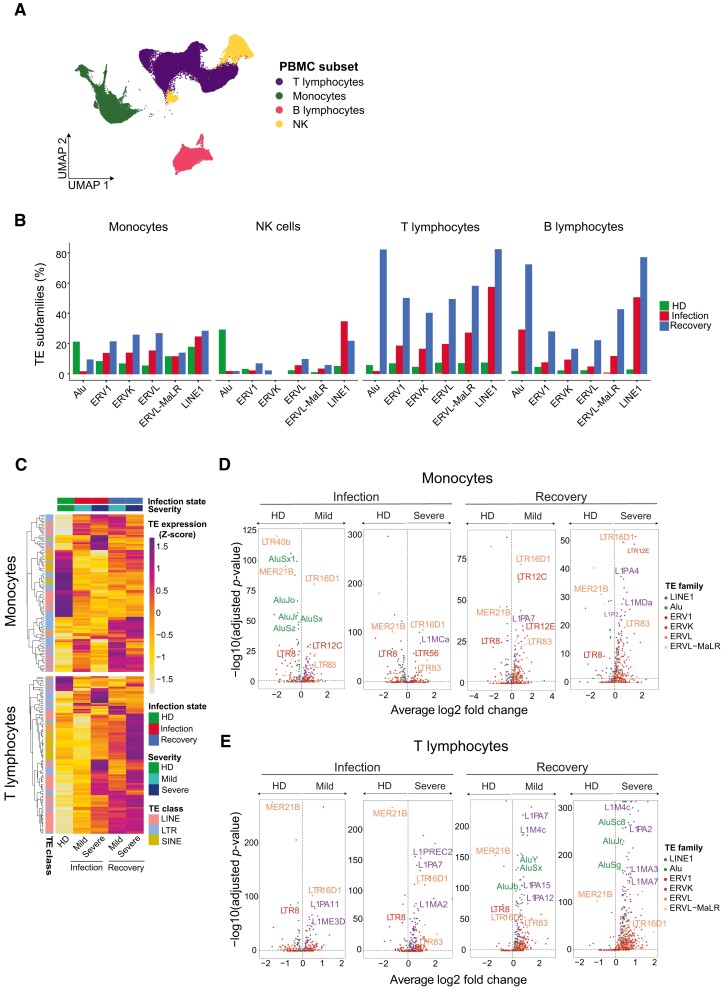
Transposable elements (TEs) are mobile DNA repeats known to shape the evolution of eukaryotic genomes. In complex organisms, they exhibit tissue-specific transcription. However, understanding their role in cellular diversity across most tissues remains a challenge, when employing single-cell RNA sequencing (scRNA-seq), due to their widespread presence and genetic similarity. To address this, we present IRescue (Interspersed Repeats single-cell quantifier), a software capable of estimating the expression of TE subfamilies at the single-cell level. IRescue incorporates a unique UMI deduplication algorithm to rectify sequencing errors and employs an Expectation-Maximization procedure to effectively redistribute the counts of multi-mapping reads. Our study showcases the precision of IRescue through analysis of both simulated and real single cell and nuclei RNA-seq data from human colorectal cancer, brain, skin aging, and PBMCs during SARS-CoV-2 infection and recovery. By linking the expression patterns of TE signatures to specific conditions and biological contexts, we unveil insights into their potential roles in cellular heterogeneity and disease progression.


Figures

Graphical Abstract
Graphical Abstract
Figure 1.
Figure 1.
IRescue's algorithm schematics and benchmarking. (A) Scheme of IRescue's algorithm. (Top-left) IRescue takes as input uniquely mapped and multi-mapped reads aligned on a reference genome with annotated UMI and barcode sequences in BAM format. (Top-middle) equivalence classes (ECs) containing each UMI’s sequence, frequency and mapped TE subfamilies are used to build a directed graph according to the indicated conditions (i.e. minimum hamming distance, frequency difference and TE subfamilies in common). For each subgraph of connected nodes, the minimum number of paths is calculated to obtain the deduplicated UMI count, which is assigned to the corresponding TE subfamily. (Top-right) In case of deduplicated UMIs being associated to more than one TE subfamily, an Expectation-Maximization (EM) procedure redistributes the UMI’s relative abundance to optimize the expression estimate of each subfamily. (Bottom) the UMI counts per TE subfamilies in each cell are written in a Matrix Market exchange format (Cell Ranger-compatible) for downstream analysis. (B) Scatterplots of TE subfamilies (N = 1202) showing the relationship between the number of the associated multi-mapping UMIs and the fold change between estimated and true counts in the indicated dataset and quantification method. Each dot represents a TE subfamily, color-coded by the average insertion age presented as the percentage of divergence between genomic TEs and their respective consensus sequence (as reported in UCSC’s Repeatmasker annotation). Blue dots correspond to older TEs, whereas orange dots represent younger TEs. Black horizontal lines and μ indicate the mean.
Figure 2.
Figure 2.
Identification of TE expression dynamics in colorectal cancer. (A) UMAP representation of CRC and normal cells according to TE expression. Clusters of normal and cancer cells (indicated in legend) are obtained on the basis of TE expression. (B) Relative abundance of cells by condition across clusters. (C) Enrichment of differentially expressed TE subfamilies in normal or cancer condition (adjusted P-value < 0.05) by TE class, calculated as the percentage in respect to the total number of subfamilies per class. *** P-value < 0.001 (two-sided two-proportions Z-test). (D) Number of differentially expressed LINE1 subfamilies in normal or cancer condition (adjusted P-value < 0.05) by evolutionary clade (Human: L1HS; Great apes: L1PA[2–3]; Primates: L1P*; Mammals: L1M*). Animal shapes were obtained from PhyloPic and are copyright-free. (E) Average expression of differentially expressed known TE CRC markers across clusters using the indicated quantification method. The dot size is indicative of the percentage of expressing cells in the cluster (adjusted P-value < 0.05). (F) Sashimi plot representing the coverage across the splice junction of a L1PA2-derived CRC-specific alternative cryptic exon of the SYT1 oncogene.
Figure 3.
Figure 3.
LINE1 are dynamically expressed in the human brain in specific subpopulations of neuronal nuclei. (A) UMAP representation of neuronal and glial nuclei according to TE expression, colored by cluster identity inferred by TE expression and cell type inferred by gene expression. (B) Relative abundance of nuclei by major cell type across TE clusters. (C) Average expression of differentially expressed LINE1 subfamilies across clusters. The dot size is indicative of the percentage of expressing cells in the cluster (adjusted P-value < 0.05, average log2 fold change > 0.5). (D) UMAP representation of nuclei colored by scaled expression of evolutionarily young LINE1 subfamilies. (E) as (D), for evolutionarily old LINE1 subfamilies. (F) Enrichment of LINE1 subfamilies differentially expressed in neurons or glia among the total number of annotated subfamilies, stratified between L1HS/PA (human or apes), L1P (primates) and L1M (mammals), using the indicated quantification method.
Figure 4.
Figure 4.
Human skin fibroblasts and T cells display specific single-cell TE expression patterns in aging. (A) UMAP representation of skin-derived fibroblasts subsets according to gene expression. (B) Average expression of TE subfamilies differentially expressed in each fibroblast subset, further stratified by donor's age (top 10 significant TE subfamilies per cell type, adjusted P-value < 0.05). Expression values are normalized and scaled by Z-score. Dendrograms display the hierarchical clustering of TE subfamilies (rows) and samples (columns) according to TE expression patterns. The color code indicates the TE class (rows), donor's age or fibroblast subset (columns). (C) Volcano plot of TE subfamilies by average log2 fold-change between elderly and adults individuals and adjusted P-value in negative log10 scale, colored by TE family. Horizontal dashed line indicates P-value = 0.05, vertical dashed line indicates log2 fold change = 0. (D) Enrichment of differentially expressed TE subfamilies (adjusted P-value < 0.05) in aging by fibroblasts subsets and TE families, calculated as the percentage in respect to the total number of subfamilies per family. ERV family includes ERV1, ERVK, ERVL and ERVL-MaLR. (E) Average expression of TE subfamilies expected to be upregulated in aging across fibroblasts subsets using different quantification methods. The dot size is indicative of the percentage of expressing cells in the cluster. * indicates that the TE subfamily is significantly upregulated in adult or elderly condition (adjusted P-value < 0.05, average log2 fold change > 0.5).
Figure 5.
Figure 5.
Specific TE expression patterns characterize human immune cells during SARS-CoV-2 infection and recovery. (A) UMAP representation of PBMCs colored by cell type inferred by gene expression. (B) Enrichment of differentially expressed TE subfamilies (adjusted P-value < 0.05, average log2 fold change > 0.25 or < –0.25) in infection or recovery compared to healthy conditions for the indicated cell types, calculated as the percentage in respect to the total number of TE subfamilies per family. (C) Average expression of differentially expressed TE subfamilies between healthy and infected or recovery conditions in the indicated cell type (adjusted P-value < 0.05, average log2 fold change > 0.25 or < –0.25), displaying the 50 most significant TEs per comparison. The color code indicates the TE class, disease's severity or patient's condition. Normalized expression is scaled by Z-score. Dendrograms display the hierarchical clustering of TE subfamilies according to expression patterns across groups. (D) Volcano plots of TE subfamilies by average log2 fold-change between the indicated conditions and adjusted P-value in negative log10 scale in monocytes, colored by TE family. Horizontal dashed line indicates P-value = 0.05, vertical dashed line indicates log2 fold change = 0. (E) As in (D), in T lymphocytes.

Similar articles

Cited by

References

    1. Lander E.S., Linton L.M., Birren B., Nusbaum C., Zody M.C., Baldwin J., Devon K., Dewar K., Doyle M., FitzHugh W.et al. .. Initial sequencing and analysis of the human genome. Nature. 2001; 409:860–921. - PubMed
    1. Bourque G., Burns K.H., Gehring M., Gorbunova V., Seluanov A., Hammell M., Imbeault M., Izsvák Z., Levin H.L., Macfarlan T.S.et al. .. Ten things you should know about transposable elements. Genome Biol. 2018; 19:199. - PMC - PubMed
    1. Bao W., Kojima K.K., Kohany O.. Repbase Update, a database of repetitive elements in eukaryotic genomes. Mob. DNA. 2015; 6:11. - PMC - PubMed
    1. Sotero-Caio C.G., Platt R.N. II, Suh A., Ray D.A. Evolution and Diversity of Transposable Elements in Vertebrate Genomes. Genome Biol. Evol. 2017; 9:161–177. - PMC - PubMed
    1. Lanciano S., Cristofari G.. Measuring and interpreting transposable element expression. Nat. Rev. Genet. 2020; 21:721–736. - PubMed

Substances