. 2024 Sep 14;15(1):8044.
doi: 10.1038/s41467-024-51747-2.

Unbiased screening identifies regulators of cell-cell adhesion and treatment options in pemphigus

Affiliations

Unbiased screening identifies regulators of cell-cell adhesion and treatment options in pemphigus

Henriette Franz et al. Nat Commun. .

Abstract

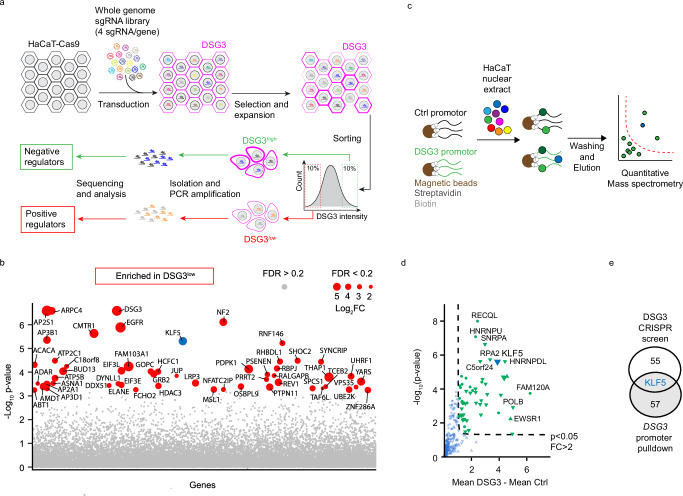
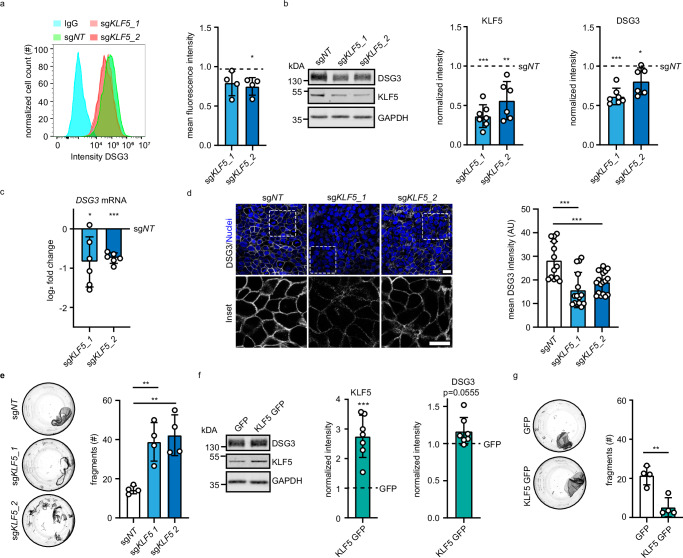
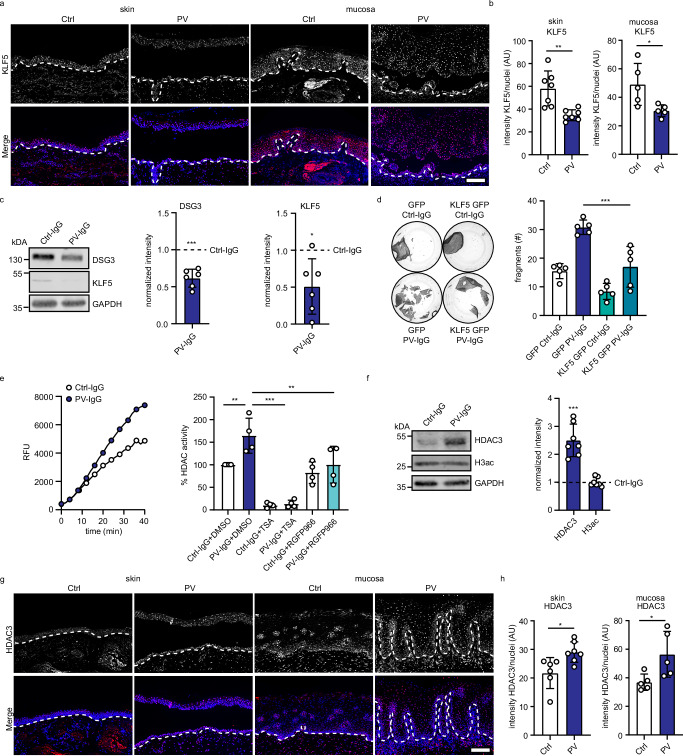
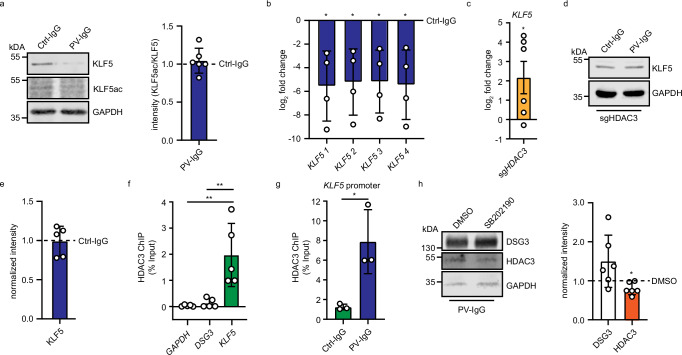
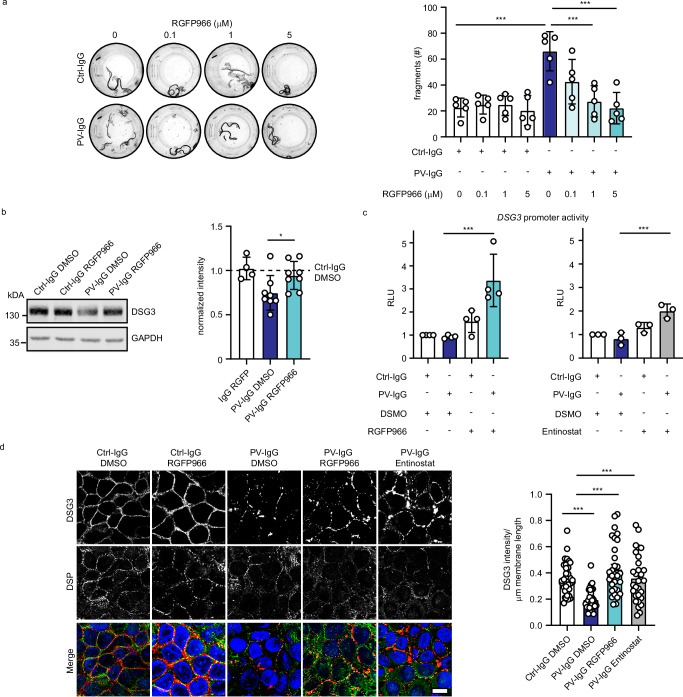
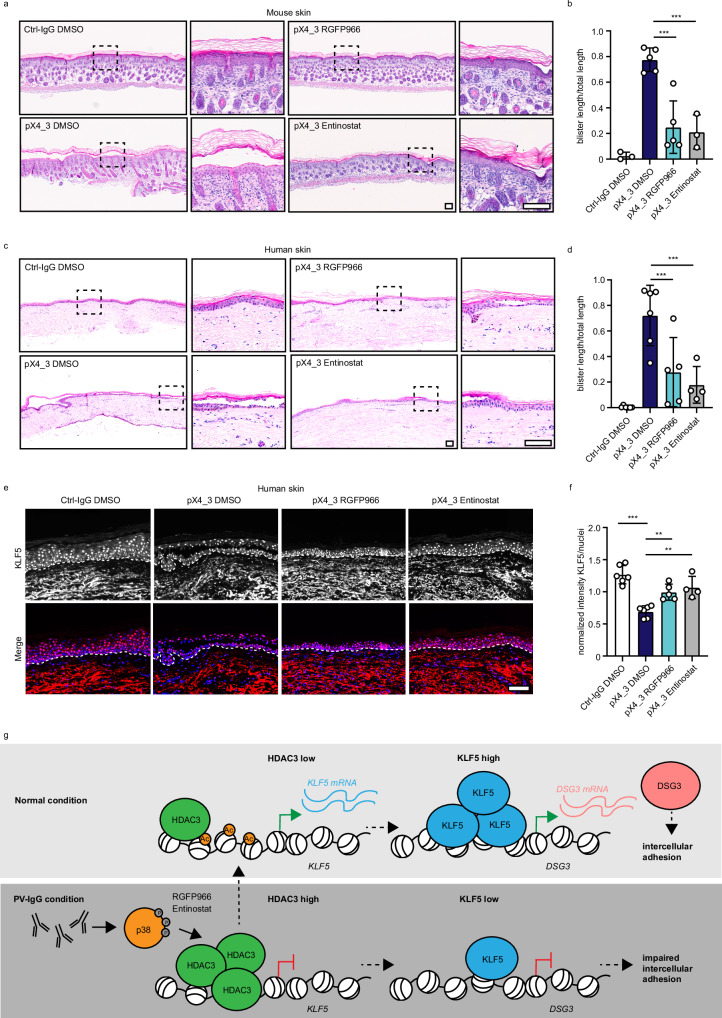
Cell-cell junctions, and specifically desmosomes, are crucial for robust intercellular adhesion. Desmosomal function is compromised in the autoimmune blistering skin disease pemphigus vulgaris. We combine whole-genome knockout screening and a promotor screen of the desmosomal gene desmoglein 3 in human keratinocytes to identify novel regulators of intercellular adhesion. Kruppel-like-factor 5 (KLF5) directly binds to the desmoglein 3 regulatory region and promotes adhesion. Reduced levels of KLF5 in patient tissue indicate a role in pemphigus vulgaris. Autoantibody fractions from patients impair intercellular adhesion and reduce KLF5 levels in in vitro and in vivo disease models. These effects were dependent on increased activity of histone deacetylase 3, leading to transcriptional repression of KLF5. Inhibiting histone deacetylase 3 increases KLF5 levels and protects against the deleterious effects of autoantibodies in murine and human pemphigus vulgaris models. Together, KLF5 and histone deacetylase 3 are regulators of desmoglein 3 gene expression and intercellular adhesion and represent potential therapeutic targets in pemphigus vulgaris.


Conflict of interest statement

The authors declare no competing interests.

Figures

Fig. 1
Fig. 1. Identification of KLF5 as a positive regulator for DSG3.
a Scheme of the CRISPR/Cas9 sgRNA library screen. b Scatterblot showing genes and according to p-values by comparison of the DSG3low versus DSG3high pools. Fold changes are indicated by the dot size. c Scheme of DSG3 promoter screen. d Scatterblot of genes enriched at the DSG3 promoter blotted according to fold change and p-value. e Overlap of positive regulators identified in CRISPR/Cas9 sgRNA library screen and proteins binding to the DSG3 promoter identified by promoter pulldown. Source data are provided as a Source Data file.
Fig. 2
Fig. 2. KLF5 modulates DSG3 protein levels and cell–cell adhesion.
a Flow cytometry analysis of HaCaT cells stained with anti-DSG3 antibodies or IgG as control. HaCaT cells were transduced with sgNT, sgKLF5_1 (p = 0.0698), or sgKLF5_2 (p = 0.0206). A representative histogram and mean fluorescence intensity of four independent experiments are displayed. b Western blot analysis of HaCaT cell lysates using KLF5, DSG3, and GAPDH antibodies. HaCaT cells were stably transduced with sgNT, sgKLF5_1, or sgKLF5_2. Representative Western blot images and quantifications of the respective proteins are shown; sgKLF_1 (p = 0.0005, n = 7), sgKLF5_2 (p = 0.0023, n = 6). Values were normalized to sgNT. c Quantitative Real-time PCR analysis of DSG3 of mRNA extracted from HaCaT cells stably transduced with sgNT, sgKLF5_1, or sgKLF5_2. Values were normalized to sgNT. n = 6, sgKLF5_1 p = 0.0235; sgKLF5_2 p < 0.0001. d Immunofluorescence staining of HaCaT cells stably transduced with sgNT, sgKLF5_1 or sgKLF5_2 using DSG3 antibodies and DAPI as nuclear stain (n = 3, sgKLF5_1 p < 0.0001, sgKLF5_2 p = 0.0009). Representative pictures are shown. Scale bar = 10 μm. e Dispase-based dissociation assay of HaCaT cells stably transduced with sgNT, sgKLF5_1, or sgKLF5_2 (n = 4, sgKLF5_1 p = 0.0046; sgKLF5_2 p = 0.0020). Representative images and the number of fragments are shown. f Western blot analysis of HaCaT cell lysates stably overexpressing KLF5 using KLF5, DSG3, and GAPDH antibodies. Representative Western blot images and quantifications of respective proteins (n = 7, KLF5 p = 0.0006, DSG3 p = 0.0555), are shown. g Dispase-based dissociation assay of HaCaT cells stably overexpressing KLF5 (n = 4, p = 0.0031). Representative images and the number of fragments are shown. Values expressed as mean with standard deviation (mean ± SD). One n represents one biological replicate. Source data are provided as a Source Data file. Experiments (ac, f) were analyzed with one-sample t-test (two-sided), (d, e) were analyzed with One-way-ANOVA, SIDAK correction. g was analyzed with student’s t-test (two-sided). p < 0.05*; p < 0.01**; p < 0.001***.
Fig. 3
Fig. 3. KLF5 is downregulated in pemphigus vulgaris (PV).
a Immunofluorescence staining of human skin or mucosa sections from healthy controls or PV biopsies using KLF5 antibodies and DAPI. Representative images of one individual patient and control are shown. Scale bar = 100 μm. b Quantification of (a) displaying the mean intensity of KLF5 per nucleus (skin n = 7 p = 0.0023, mucosa n = 5 p = 0.0270). c Western blot analysis of HaCaT cells treated with Ctrl-IgG or PV-IgG for 24 h using KLF5, DSG3, and GAPDH antibody. Representative Western blot images and quantifications of respective proteins (n = 6, DSG3 p = 0.0006, KLF5 p = 0.0238) are shown. Values were normalized to Ctrl-IgG. d Dispase-based dissociation assay of HaCaT cells stably transduced with GFP or KLF5-GFP (n = 5, GFP PV-IgG vs KLF5-GFP PV-IgG p < 0.0001). Representative images and the number of fragments are shown. e HDAC activity assay using HaCaT cell lysates. HaCaT cells were treated with Ctrl-IgG or PV-IgG including DMSO, 1 μM trichostatin A (TSA), or 5 μM RGFP966 for 24 h. The left panel shows the increase in deacetylated peptide detected by its fluorophore (expressed by RFU relative fluorescence units) over time of a representative experiment and the right panel shows the calculated HDAC3 activity (n = 4, Ctrl-IgG+DMSO vs PV-IgG DMSO p = 0.0061, PV-IgG DMSO vs PV-IgG TSA p < 0.0001, PV-IgG DMSO vs PV-IgG RGFP966 p = 0.0063). f Western blot analysis of HaCaT cell lysates using HDAC3, H3ac, and GAPDH antibodies. HaCaT cells were treated with Ctrl-IgG or PV-IgG for 24 h. Representative Western blot images and quantifications of respective proteins (n = 7, HDAC3 p = 0.0005, H3ac p = 0.7207) are shown. Values were normalized to Ctrl-IgG. g Immunofluorescence staining of human skin or mucosa sections from healthy controls or PV biopsies using HDAC3 antibodies and DAPI. Representative images of individual patients and controls are shown. Scale bar = 100 μm. h Quantification of (g) displaying the mean intensity of HDAC3 per nucleus (skin n = 7 p = 0.0139, mucosa n = 5 p = 0.0335). Values expressed as mean with standard deviation (mean ± SD). One n represents one biological replicate. Source data are provided as a Source Data file. Experiments (d) and (e) were analyzed with One-way-ANOVA, SIDAK correction. b, h were analyzed with two-sided students t-test, and c, f were analyzed with one-sample t-test. p < 0.05*; p < 0.01**; p < 0.001***.
Fig. 4
Fig. 4. P38MAPK-dependent HDAC3 increase negatively regulates KLF5 expression in PV-IgG-treated keratinocytes.
a Western blot analysis of HaCaT cells which were treated with Ctrl-IgG or PV-IgG for 24 h. Antibodies against KLF5, KLF5ac, and GAPDH were used. Representative Western blot images and quantifications of respective proteins (n = 6) are shown. Values were normalized to Ctrl-IgG. b Quantitative real-time PCR of mRNA extracted from HaCaT cells treated with IgG or PV-IgG. Four different primer pairs detecting KLF5 mRNA were used. Values were normalized to IgG control (n = 4, KLF5_1 p = 0.0334, KLF5_2 p = 0.0340, KLF5_3 p = 0.0301, KLF5_4 p = 0.0344). c Quantitative real-time PCR analysis of mRNA extracted from HaCaT cells stably transduced with sgNT or sgHDAC3. Primers detecting KLF5 mRNA were used. Values were normalized to sgNT (n = 6, KLF5 p = 0.0489) d, e Western Blot analysis of HaCaT cells stably transfected with sgHDAC3 treated with IgG or PV-IgG using DSG3, KLF5 and GAPDH antibodies. Values were normalized to Ctrl-IgG. Representative images are shown (n = 5). f ChIP-quantitative real-time PCR analysis of HaCaT cells using HDAC3 antibodies and primers detecting GAPDH, DSG3, and KLF5 promoters. (n = 5, GAPDH vs KLF5 p = 0.0019, DSG3 vs KLF5 p = 0.0028). g ChIP-quantitative real-time PCR analysis of HaCaT cells treated for 24 h with IgG or PV-IgG using HDAC3 antibodies and primers to detect the KLF5 promoter (n = 3, Ctrl-IgG vs PV-IgG, p = 0.0245). h Western blot analysis of HaCaT cell lysates treated with PV-IgG and DMSO or SB202190 using DSG3, KLF5, HDAC3, and GAPDH antibodies. Values were normalized to DSMO (n = 6, DSG3 p = 0.1276, KLF5 p = 0.039). Representative images are shown. Values expressed as mean with standard deviation (mean ± SD). One n represents one biological replicate. Source data are provided as a Source Data file. ae, h were analyzed with two-sided one-sample t-tests. f was analyzed with with One-way-ANOVA, SIDAK correction. g was analyzed with two-sided Students t-test. p < 0.05*.
Fig. 5
Fig. 5. HDAC3 inhibition prevents the PV-IgG-induced phenotype in vitro.
a Dispase-based dissociation assay of HaCaT cells treated with Ctrl or PV-IgG and indicated concentrations of HDAC3 inhibitor RGFP966. Representative images and quantifications of (n = 5, Ctrl-IgG vs PV-IgG p < 0.0001, PV-IgG vs PV-IgG 1 μM RGFP966 p < 0.0001, PV-IgG vs PV-IgG 5 μM RGFP966 p < 0.0001) are shown. b Western blot analysis of HaCaT cell lysates using DSG3 and GAPDH antibodies. HaCaT cells were treated for 24 h with Ctrl-IgG or PV-IgG and DMSO or RGFP966. Representative Western blot images and quantifications of respective proteins (Ctrl-IgG DMSO n = 8, Ctrl-IgG RGFP966 n = 4 , PV-IgG DMSO n = 8, PV-IgG RGFP966 n = 8, PV-IgG DMSO vs PV-IgG 1 µM RGFP966 p = 0.0340) are shown. Values were normalized to IgG DMSO. c Luciferase assay (luciferase activity expressed in RLU - relative luminescence units) of HaCaT cells treated with Ctrl-IgG or PV-IgG and HDAC3 inhibitors 20 μM RGFP966 (n = 4, PV-IgG DMSO vs PV-IgG RGFP966 p = 0.0002) or 20 μM Entinostat (n = 3, PV-IgG DMSO vs PV-IgG Entinostat p = 0.0004). d Immunofluorescence staining of HaCaT cells treated with Ctrl-IgG or PV-IgG and 5 μM RGFP966 or 10 μM Entinostat using DSG3, DSP antibodies and DAPI. Scale bar = 10 μm. Quantification of DSG3 intensity/membrane length of 3 independent experiments are shown. Each data point represents one cell. PV-IgG DMSO vs Ctrl-IgG DMSO p = 0.0001, PV-IgG DMSO vs PV-IgG RGFP966 p < 0.0001, PV-IgG DMSO vs PV-IgG Entinostat p < 0.0002. Values are expressed as mean with standard deviation (mean + /-SD). One n represents one biological replicate. Source data are provided as a Source Data file. All experiments were statistically analyzed with One-way-ANOVA, SIDAK correction. p < 0.05*; p < 0.01**; p < 0.001***.
Fig. 6
Fig. 6. HDAC3 inhibition ameliorates PV phenotype in vivo.
a Passive transfer neonatal mouse model: H&E staining of mouse skin injected with Ctrl-IgG or pX4_3 and DMSO/ 5 μM RGFP966 or 10 μM Entinostat is displayed. Scale bar = 100 μm. b Quantification of blister length versus total section length is shown (Ctrl-IgG DMSO n = 3, pX4_3 DMSO n = 5, pX4_3 RGFP966 n = 5, pX4_3 Entinostat n = 3, pX4_3 DMSO vs pX4_3 RGFP966 p = 0.0001, pX4_3 DMSO vs pX4_3 Entinostat p = 0.0003). c Ex vivo human skin model: H&E staining of skin explants injected with Ctrl-IgG or pX4_3 and DMSO/ 5 μM RGFP966 or 10 μM Entinostat is displayed. Scale bar = 100 μm. d Quantification of blister length versus total section length is shown (Ctrl-IgG DMSO n = 6, pX4_3 DMSO n = 6, pX4_3 RGFP966 n = 5, pX4_3 Entinostat n = 4, pX4_3 DMSO vs pX4_3 RGFP966 p = 0.0003, pX4_3 DMSO vs pX4_3 Entinostat p < 0.0003). e Immunofluorescence staining of human skin sections with Ctrl-IgG or pX4_3 and DSMO/ 5 μM RGFP966 or 10 μM Entinostat injection using KLF5 antibodies and DAPI. Representative images are shown. Scale bar = 100 μm. f Quantification of (e) displaying the mean of intensity of KLF5 per nucleus normalized to the average signal intensity within each experiment (Ctrl-IgG DMSO n = 6, pX4_3 DMSO n = 6, pX4_3 RGFP966 n = 5, pX4_3 Entinostat n = 4, Ctrl-IgG DMSO vs pX4_3 DMSO p < 0.0001, pX4_3 DMSO vs pX4_3 RGFP966 p = 0.0046, pX4_3 DMSO vs pX4_3 Entinostat p = 0.0012). h Schematic of the results. Values expressed as mean with standard deviation (mean ± SD). One n represents one biological replicate. Source data are provided as a Source Data file. All experiments were statistically analyzed with One-way-ANOVA, SIDAK correction. p < 0.01**; p < 0.001***.

References

    1. Nelson, W. J. The glue that binds us: the hunt for the molecular basis for multicellularity. Cell181, 495–497 (2020). 10.1016/j.cell.2020.03.017 - DOI - PubMed
    1. Green, K. J., Roth-Carter, Q., Niessen, C. M. & Nichols, S. A. Tracing the evolutionary origin of desmosomes. Curr. Biol.30, R535–R543 (2020). 10.1016/j.cub.2020.03.047 - DOI - PMC - PubMed
    1. Waschke, J. The desmosome and pemphigus. Histochem. Cell Biol.130, 21–54 (2008). 10.1007/s00418-008-0420-0 - DOI - PMC - PubMed
    1. Delva, E., Tucker, D. K. & Kowalczyk, A. P. The desmosome. Cold Spring Harb. Perspect. Biol.1, a002543 (2009). 10.1101/cshperspect.a002543 - DOI - PMC - PubMed
    1. Yeruva, S. & Waschke, J. Structure and regulation of desmosomes in intercalated discs: lessons from epithelia. J. Anat.242, 81–90 (2023). 10.1111/joa.13634 - DOI - PMC - PubMed

Publication types

MeSH terms

Associated data