. 2024 Sep 14;15(1):8043.
doi: 10.1038/s41467-024-52443-x.

Conserved transcriptional regulation by BRN1 and BRN2 in neocortical progenitors drives mammalian neural specification and neocortical expansion

Affiliations

Conserved transcriptional regulation by BRN1 and BRN2 in neocortical progenitors drives mammalian neural specification and neocortical expansion

Soraia Barão et al. Nat Commun. .

Abstract

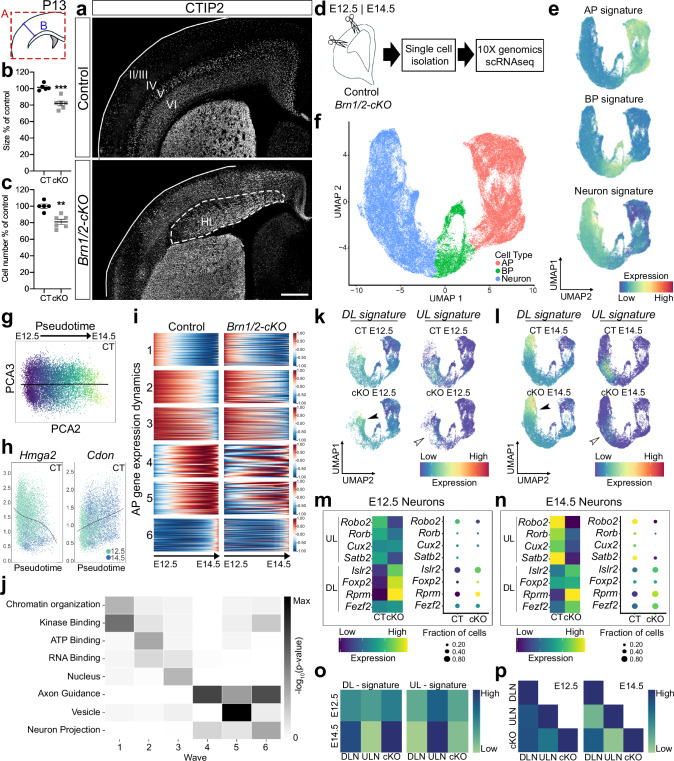
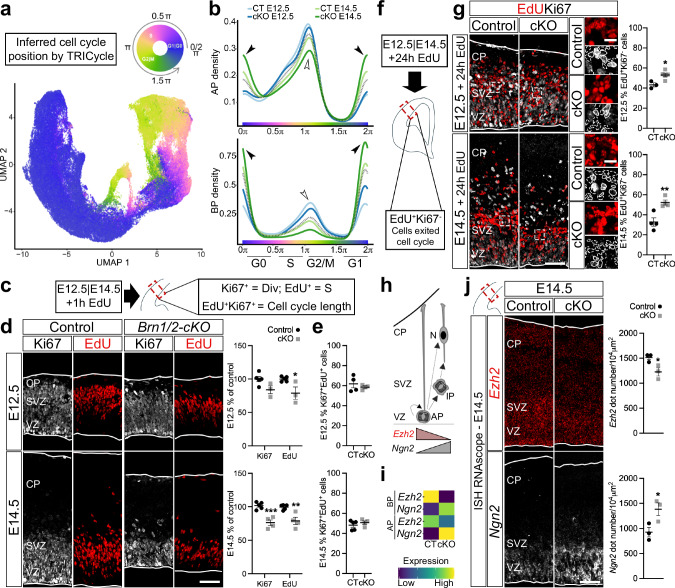
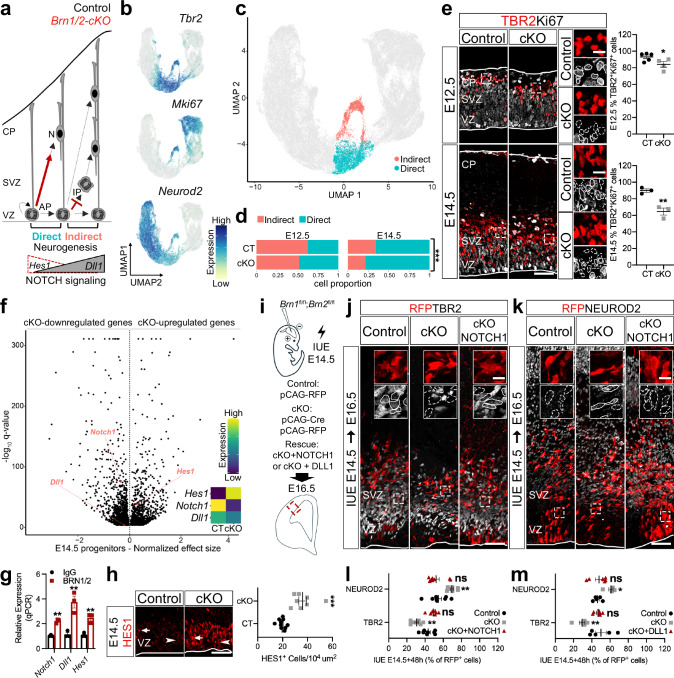
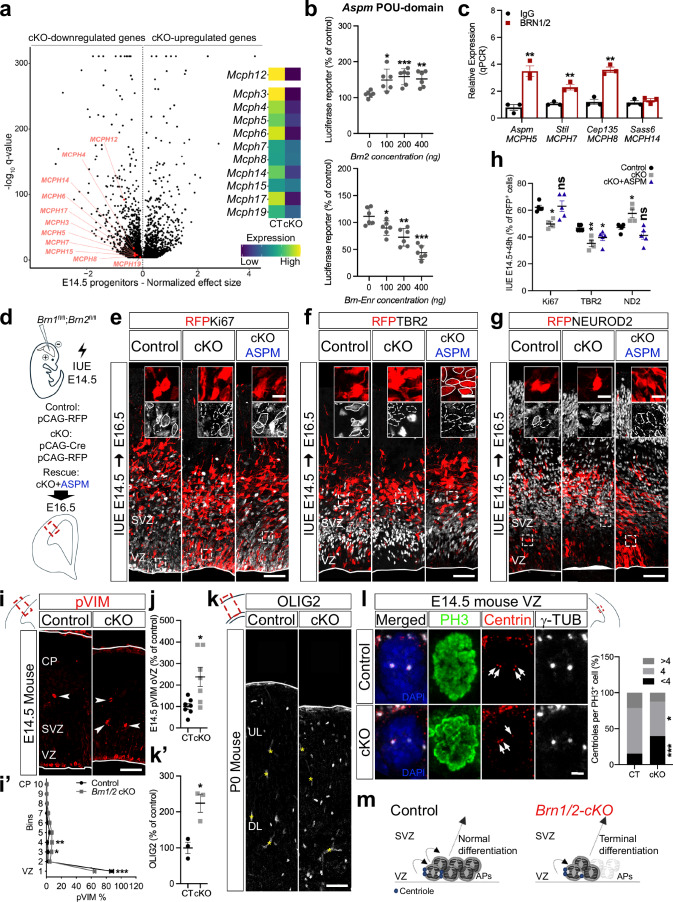
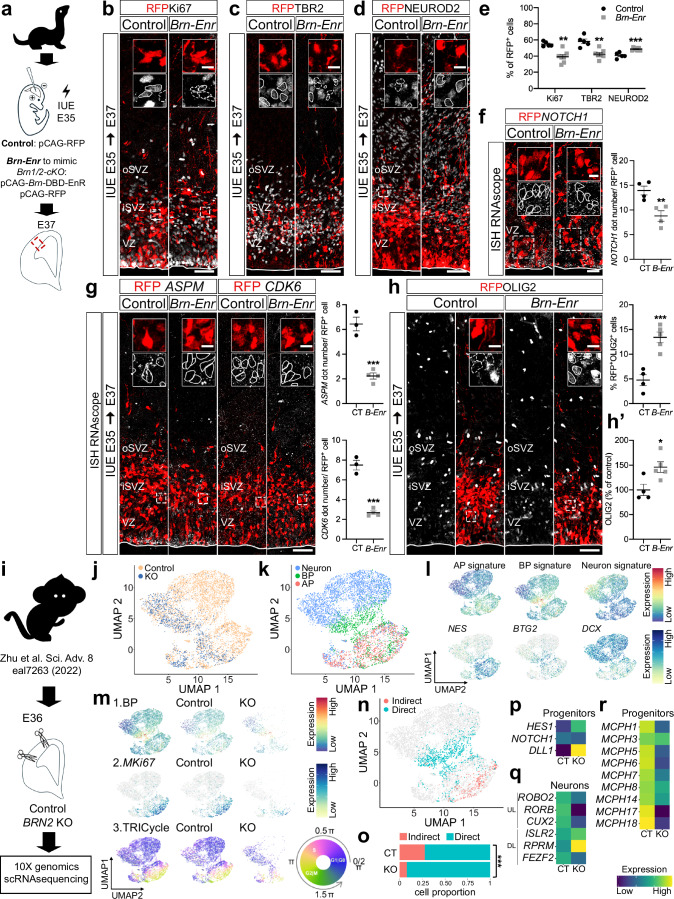
The neocortex varies in size and complexity among mammals due to the tremendous variability in the number and diversity of neuronal subtypes across species. The increased cellular diversity is paralleled by the expansion of the pool of neocortical progenitors and the emergence of indirect neurogenesis during brain evolution. The molecular pathways that control these biological processes and are disrupted in neurological disorders remain largely unknown. Here we show that the transcription factors BRN1 and BRN2 have an evolutionary conserved function in neocortical progenitors to control their proliferative capacity and the switch from direct to indirect neurogenesis. Functional studies in mice and ferrets show that BRN1/2 act in concert with NOTCH and primary microcephaly genes to regulate progenitor behavior. Analysis of transcriptomics data from genetically modified macaques provides evidence that these molecular pathways are conserved in non-human primates. Our findings thus demonstrate that BRN1/2 are central regulators of gene expression programs in neocortical progenitors critical to determine brain size during evolution.


Conflict of interest statement

The authors declare no competing interests.

Figures

Fig. 1
Fig. 1. BRN1/2 regulate the competence of neocortical progenitors to generate ULNs.
a Control (CT) and Brn1/2-cKO (cKO) brains analyzed by CTIP2 immunolabeling at P13. Lines represent the limits of the cortical plate (CP); dashed lines outline cortical heterotopia (Ht). Cortical size (b) and total cell number (c) in control and Brn1/2-cKO cortices at P13 (n = 5 CT, n = 6 cKO mice; two-sided unpaired t-test: (b) p = 0.0004; (c) p = 0.0015). d 10X genomics single-cell RNA sequencing (scRNA-seq) in control and Brn1/2-cKO mice at E12.5 and E14.5. e UMAP of gene signatures for apical progenitors (AP), basal progenitors (BP) and neurons. f UMAPs from control and Brn1/2-cKO cortices at E12.5 and E14.5 by cell type. g Principal component analysis (PCA) of control AP transcriptional identity organization along the pseudotime axis. h Expression of Hmga2 and Cdon in control APs along the pseudotime axis. i Cluster analysis of the gene expression dynamics for the APs along the pseudotime axis in control and Brn1/2-cKO mice (1–6 represent the different transcriptomic waves along the pseudotime axis previously described by Telley et al.; Supplementary Data 1). j Some of the most relevant gene ontology (GO) terms defining the transcriptomic waves along the pseudotime presented in i. UMAP of deep layer (DL) and upper layer (UL) gene signature in the scRNAseq datasets from control and Brn1/2-cKO cortices at E12.5 (k) and E14.5 (l). Empty arrowheads point to reduced expression of UL gene signature in mutants, arrowheads to increased expression of DL gene signature. Expression of the indicated cortical UL and DL marker genes in control and Brn1/2-cKO neurons at E12.5 (m) and E14.5 (n). o Average DL and UL signature score in DL and UL neurons (DLNs and ULNs) and total cKO neurons at E12.5 and E14.5. p Correlation of DL and UL marker gene expression among DLNs, ULNs and total cKO neurons at E12.5 and E14.5. Values are mean ± SEM; **p < 0.01, ***p < 0.001; Scale bars: 500 µm. Source data are provided as a Source Data file.
Fig. 2
Fig. 2. BRN1/2 regulate cell cycle exit.
a UMAPs from control (CT) and Brn1/2-cKO (cKO) cortices at E12.5 and E14.5 by TRIcycle (Transferable Representation and Inference of cell cycle) analysis. b Cell cycle phase analysis from control and Brn1/2-cKO apical progenitors (AP) and basal progenitors (BP) at E12.5 and E14.5 represented as cell density (Wilcoxon rank sum test: AP-E12.5 p = 0.085; AP-E14.5 p = 1.84e−15; BP-E12.5 p = 1.95e-06; BP-E14.5 p < 2.2e−16). Empty arrowheads point to reduced S-G2/M state in mutants, arrowheads to increased G1/G0 state. c, f Schematic of the experimental strategy. E12.5 and E14.5 cortices were analyzed by EdU and Ki67 immunolabeling 1 h (c) or 24 h (f) after intraperitoneal injection of EdU. d EdU (red) and Ki67 (grey) immunolabeling in control and Brn1/2-cKO after 1 h EdU injection at E12.5 and E14.5 (E12.5: n = 5 CT, n = 3 cKO mice; E14.5: n = 5 CT, n = 4 cKO mice; two-sided unpaired t-test: E12.5 Ki67 p = 0.1212, E12.5 EdU p = 0.0253, E14.5 Ki67 p = 0.0008, E14.5 EdU p = 0.0053). e EdU labeling index in control and Brn1/2-cKO after 1 h EdU injection at E12.5 and E14.5 (E12.5: n = 4 CT, n = 3 cKO mice; E14.5: n = 5 CT, n = 4 cKO mice; two-sided unpaired t-test: E12.5 p = 0.5296, E14.5 p = 0.4063). g EdU (red) and Ki67 (grey) immunolabeling in control and Brn1/2-cKO after 24 h EdU injection at E12.5 and E14.5 (E12.5: n = 3 CT, n = 5 cKO mice; E14.5: n = 4 mice/group; two-sided unpaired t-test: E12.5 p = 0.0135, E14.5 p = 0.0071). Boxed area at higher magnification on the right. Lines and dashed lines circulating the cells show expression or absence of Ki67, respectively. h Schematic of progenitors dividing and differentiating into neurons. i ScRNAseq expression of Ezh2 and Ngn2 at E14.5 in control and Brn1/2-cKO APs and BPs. j RNAscope for Ezh2 (red) and Ngn2 (grey) in control and Brn1/2-cKO cortices at E14.5 (n = 3 mice/group; two-sided unpaired t-test: Ezh2-p = 0.0357, Ngn2-p = 0.0436). Low and top lines represent the limits of the ventricular zone (VZ) and cortical plate (CP), respectively. SVZ Subventricular Zone, IP Intermediate Progenitors, N Neurons. Values are mean ± SEM; *p < 0.05, **p < 0.01, ***p < 0.001; Scale bars: 50 µm (lower magnification), 10 µm (higher magnification). Source data are provided as a Source Data file.
Fig. 3
Fig. 3. BRN1/2 regulate the switch from direct to indirect neurogenesis via NOTCH signaling.
a Schematic of progenitor’s neurogenic mode in control (black) and Brn1/2-cKO (red). b UMAP of scRNAseq Tbr2, MKi67 and Neurod2 expression. c UMAP of cells going through indirect and direct neurogenesis in control (CT) and Brn1/2-cKO (cKO) at E12.5 and E14.5. d Proportion of cells going through indirect and direct neurogenesis by age and genotype (Pearson’s Chi-squared test: E12.5-p = 2.212e−11, E14.5-p < 2.2e−16). e TBR2 (red) and Ki67 (grey) immunolabeling in control and Brn1/2-cKO cortical sections at E12.5 and E14.5 (E12.5: n = 5 CT, n = 4 cKO mice; E14.5: n = 3 mice/group; two-sided unpaired t-test: E12.5-p = 0.05, E14.5-p = 0.006). Boxed area at higher magnification on the right. f Volcano plot: differentially expressed genes (DEG) between Brn1/2-cKO progenitors and controls at E14.5 highlighting NOTCH signaling-associated genes (Monocle3 VGAM test; SD = 0.15; q < 0.05; Supplementary Data 3). g ChIP-qPCR analysis of BRN1/2 binding to the indicated promoters/enhancers at E14.5 (n = 3/condition; two-sided unpaired t-test: Notch1-p = 0.0004, Dll1-p = 0.0066, Hes1-p = 0.0042). h HES1 (red) immunolabeling in the ventricular zone (VZ) of control and Brn1/2-cKO cortical sections at E14.5 (n = 10 CT, n = 8 cKO mice; two-sided unpaired t-test: p < 0.0001). i In utero electroporation (IUE) in Brn1fl/fl;Brn2fl/fl mice at E14.5. Cell identities of the control, Brn1/2-cKO and Brn1/2-cKO + NOTCH1 condition immunolabeled for RFP (red), TBR2 (j, grey) and NEUROD2 (k, grey) at E16.5. Boxed area: higher magnification in inserts. RFP+TBR2+ and RFP+NEUROD2+ at E16.5 in the control, Brn1/2-cKO, Brn1/2-cKO + NOTCH1 (l) and Brn1/2-cKO + DLL1 (m) condition (NOTCH1(l): n = 8 CT, n = 8 cKO, n = 7 cKO+NOTCH1; DLL1(m): n = 5 CT, n = 5 cKO, n = 6 cKO+NOTCH1; one-way ANOVA-Dunnett’s multiple comparisons test: NOTCH1-TBR2-p < 0.0001, F2,20 = 20.50; NOTCH1-NEUROD2-p = 0.001, F2,21 = 9.702; DLL1-TBR2-p = 0.0048, F2,13 = 8.294; DLL1-NEUROD2-p = 0.0098, F2,13 = 6.748). Low and top lines represent the limits of the VZ and cortical plate (CP), respectively. Lines and dashed lines outline cells expressing or lacking expression of the indicated marker, respectively. SVZ Subventricular Zone, IP Intermediate Progenitors, N Neurons. Values are mean ± SEM; ns, not significant; *p < 0.05, **p < 0.01, ***p < 0.001. Scale bars: 50 µm (lower magnification), 10 µm (higher magnification). Source data are provided as a Source Data file.
Fig. 4
Fig. 4. BRN1/2 are required for the expression of microcephaly-associated genes and maintenance of the neuronal progenitor pool.
a Volcano plot: DEG between Brn1/2-cKO and control progenitors at E14.5 highlighting primary microcephaly genes (Monocle3 VGAM test; SD = 0.15; q < 0.05; Supplementary Data 3). b Luciferase reporter-activity of Aspm when co-expressed with Brn2 or Brn-Enr (n = 6/condition; two-sided unpaired t-test: Brn2: 100-p = 0.0128, 200-p = 0.0006, 400-p = 0.0015; Enr: 100-p = 0.0268, 200-p = 0.0018, 400-p = 0.0001). c ChIP-qPCR analysis of BRN1/2 binding to the indicated promoters/enhancers at E14.5 (n = 3/condition; two-sided unpaired t-test: Aspm-p = 0.0038, Stil-p = 0.0053, Cep135-p = 0.0011, Sass6-p = 0.4289). d In utero electroporation (IUE) in Brn1fl/fl;Brn2fl/fl mice at E14.5. Cell identities of the control, Brn1/2-cKO and Brn1/2-cKO + ASPM condition immunolabeled for RFP (red), Ki67 (e, grey), TBR2 (f, grey) and NEUROD2 (g, grey) at E16.5. Boxed area: higher magnification in inserts. Lines and dashed lines outlining cells expressing or lacking expression of the indicated marker, respectively (n = 5 CT, n = 4 cKO, n = 5 cKO+ASPM mice; one-way ANOVA-Dunnett’s multiple comparisons test: Ki67-p = 0.0132, F2,11 = 6.582; TBR2-p = 0.0055, F2,11 = 8.681; NEUROD2-p = 0.0033, F2,11 = 10.02). i pVIM immunolabeling in control and Brn1/2-cKO mice at E14.5. Arrowheads: pVIM+ cells outside of the VZ (oVZ). i’ Distribution of pVIM+ cells in control (CT) and Brn1/2-cKO (cKO) cortices (n = 7 mice/group; two-way ANOVA-Šídák’s multiple comparisons test: 1-p < 0.0001, 3-p = 0.0403, 4-p = 0.0025, F9,120 = 25.73). j pVIM+ cells in control and Brn1/2-cKO oVZ (n = 7 mice/group; two-sided unpaired t-test: p = 0.0122). k, k’ OLIG2 immunolabeling in cortical sections of control and Brn1/2-cKO mice at P0 (n = 3 mice/group; two-sided unpaired t-test: p = 0.0140). l Centriole number/PH3+ cell in the ventricular zone (VZ) of control and Brn1/2-cKO at E14.5 (n = 3 mice/group; two-sided unpaired t-test: <4-p = 0.0002, 4-p = 0.0383, >4-p = 0.1018). Arrows indicate centrioles. m Schematic of centrosome function and progenitor cell differentiation in control (black) and Brn1/2-cKO (red). Low and top lines represent the limits of the VZ and cortical plate (CP), respectively. Yellow asterisks indicate auto-fluorescent blood vessels. SVZ Subventricular Zone, UL Upper Layers, DL Deep Layers, APs Apical Progenitors. Values are mean ± SEM; *p < 0.05, **p < 0.01, ***p < 0.001. Scale bars: 50 µm (lower magnification; e-g, i, and k), 10 µm (higher magnification; e-g), 2 µm (l). Source data are provided as a Source Data file.
Fig. 5
Fig. 5. BRN1/2 function is conserved across mammalian species.
a In utero electroporation (IUE) in wild-type ferrets at E35. Cell identities of the control (CT) and Brn-Enr (B-Enr) condition immunolabeled for RFP (red), Ki67 (b, grey), TBR2 (c, grey) and NEUROD2 (d, grey) at E37 (n = 4 CT, n = 7 Brn-Enr ferrets; two-sided unpaired t-test: Ki67-p = 0.0014, TBR2-p = 0.0012, NEUROD2-p = 0.0004). f NOTCH1 (grey) expression in RFP+ cells of the electroporated ventricular zone (VZ) (n = 4 ferrets/group; two-sided unpaired t-test: p = 0.0099). g ASPM or CDK6 (grey) expression in RFP+ cells of the electroporated cortex (n = 3 CT, n = 4 Brn-Enr ferrets; two-tailed unpaired t-test: ASPM-p = 0.0006, CDK6-p = 0.0001). h RFP+ cells expressing OLIG2 (gray) in the electroporated cortex (n = 4 CT, n = 5 Brn-Enr ferrets; two-sided unpaired t-test: p = 0.0009). h’ Total OLIG2+ cells in the electroporated cortex (n = 4 CT, n = 5 Brn-Enr ferrets; two-sided unpaired t-test: p = 0.0226). i ScRNAseq DATA from E36 cortex of control (CT) and BRN2KO (KO) cynomolgus monkey re-analyzed using the same pipeline we used for the analysis in mice. UMAP of scRNAseq from control and BRN2KO by genotype (j) and cell type (k). l UMAP of gene signatures for apical progenitors (AP; e.g., NES), basal progenitors (BP; e.g., BTG2) and neurons (e.g., DCX) in control and BRN2KO. m UMAP of BP signature (1), MKi67 expression (2) and TRIcycle score (3) in control and BRN2KO. n UMAP of cells going through indirect and direct neurogenesis in control and BRN2KO. o Proportion of cells going through indirect and direct neurogenesis by genotype (Pearson’s Chi-squared test: p = 4.454e-12). p Expression of NOTCH signaling-associated genes in control and BRN2KO progenitors. q Expression of the indicated cortical upper layer (UL) and deep layer (DL) neuronal marker genes in control and BRN2KO neurons. r Expression of primary microcephaly DEG in BRN2KO progenitors compared to controls. Boxed areas: higher magnification in inserts. Lines and dashed lines outline cells expressing or not expressing the indicated marker, respectively. iSVZ Inner Subventricular Zone, oSVZ Outer Subventricular Zone. Values are mean ± SEM; *p < 0.05, **p < 0.01, ***p < 0.001. Scale bars: 50 µm (lower magnification), 10 µm (higher magnification). Source data are provided as a Source Data file.

References

    1. Lodato, S. & Arlotta, P. Generating Neuronal Diversity in the Mammalian Cerebral Cortex. Annu. Rev. Cell Dev. Biol.31, 699–720 (2015). 10.1146/annurev-cellbio-100814-125353 - DOI - PMC - PubMed
    1. Borrell, V. & Reillo, I. Emerging roles of neural stem cells in cerebral cortex development and evolution. Dev. Neurobiol.72, 955–971 (2012). 10.1002/dneu.22013 - DOI - PubMed
    1. Kalebic, N. & Huttner, W. B. Basal Progenitor Morphology and Neocortex Evolution. Trends Neurosci.43, 843–853 (2020). 10.1016/j.tins.2020.07.009 - DOI - PubMed
    1. Pinson, A. & Huttner, W. B. Neocortex expansion in development and evolution—from genes to progenitor cell biology. Curr. Opin. Cell Biol.73, 9–18 (2021). 10.1016/j.ceb.2021.04.008 - DOI - PubMed
    1. Pebworth, M. P., Ross, J., Andrews, M., Bhaduri, A. & Kriegstein, A. R. Human intermediate progenitor diversity during cortical development. Proc. Natl Acad. Sci. USA118, 1–10 (2021). 10.1073/pnas.2019415118 - DOI - PMC - PubMed

Publication types

MeSH terms

Associated data